USING WEIGH-IN-MOTION DATA TO PREDICT THE LIKELIHOOD OF
EXCEEDING THE CAPACITY OF A ROAD SAFETY BARRIER
Andrew Burbridge
Queensland University of Technology GPO Box 2434, Brisbane, Queensland, Australia
E-mail: andrew.burbridge@hdr.qut.edu.au Co-authors(s); Rod J. Troutbeck, Queensland University of Technology
ABSTRACT
Run-off road and head-on crashes together constitute around 38% of all casualty crashes and a higher proportion (closer to 50%) of all fatality crashes in Queensland, Australia. These statistics are a fair reflection of the national condition. Vehicles leaving the travelled way are a significant contributor to Australian road trauma. The Australian National Road Safety Strategy proposes a number of infrastructure treatments for tackling these two crash types, including the use of an appropriate road safety barrier. Road authorities deploy longitudinal road safety barriers primarily to prevent errant vehicles from impacting with hazardous roadside objects that could cause an adverse outcome for either the occupants of the errant vehicle or third parties. However, road safety barriers are not equal and are differentiated in the first instance by their capacity to contain impacts of different speed, mass and angle of incidence. While roadway departure speeds and departure angles are well-addressed in contemporary academic literature and methodologies for road safety barrier selection, the mass-distribution of the in-service vehicle fleet is less well represented. This study proposes the use of data obtained from weigh-motion technology to represent the mass-frequency distribution of the in-service vehicle fleet. Combined with roadway departures conditions reported by others, a methodology is presented for calculating the likelihood of vehicle-barrier impact exceeding the road safety barrier capacities prescribed by the predominant global test protocols for road safety barriers. The methodology is used to consider how different roadway configurations and traffic compositions might influence the likelihood of barrier capacity exceedance. The results from modelling of various scenarios are reported. The results suggest that the relative likelihood of barrier capacity exceedance varies as a function of cross-sectional geometry as well as traffic composition, so suggesting that a “one-size fits all” approach to road safety barrier selection is not appropriate.
1.
INTRODUCTION
Run-off road and head-on crashes together constitute around 38% of all casualty crashes and a higher proportion (closer to 50%) of all fatality crashes in Queensland, Australia (Queensland Department of Transport and Main Roads, 2013). These statistics are a fair reflection of the national condition. Vehicles leaving the travelled way are a significant contributor to Australian road trauma. The Australian National Road Safety Strategy (Australian Transport Council, 2011) proposes a number of infrastructure treatments for tackling these two crash types, including the use of an appropriate road safety barrier. However there is only limited guidance to determine the appropriate barrier for a site. Australian/New Zealand Standard AS/NZS 3845.1:2015 (Standards Australia, 2015) nominates the Manual for Assessing Safety Hardware (MASH) (AASHTO, 2009) as the preferred test protocol for the homologation of road safety barrier systems, although both NCHRP Report 350 (Ross et al., 1993)
and the European Normative EN1317 (European Committee for Standardization, 2010) are recognised. Road safety barriers are then differentiated in the first instance (albeit not solely) by their capacity to contain impacts of different vehicle mass, speed and angle of incidence.
To better understand what is meant by containment capacity, it is useful to consider the requirements of the three dominant global crash test protocols, being NCHRP Report 350, the Manual for Assessing Safety Hardware (MASH) and European Normative EN1317:2 (AASHTO, 2009; European Committee for Standardization, 2010; Ross, et al., 1993). In common with each is that road safety barriers are subjected to full scale crash testing under prescribed conditions, which are defined primarily in terms of the mass, speed and incidence angle of the impacting test vehicle. Resolving vehicle speed into a component perpendicular to the barrier permits the calculation of “lateral kinetic energy”, which is reported as “Impact Severity” and which is calculated in accordance with the expression at Equation A (Sicking & Ross Jr, 1986).
𝐼𝑆 = 1 2⁄ 𝑚(𝑣. sin 𝜃)2 Equation A
where
IS = Impact Severity (kJ)
m = mass (t)
v = vehicle speed (m/s)
θ = angle of incidence (degrees)
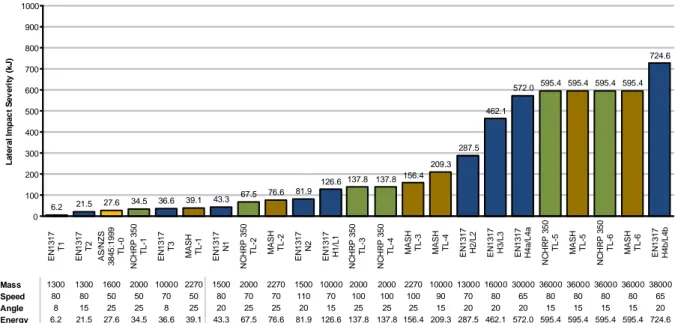
Figure 1 depicts the combinations of mass, speed and angle and resultant Impact Severity for the full suite of capacity tests nominated by three test protocols mentioned previously.
Figure 1: Prescribed capacity tests showing associated Impact Severities
Without being definitive, barriers intended to contain trucks, such as rigid concrete and steel barriers, are tested to meet the test standards that appear on the right-hand side of the figure: MASH TL-4 or NCHRP Report 350 TL-4 might reasonably represent the lower test threshold for these types of barriers. Barriers intended for containment of light passenger vehicles on high-speed roads, such as post-mounted rail, box-section and cable systems, are tested to the test standards centrally located in
6.2 21.5 27.6 34.5 36.6 39.1 43.3 67.5 76.6 81.9 126.6 156.4 209.3 287.5 462.1 572.0 595.4 595.4 595.4 595.4 724.6 0 100 200 300 400 500 600 700 800 900 1000 EN 1317 T1 EN 1317 T2 AS /N Z S 3845 :1999 TL -0 N C H R P 350 TL -1 EN 1317 T3 M AS H TL -1 EN 1317 N1 N C H R P 350 TL -2 M ASH TL-2 EN 1317 N2 EN 1317 H 1 /L 1 N C H R P 350 TL -3 N C H R P 350 TL -4 M ASH TL-3 M ASH TL-4 EN 1317 H 2 /L 2 EN 1317 H 3 /L 3 EN 1317 H 4 a /L 4 a N C H R P 350 TL -5 M ASH TL-5 N C H R P 350 TL -6 M ASH TL-6 EN 1317 H 4 b /L 4 b L a te ra l Im p a c t S e v e ri ty ( kJ ) Mass 1300 1300 1600 2000 10000 2270 1500 2000 2270 1500 10000 2000 2000 2270 10000 13000 16000 30000 36000 36000 36000 36000 38000 Speed 80 80 50 50 70 50 80 70 70 110 70 100 100 100 90 70 80 65 80 80 80 80 65 Angle 8 15 25 25 8 25 20 25 25 20 15 25 25 25 15 20 20 20 15 15 15 15 20 Energy 6.2 21.5 27.6 34.5 36.6 39.1 43.3 67.5 76.6 81.9 126.6 137.8 137.8 156.4 209.3 287.5 462.1 572.0 595.4 595.4 595.4 595.4 724.6 137.8 137.8
passenger vehicles on lower speed roads are tested to the test standards located to the left of the middle of the figure. Barriers meeting test standards to the far left of the figure are likely to be temporary work-zone barriers intended only for low-energy impacts.
Expressly outside the scope of Australian/New Zealand Standard AS/NZS 3845.1:2015 are criteria for site- or scenario-specific selection of a barrier type or system. The Standard is not a design document for the selection and placement of a road safety barrier system. The Guide to Road Design Part 6 (Austroads, 2009) offers that the determination of the required containment capacity of the barrier is a function of the “design vehicle to be retained by the road safety barrier”. However guidance to determine the design vehicle is limited to one paragraph:
“Road databases or traffic measurements can be used to determine the volume of heavy vehicles that use the road and whether or not heavy vehicles are to be used as the design vehicle. This decision will also be based on the consequences of a truck or bus impact.”
While no objective quantitative guidance on barrier selection is provided in the Austroads Guide to Road Design Part 6, the guide does refer to Australian/New Zealand Standard AS/NZS 4360:2004 Risk Management for purposes of quantitative analysis. AS/NZS 4360:2004 is superseded by Australian/New Zealand Standard AS/NZS ISO 31000:2009 Risk management – Principles and guidelines which defines risk as “the effect of uncertainty on objectives”, wherein an “effect” is defined as “deviation from the expected”, while “uncertainty" is defined as “the state, even partial, of deficiency of information related to, understanding or knowledge of an event, its consequence, or likelihood” (Standards Australia, 2009).
In terms of road safety barrier performance, risk exists at a number of levels. Risk exists in the likelihood of a vehicle becoming errant (an encroachment) and the consequences of that encroachment, which may be an impact with a road safety barrier. Risk also exists in the likelihood of an impact with a road safety barrier and the consequences of that impact, which may be exceedance of the capacity of the barrier. And risk exists in the likelihood of exceedance of the capacity of a road safety barrier and the consequences of that exceedance. The manifestation of risk considered here is the likelihood that an encroachment results in a vehicle-barrier impact that exceeds the known containment capacity of the system. Risk management principles require that post-treatment residual risk is tolerable, and to be deemed tolerable, the level of residual risk should be understood and as far as possible quantified. Hence in order for a practitioner to establish whether such residual risk is acceptable it is necessary to assess and quantify it, and while the consequences of capacity exceedance are beyond the scope of this study, such consequences are a function of the likelihood of the road safety barrier containment capacity being exceeded. Thus, informed acceptance of the residual risk can only occur if the likelihood of the road safety barrier containment capacity being exceeded is understood.
2.
EXISTING METHODOLOGIES
Methodologies do exist for predicting the likelihood of the capacity of a barrier being exceeded. Sicking and Ross (Sicking & Ross Jr, 1986) describe a methodology for calculating the Impact Severity (IS) using roadway departure speed and angle distributions in the form of a 6 x 6 table giving 36 combinations of “impact velocity and angle distributions”. Sicking and Ross assume that roadway departure is independent of vehicle size and use the proportion of vehicles of certain sizes in the traffic stream to calculate Impact Severity in accordance with the expression in Equation A.
NCHRP Report 638 (Sicking et al., 2009) uses distributions of mass, speed and angle to calculate likelihood of barrier penetration using the Roadside Safety Analysis Program (RSAP) version 2 (Mak
& Sicking, 2003). Impact speeds and angles derive from an earlier study by Mak and Mason, while traffic composition is a fixed function of the functional classification of the road. Distributions of larger vehicles (trucks) are determined according to body shape via the proxy of highway functional class. However, no mass-frequency distribution of the light vehicle fleet is considered.
Version 3 of RSAP (Ray et al., 2012) employs a range of vehicle trajectories based on the findings of NCHRP Report 665 (Mak et al., 2010) in order to predict whether a vehicle will impact with a roadside hazard. In order to predict the likelihood of barrier penetration, RSAP uses both a statistical approach and a mechanistic approach in which the demonstrated containment capacity of a road safety barrier is compared with the Impact Severity of a modelled impact. The mechanistic approach is used to predict severity of truck impacts, while the statistical approach is used for light passenger vehicle impacts. The statistical approach is justified by the authors on the basis that while the mechanistic approach may be based in physics, the understanding of the physical interface between all vehicles and the possible interactions with a road safety barrier are insufficiently understood: some barrier penetrations occur even when capacity has not been exceeded, while penetrations may not occur even when barrier capacity has been reached (Ray, et al., 2012). Stolle and Sicking for example find this to be the case for wire rope barrier (Stolle & Sicking, 2013). A stated advantage of the statistical approach is that an understanding of the physics of the problem is not required since the data represents real events. Conversely a disadvantage of the statistical approach is that crash data may not be available, particularly for new barriers.
The RSAP application is used by Ray et al (Ray et al., 2013) who present a procedure for the selection of “bridge railings” specified in accordance with MASH as a function of (among other things) traffic volume and percentage of trucks, which the authors state can be used to develop most other roadside safety selection and location tables.
Montella (Montella, 2001) presents a European barrier selection study that uses a similar methodology to that of Sicking and Ross (Sicking & Ross Jr, 1986) described above. The study employs 49 combinations of impact speed and impact angle, each with discrete occurrence probabilities, to predict the likelihood of barrier breach for a range of impacting vehicles. Probability distributions of impact angle and impact speed are derived from Mak et al’s study of impact conditions for run-off road crashes (Mak et al., 1986). Analysis is conducted using 17 vehicle classifications, two of which are passenger cars: 900 kg and 1,500 kg, which are consistent with the masses of the test vehicles nominated in European Normative EN1317-2 (European Committee for Standardization, 2010). Barrier capacity exceedance is calculated by comparison with the expression in Equation A.
The UK Highways Agency Road Restraint Risk Assessment Process (RRRAP) (Highways Agency UK, 2011) assigns to each classification of barrier a default likelihood of penetration. While the application is intended only for use on roads with a traffic volume not less than 5,000 AADT and with a speed of 80 km/h or greater, the risk of penetration is not a function of roadway speed or geometric configuration.
La Torre et al (La Torre et al., 2014) report on efforts by the Conference of European Directors of Roads (CEDR) to develop a tool that will allow the selection of the most appropriate solution in different road and traffic configurations. The “SAVeRS” (Selection of Appropriate Vehicle Restraint Systems) project publish a guideline (La Torre et al., 2015) that identifies that “one critical parameter to understand is the structural capacity, or containment level, of a VRS”. The guideline provides default capacity exceedance likelihoods for “passenger cars", based on studies by others, as a function
of roadway class and speed distribution, noting that “the user can add a user defined curve” (La Torre, et al., 2015).
In summary, the methodologies introduced above are common insofar as likelihood of barrier capacity exceedance is held be of importance in the selection of an appropriate road safety barrier. RSAP, RRRAP and SAVERS use statistical data to predict the likelihood of barrier exceedance for light vehicles. It is arguable that the statistical approach may fail users if the data collected is not cognisant of site-specific variables that would be expected to influence the outcome. For example, SAVERS and RSAP employ a mechanistic model to predict the risk of exceedance for heavy vehicles. Key variables influencing the mechanistic approach are:
Vehicle mass
Vehicle impact speed Vehicle impact angle Pavement-tire friction
Lateral clearance between road safety barrier and travel lane.
However, the statistical approach does not explicitly adjust for these variables, which may be implicit in the empirical data, but which generally are not reflected in the modelling. Montella’s method (Montella, 2001) uses a purely mechanistic approach for all vehicles, but represents the light vehicle fleet by only two vehicle masses. Ray et al (Ray, et al., 2013) for example state explicitly that risk of penetration of a barrier was found to increase with an increase in shoulder width from 1 foot to 4 feet, and that an 8 foot wide median was found to be the critical width, but as already stated RSAP uses statistical data rather than a mechanistic approach for calculating risk of penetration by members of the light vehicle fleet.
3.
OBJECTIVES
The aim of this study is to show by calculation how the likelihood that a vehicular encroachment will exceed the demonstrated containment capacity of a barrier may vary as a function traffic composition and barrier offset from the travelled way. The objective is to develop the basis of a conceptual numerical model which can be used to calculate the likelihood of a given road safety barrier capacity being exceeded as a function of traffic composition and cross-sectional geometry. Impact Severity thresholds representing the capacity tests of the three primary test protocols are used as benchmarks against which a probability of exceedance is to be measured. Uniquely, traffic composition, including a representation of the mass-frequency distribution of the in-service light vehicle fleet, is modelled using in-service mass data obtained from a weigh-in-motion (WIM) site.
4.
METHODOLOGY
This study adopts elements from the methodologies and studies described in Section 2. Particularly, the methodology used in this study is conceptually similar to the methodologies presented by Sicking and Ross (Sicking & Ross Jr, 1986) and Montella (Montella, 2001), and is influenced by work by Ray et al (Ray, et al., 2013). Given that risk is a product of exposure and consequence, risk of capacity exceedance is a product of the probability that an impact occurs and the probability that the impact exceeds the capacity of the road safety barrier. Impact Severity is a function of the mass of the impacting vehicle, impact speed and impact angle. If the probability of occurrence of each of these parameters is known, then the probability of a given Impact Severity occurring and hence exceedance of a known threshold can be calculated. In this study, roadway departure speeds and angles are modelled with occurrence probabilities, as reported by others, and capped according to the principles
of the point-mass model. The following subsections (numbered 4.1 to 4.5) describe the elements of the methodology in more detail.
4.1. Lateral encroachment
In the first instance, the probability that an impact occurs is the product of the probability of a vehicle leaving a lane and the probability that it will reach the object. Lateral encroachment is the distance that a vehicle travels after departure from the travelled way, and is, and continues to be, well studied and documented by others, e.g., (Doecke & Woolley, 2011; Levett, 2007; Mak & Sicking, 2003; Mak, et al., 2010; McLean, 2002; Sicking & Ross Jr, 1986; Stonex & Skeels, 1963). This research commonly results in curves representing the probability of exceeding a lateral offset. The methodology developed here employs the lateral encroachment curves published in the Roadside Design Guide 1996 (AASHTO, 1996).
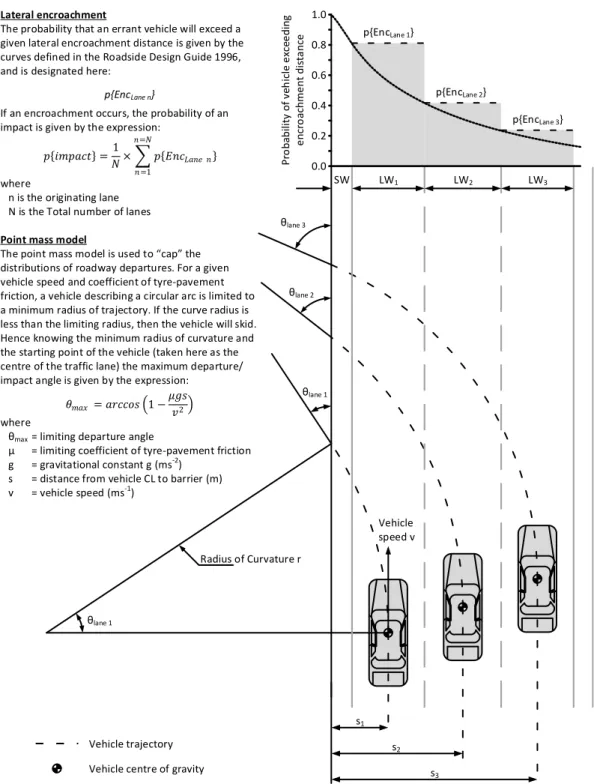
For the purpose of this study, the likelihood that an errant vehicle impacting a roadside barrier originates from a given traffic lane is the product of the probability of the vehicle originating from that lane and the probability that the vehicle will reach the object. Assuming homogeneity of both traffic lane occupancy and traffic lane departures in terms of both volume and composition, the probability that an errant vehicle becomes errant from any lane (where total number of lanes is N) is 1/N. And thereafter the probability that an errant vehicle will reach a given offset from lane n is given by the probability of exceeding the lateral distance between the point of departure and the offset itself. Hence the probability that a vehicle will hit an object is the product of the two. This is depicted in Figure 2. Notably Carrigan et al (Carrigan et al., 2014) propose that “heavy vehicles encroach at approximately 30 percent of the rate for all vehicles”, and that this difference “should be accounted for in the modeling of run-off-road crashes for roadside safety benefit-cost and risk analyses”. Consistent with those findings, the encroachment rate used in this study for trucks is assumed to be 0.3 times the rate of all vehicles, when classified according to the Austroads vehicle classification (Luk, 2006).
4.2. Roadway departure conditions
Roadway departure conditions employed in this study are those provided by Mak et al (Mak, et al., 2010) who report departure conditions associated with serious roadway departure crashes. Roadway departure speeds are normally distributed, while roadway departure angle can be modelled using a gamma distribution fit to the square root of departure angle, while departure angle and departure speed can be considered to be independent. As such, given the probability distributions for both departure speed and departure angle, it is possible to quantify the probability of occurrence for any specified combination of roadway departure angle and departure speed. Distributions are modelled numerically, adopting intervals of 1 km/h for departure speed and 1˚ for departure angle, respectively from 0 to 160 km/h and from 0 to 90˚. For the purpose of this study, the conditions determined by Mak et al for a road with a posted speed of 65 mph are taken to represent posted speed of 100 km/h.
4.3. Point-mass model
Illustrated in Figure 2 the point-mass model can be used to investigate the maximum departure/impact angle that can be attained for any given vehicle speed for any cross-section geometry (lane configuration), shoulder width and tyre-pavement friction (Jehu & Pearson, 1977; Mak & Bligh, 2002). In explanation, for a given vehicle speed and coefficient of tyre-pavement friction, a vehicle describing a circular arc is limited to a minimum radius of trajectory. If the curve radius is less than the limiting radius, then the vehicle may be expected to skid.
Figure 2: Lateral encroachment model used in this study (adapted from (Jehu & Pearson, 1977)/(Mak & Sicking, 2003)/(AASHTO, 1996))
Hence, knowing the minimum radius of curvature and the starting point of the vehicle (taken here as the centre of the traffic lane) the maximum roadway departure/impact angle can be calculated. The point-mass model is used in this study to “cap” departure conditions by eliminating those combinations of conditions that are unrealistic. So for any given combination of cross-sectional geometry (lane configuration) and shoulder width, and tyre-pavement friction, the combined probability distribution of departure speed and departure angle is truncated and then normalized so that
θlane 1 θlane 2 θlane 3 s1 s2 s3 θlane 1 Vehicle speed v Radius of Curvature r 1.0 p{EncLane 1} p{EncLane 2} 0.8 0.6 0.4 0.2 0.0 p{EncLane 3} LW1 LW2 LW3 SW Lateral encroachment
The probability that an errant vehicle will exceed a given lateral encroachment distance is given by the curves defined in the Roadside Design Guide 1996, and is designated here:
If an encroachment occurs, the probability of an impact is given by the expression:
where
n is the originating lane N is the Total number of lanes Point mass model
The point mass model is used to “cap” the distributions of roadway departures. For a given vehicle speed and coefficient of tyre-pavement friction, a vehicle describing a circular arc is limited to a minimum radius of trajectory. If the curve radius is less than the limiting radius, then the vehicle will skid. Hence knowing the minimum radius of curvature and the starting point of the vehicle (taken here as the centre of the traffic lane) the maximum departure/ impact angle is given by the expression:
where
θmax = limiting departure angle
μ = limiting coefficient of tyre-pavement friction g = gravitational constant g (ms-2)
s = distance from vehicle CL to barrier (m) v = vehicle speed (ms-1) P ro ba bi lity o f ve h ic le e xc ee di ng e ncr o ac hm e nt di sta nce p{EncLane n} 𝑝 𝑖𝑚𝑝𝑎𝑐𝑡 =1 𝑁× 𝑝 𝐸𝑛𝑐𝐿𝑎𝑛𝑒 𝑛 𝑛=𝑁 𝑛=1 𝜃𝑚𝑎𝑥 = 𝑎𝑟𝑐𝑐𝑜𝑠 1 − 𝜇𝑔𝑠 𝑣2 Vehicle trajectory Vehicle centre of gravity
the occurrence probabilities have an aggregate value of unity. Assuming that the angle and speed distributions are independent of vehicle mass, it is possible to calculate the likelihood that a given Impact Severity will be exceeded by any vehicle mass.
A uniform tyre-pavement friction value of 0.6 is adopted consistent with the default values adopted by La Torre et al (La Torre, et al., 2015) for single unit trucks. It is accepted that different values for different vehicles may be more appropriate. La Torre et al, for example, adopt a value of 0.45 for tractor-trailers, while McLean et al (McLean et al., 2002) state that values for “loaded large trucks typically ranges from about 0.30 to 0.5”. Chowdhury (Chowdhury et al., 1998) reports that “modern cars on dry pavement are capable of generating friction coefficients of 0.65 and higher before skidding” and that “…friction coefficients of 0.40 and higher are typical on wet pavements”. Moreover it is acknowledged that for high centre-of-gravity vehicles, the limiting outcome may be rollover rather than skid, which would support the adoption of a lower value for these vehicle types. In terms of barrier capacity exceedance risk it is expected that lower values may return less conservative results while higher values may return more conservative results.
4.4. Mass of Vehicle Fleet
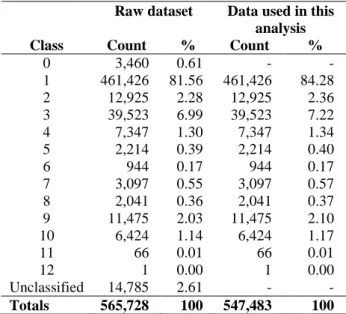
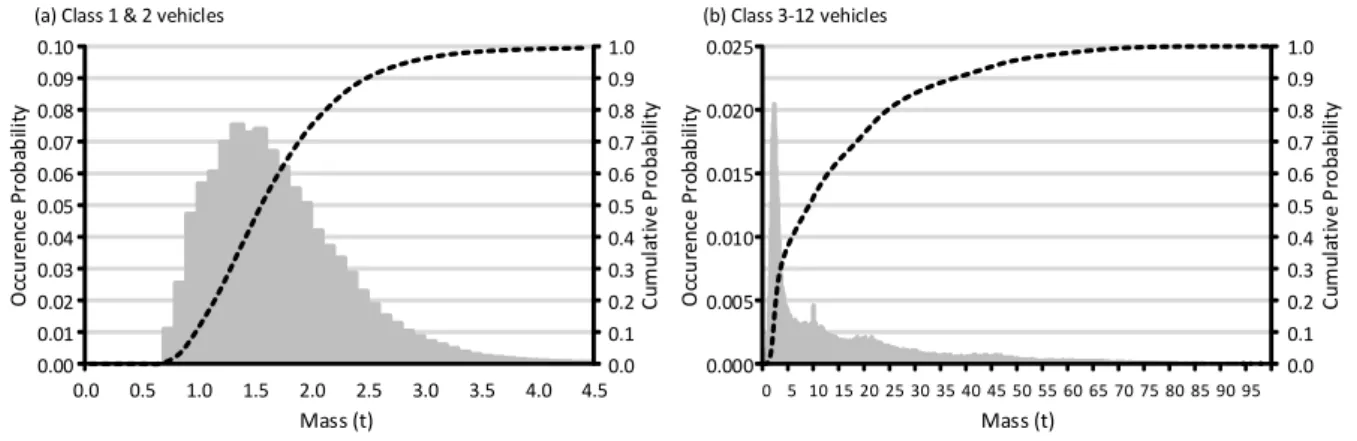
A sample of weigh-in-motion data is taken to represent the mass-frequency distribution of the vehicle fleet. The data was collected over a full seven-day period from 1 March 2014 to 7 March 2014 at a weigh-in-motion site at Nudgee on the Gateway Motorway in southeast Queensland, Australia. The data is cleansed initially to remove obviously spurious data. Vehicles are sorted by the Austroads vehicle classification (Luk, 2006) and into 100 kg classification bins ranging from 0-100 kg up to 99.9-100 tonnes. Any two axle configuration vehicles with axle spacing less than 1.8 m and mass less than 0.8 t are excised as a “motorcycle” (“Class 0”), but the data is otherwise taken at face value. The occurrence frequency distributions of vehicles by vehicle class based on the cleansed seven-day data set are provided in Table 1. Graphical representations of the mass data are provided in Figure 3. Depicted separately are classes 1-2 and 3-12, since these two groups of vehicle classifications represent respectively light vehicles and trucks.
Table 1 Frequency distribution of vehicle classes from weigh-in-motion data Raw dataset Data used in this
analysis
Class Count % Count %
0 3,460 0.61 - - 1 461,426 81.56 461,426 84.28 2 12,925 2.28 12,925 2.36 3 39,523 6.99 39,523 7.22 4 7,347 1.30 7,347 1.34 5 2,214 0.39 2,214 0.40 6 944 0.17 944 0.17 7 3,097 0.55 3,097 0.57 8 2,041 0.36 2,041 0.37 9 11,475 2.03 11,475 2.10 10 6,424 1.14 6,424 1.17 11 66 0.01 66 0.01 12 1 0.00 1 0.00 Unclassified 14,785 2.61 - - Totals 565,728 100 547,483 100
4.5. Scenarios
204 base scenarios are modelled, representing combinations of the number of traffic lanes from 1 to 4 (n=4) and barrier lateral offset from 0 metres to 25 metres at 0.5 m intervals (n=51). A 25 metre lateral offset is adopted as an arbitrary upper limit that it is likely to be comfortably beyond the maximum lateral offset that will be need to be considered for normal design purposes. For simplicity, the posted speed is taken as 100 km/h, as typical of the posted speed of higher order roads in Queensland, Australia. Consistent with guidance for multi-lane roads in the Road Planning and Design Manual of the Queensland Department of Transport and Main Roads, lane width is taken as 3.5m for any unbounded outermost lanes, and 3.7m for any lane that is bounded on both sides by another lane (Queensland Department of Transport and Main Roads, 2005). Limiting tyre-pavement friction is taken as 0.6 for all vehicles, as is discussed earlier in section 4.3. Each of the 204 scenarios is subjected to a range of traffic compositions comprising the percentage of trucks (class 3-12 vehicles) varied from zero to one hundred (0%, 1%, 2%, 5%, 10%, 20%, 50%, 100%).
Figure 3: Mass-frequency distribution of (a) Class 1 and 2 vehicles and (b) Class 3-12 vehicles measured at WIM site.
5.
RESULTS
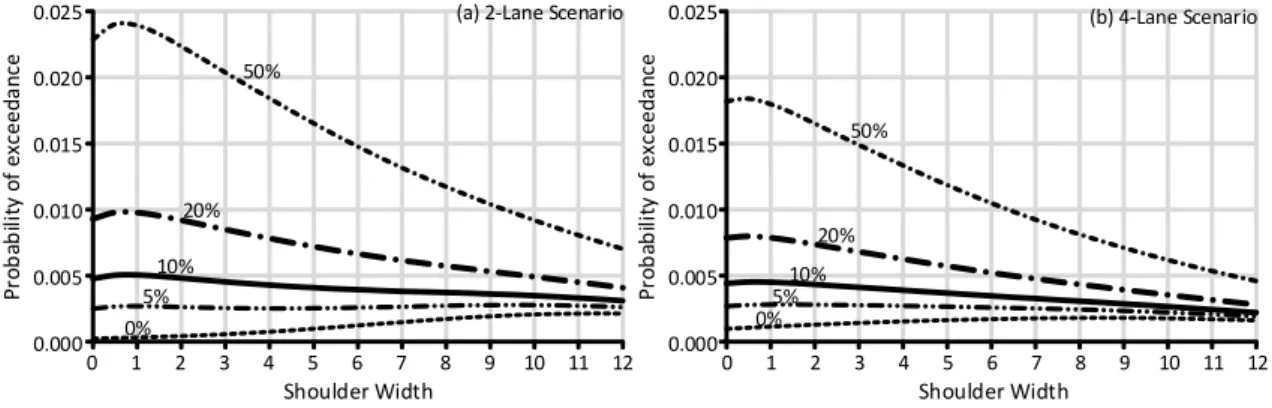
Figure 4 shows how the probability of a vehicle encroachment resulting in a vehicle-barrier impact exceeding 137.81 kJ, which is equivalent to an NCHRP Report 350 test level TL-3 impact, might vary as a function of lateral offset and the percentage of trucks in the traffic mix. Such risk is generally higher per vehicle in the two-lane scenario (left panel) than in the four-lane scenario (right panel). However, the exceedance probability associated with class 1 and 2 vehicles (depicted by the 0% trucks line) is conversely higher in the four-lane scenario than in the two-lane scenario for barriers up to about 8 metres offset. Considering both scenarios together, the probability of a class 1/class 2 vehicle impact exceeding the capacity of the TL-3 barrier appears to peak where the lateral offset to the barrier is between 7.5 and 11.5 metres. The lateral offset at which this peak exceedance probability occurs reduces to around one metre as the percentage of trucks in the traffic mix increases.
0.00 0.01 0.02 0.03 0.04 0.05 0.06 0.07 0.08 0.09 0.10 0.0 0.5 1.0 1.5 2.0 2.5 3.0 3.5 4.0 Mass (t) 0.000 0.005 0.010 0.015 0.020 0.025 0 5 10 15 20 25 30 35 40 45 50 55 60 65 70 75 80 85 90 95 4.5 Mass (t) O cc u re n ce P ro b ab ili ty C u m u la ti ve P ro b ab ili ty O cc u re nc e Pr ob ab ili ty 0.0 0.1 0.2 0.3 0.4 0.5 0.6 0.7 0.8 0.9 1.0 0.0 0.1 0.2 0.3 0.4 0.5 0.6 0.7 0.8 0.9 1.0 C um ul at iv e P ro ba bi lit y
Figure 4: Graphs of probability of a vehicle encroachment resulting in an impact exceeding 137.81 kJ Impact Severity as a function of barrier lateral offset (shoulder width) and % trucks for two-lane scenario (left) and four-lane scenario (right). In both cases, limiting tyre-pavement friction is taken as 0.6 for all vehicles.
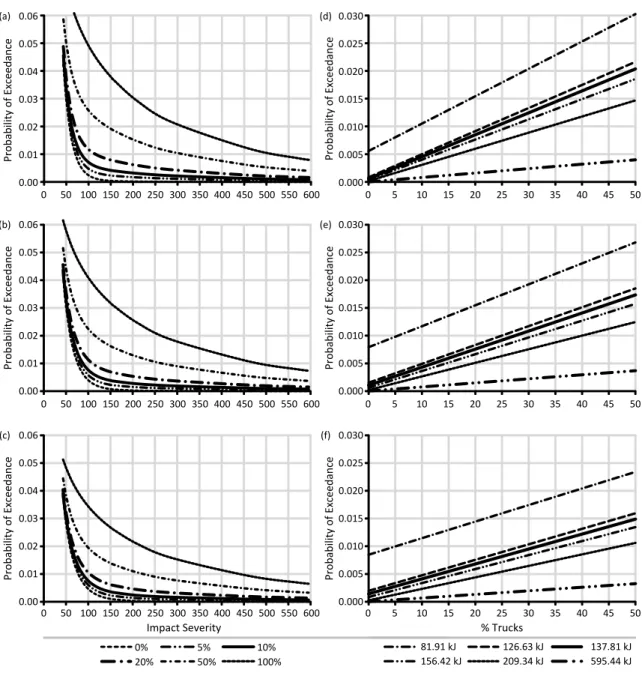
The panels in Figure 5 together show how the probability of exceeding a given Impact Severity threshold might vary as a function of traffic composition (% trucks) and number of traffic lanes, for a road with a fixed barrier offset of 3 metres from the edge line.
Notably the probability of an encroachment exceeding any given barrier capacity increases linearly as the proportion of truck volume increases (panels d-f). Also, the probability of exceeding any given Impact Severity value escalates much more rapidly for values less than about 100 kJ than it does for values more than about 150 kJ for traffic mixes with truck volumes up to about 20% (panels a-c). Together, the results indicate that the probability associated with exceeding the capacity of an EN1317:2 N2 class barrier (81.9 kJ) is substantially elevated over the probability of exceeding an EN1317:2 H1/L1 class barrier (126.6 kJ), whereas the probability of exceeding an EN1317:2 H1/L1 class barrier (126.6 kJ) is not substantially elevated over the probability of exceeding an NCHRP Report 350 TL-3 barrier (137.8 kJ).
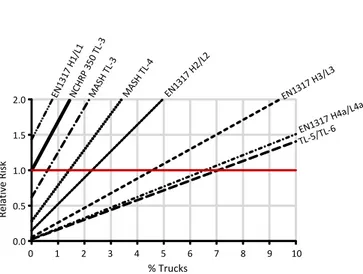
In terms of quantitative comparison, the relative likelihood of an encroachment exceeding the capacities of the common/default road safety barriers can be extracted. For example, the data produced by the modelling for the 2-lane 3 metre barrier offset scenario is tabulated in Table 2, which shows the likelihood of barrier exceedance indexed relative to the probability of traffic composition containing 0% trucks exceeding the capacity of an NCHRP Report 350 TL-3 barrier. This level of containment capacity is selected because it corresponds with the default barrier requirement prescribed by Queensland Department of Transport and Main Roads Road Planning and Design Manual (Queensland Department of Transport and Main Roads, 2014). Translating this data into a graphical representation (Figure 6), it can be seen that if such a barrier presents a threshold of acceptable risk for this scenario (2-lane 3 metre barrier offset) with 0% trucks, then the same level of protection against capacity exceedance would require (for example) a MASH TL-3 barrier when presented with 0.6% trucks, a MASH TL-4 barrier with 1.4% trucks, and a TL-5 barrier with 7.1% trucks.
While not presented graphically here, notwithstanding traffic volumes, using the same risk threshold in (for example) a 4-lane 3 metre offset scenario, a MASH TL-4 is required for 1.5% trucks and a MASH TL-5 barrier is required for 8.6% trucks.
0% 5% 10% 20% 50% 0.000 0.005 0.010 0.015 0.020 0.025 P ro b ab ili ty o f ex ce ed an ce 0.000 0.005 0.010 0.015 0.020 0.025 Pr ob ab ili ty o f ex ce ed an ce 0 1 2 3 4 5 6 7 8 9 10 11 12 Shoulder Width 0 1 2 3 4 5 6 7 8 9 10 11 12 Shoulder Width 0%5% 10% 20% 50%
Figure 5: Graphs showing variation in probability of exceeding the capacity of a barrier as a function of percentage trucks in the traffic mix, and lane configuration. Panels (a) and (d) depict a two lane scenario, panels (b) and (e) depict a three lane scenario and panels (c) and (f) represent a four lane scenario. All panels are based on a shoulder width (i.e., offset to barrier) of 3 metres.
Table 2 Relative likelihood of an encroachment exceeding the capacities of the common/default road safety barriers for the 2-lane 3m barrier offset scenario (posted speed 100 km/h)
% Trucks N2 H1/ L1 350 TL-3 MASH TL-3 MASH TL-4 H2/ L2 H3/ L3 H4a/ L4a TL-5/ TL-6 0 9.70 1.43 1.00 0.62 0.28 0.15 0.05 0.03 0.03 1 10.56 2.16 1.69 1.25 0.79 0.52 0.26 0.18 0.16 2 11.42 2.88 2.38 1.89 1.29 0.89 0.47 0.32 0.30 5 13.99 5.06 4.45 3.79 2.81 2.02 1.09 0.77 0.72 10 18.29 8.68 7.89 6.95 5.34 3.88 2.13 1.51 1.41 20 26.88 15.93 14.78 13.29 10.39 7.62 4.20 2.99 2.79 50 52.66 37.68 35.45 32.30 25.55 18.82 10.42 7.43 6.93 100 95.62 73.93 69.91 63.99 50.83 37.50 20.78 14.83 13.84 P ro b ab ili ty o f Ex ce ed an ce 0.00 0.01 0.02 0.03 0.04 0.05 0.06 0 50 100 150 200 250 300 350 400 450 500 550 600 0 5 10 15 20 25 30 35 40 45 50 0.000 0.005 0.010 0.015 0.020 0.025 0.030
Impact Severity % Trucks
0.00 0.01 0.02 0.03 0.04 0.05 0.06 0.00 0.01 0.02 0.03 0.04 0.05 0.06 0.000 0.005 0.010 0.015 0.020 0.025 0.030 0.000 0.005 0.010 0.015 0.020 0.025 0.030 0 50 100 150 200 250 300 350 400 450 500 550 600 0 5 10 15 20 25 30 35 40 45 50 0 50 100 150 200 250 300 350 400 450 500 550 600 0 5 10 15 20 25 30 35 40 45 50 20% 50% 100% 0% 5% 10% 81.91 kJ 126.63 kJ 137.81 kJ 156.42 kJ 209.34 kJ 595.44 kJ P ro b ab ili ty o f Ex ce ed an ce P ro b ab ili ty o f Ex ce ed an ce P ro b ab ili ty o f Ex ce ed an ce P ro b ab ili ty o f Ex ce ed an ce P ro b ab ili ty o f Ex ce ed an ce (a) (b) (c) (d) (e) (f)
Figure 6: Relative risk of an encroachment exceeding capacity of common/default road safety barriers for the 2-lane 3 metre lateral offset scenario (from data in Table 2).
6.
LIMITATIONS
It is acknowledged that this model is simplistic. In terms of mass, it assumes that the mass-frequency distribution derived from the weigh-in-motion site is (i) representative in terms of mass-frequency distribution of the broader vehicle fleet, and (ii) representative of the inertial mass in an impact. The former assumption is arguably as valid as universal application of a single probability of an impact resulting in a penetration. The second assumption requires further work, but is arguably no less valid than an assumption that the mass-frequency distribution of the vehicle fleet is represented by vehicle tare mass. A useful refinement to the model would be to adopt site-specific mass-frequency and class-frequency data, if available.
The model in its current form also assumes that the vehicle fleet is distributed homogenously across multiple traffic lanes, which is likely to be not the case. This requires further refinement. Also, the applicability of the roadway distribution data provided by Mak et al (Mak, et al., 2010) to vehicles other than light passenger vehicles is questionable. Combined with the reservations about the use of a single uniform tyre-pavement friction value discussed in the text at section 4.3, the trajectory model assumed here may be expected to over-estimate the likelihood that the capacity of a barrier will be exceeded. Additional refinements to this model would need to include consideration of vertical and horizontal geometry, as well as needing to include for consideration of the applicability of the roadway departure conditions and point-mass model to vehicle classifications other than light passenger vehicles.
7.
DISCUSSION
It is important to recognize that this conceptual model does not predict probability of barrier penetration, but rather the probability that a vehicle encroachment will result in an impact that exceeds the demonstrated capacity of the barrier. Ray et al (Ray, et al., 2012) state that a “barrier may often contain and redirect the vehicle even though there are structural failures; in other words, reaching capacity does not necessarily mean the vehicle will penetrate the barrier”.
However, this model satisfactorily returns results consistent with what is already known (e.g., through the work of others (Montella, 2001; Ray, et al., 2013)): that probability of exceedance of the capacity
0.0 0.5 1.0 1.5 2.0 0 1 2 3 4 5 6 7 8 9 10 R el at iv e R is k % Trucks NCH RP 3 50 T L-3 MAS H T L-3 MAS H T L-4 EN13 17 H 2/L2 EN13 17 H 1/L1 EN131 7 H3/L 3 EN1317 H4a/L4 a TL-5 /TL-6
suggest that capacity exceedance is dominated by the proportion of the traffic mix that are trucks. It is acknowledged however that adoption of a lower value of tyre-pavement friction value for some truck types consistent with the European approach (La Torre, et al., 2015) may mitigate this effect.
Perhaps importantly, the results indicate that some probability of capacity exceedance exists even for traffic compositions comprising no trucks. This quantum of risk (refer Table 2) may be several orders of magnitude higher for an EN1317:2 N2 barrier than for a NCHRP Report 350 TL-3 barrier. This finding should be of interest to practitioners. An EN1317:2 N2 barrier is the default barrier prescribed in the United Kingdom (Highways Agency UK, 2011), whereas the default containment level prescribed for use on state-controlled roads in Queensland is an NCHRP Report 350 test level TL-3 barrier (Queensland Department of Transport and Main Roads, 2014).
Further, the exceedance probability associated with the light vehicle fleet alone is shown by this model to escalate with increasing offset of the barrier from the road edge, with peak exceedance probability occurring at 11.5 metres for a two-lane scenario and 7.5 metres for a four-lane scenario. Notably, an increase in exceedance probability as a function of offset is less pronounced for traffic mixes containing trucks, for which a maximum probability of capacity exceedance is observed to occur at around 1 metre offset. It is suggested that for trucks, it is vehicle mass that is dominant in the Impact Severity calculation, whereas for light passenger-vehicles, it is the combination of impact angle and impact speed that is dominant. For quantitative comparison, Ray et al (Ray, et al., 2013) observed a similar peak at around 8 feet (~2.4 m) offset from the edge line. While the scenarios modelled include paved (i.e., f=0.6) offsets up to (an improbable) 25 metres, the principle is important to recognize, especially when considering deployment of a single barrier to provide physical barrier separation between traffic in a wide median. This is because while exposure to risk of capacity exceedance diminishes with offset distance, it is also apparent that the maximum possible departure angle and hence impact angle increases with lateral offset. The maximum possible impact angle of departure/impact is lower for a narrow configuration than a wider one. This has relevance not just in terms of probability of barrier capacity exceedance, which is the subject of this study, but also risk of occupant injury. Doecke and Woolley (Doecke & Woolley, 2011) report for example that “ideally the barrier would be placed as close to the edge of road as practical to reduce the angle at which it may be struck”, while Naish and Burbridge (Naish & Burbridge, 2015) show how occupant risk indicators measured during crash testing might be expected escalate for small vehicles as a function of increasing Impact Severity. While capacity exceedance is one parameter governing barrier selection, occupant severity outcome is another.
Earlier researchers have considered whether European Normative EN1317, MASH and NCHRP Report 350 might be used interchangeably (Anghileri, 2013; Hubbell, 2013), but no definitive guidance has been developed. Such design guidance would be particularly useful in the Australian context where both the U.S. and European test protocols enjoy recognition. This study may be expected to contribute to the development of such design guidance. Acknowledging the earlier work of both Ray et al (Ray, et al., 2013) and Montella (Montella, 2001), this model might be used by practitioners in the Australian context in the selection of appropriate road safety barriers, cognizant of truck volumes, real traffic mass-frequency data and geometric configuration.
In terms of future work, which would be expected to involve some field validation of the model, the authors suggest that empirical barrier effectiveness studies, and especially those reporting on barrier penetration or breach such as that presented by Yang and Zhang (Yang & Zhang, 2013), might usefully include data pertaining to the following variables:
Operating speed,
Traffic composition, including mass-frequency distribution of the vehicle fleet, Tyre-pavement friction values,
Detail of the barrier, e.g., height, post spacing, shape, rope configuration, tension.
8.
CONCLUSION
The aim of this study was to show by calculation how the likelihood that a vehicular roadway departure might exceed the demonstrated containment capacity of a road safety barrier might vary as a function of traffic composition and cross-sectional geometry. Subject to the limitations described this has been achieved. Consistent with the objective of the study, a conceptual numerical model has been constructed that may be used to calculate the likelihood of the capacity of a given road safety barrier being exceeded as a function of traffic composition, mass-frequency distribution and cross-sectional geometry. This model can be used to compare “relative risk” of exceedance of the capacity of a range of common or default road safety barriers that are tested to meet different test standards. Uniquely, the model uses weigh-in-motion data to represent the mass-frequency distribution of both the light passenger vehicle fleet and the truck fleet.
204 base scenarios have been modelled, representing combinations of the number of traffic lanes from 1 to 4 (n=4) and barrier lateral offset from 0 metres to 25 metres at 0.5 metre intervals (n=51). Each scenario has been subjected to a range of traffic compositions comprising the percentage of trucks (class 3-12 vehicles) varied from zero to one hundred (0%, 1%, 2%, 5%, 10%, 20%, 50%, 100%). The results from modelling various scenarios show how the relative likelihood of barrier capacity exceedance varies as a function of traffic composition and cross-sectional geometry. As might be expected, the percentage of trucks in the traffic stream is a dominant factor in the likelihood of a barrier’s capacity being exceeded. Perhaps importantly, the results indicate that some probability of capacity exceedance exists even for traffic compositions comprising no trucks, and that this quantum of risk may be several orders of magnitude higher for an EN1317:2 N2 barrier than for an NCHRP Report 350 TL-3 barrier. As such this model is expected to be useful in the Australian context where design guidance for the selection of an appropriate road safety barrier is not well developed and both the U.S. and European test protocols enjoy recognition.
In terms of cross-sectional geometry, probability of barrier capacity exceedance seems generally to peak with the barrier placed around one metre offset. This result is observed to be driven by the exposure to truck impacts. However, for light-passenger vehicle impacts only, the lateral offset at which peak exceedance occurs is somewhat greater, depending on the number of traffic lanes. This finding has relevance not just in terms of risk of barrier capacity exceedance, which is the subject of this study, but also probability of occupant injury.
In summary, the results suggest that the relative likelihood of barrier capacity exceedance varies as a function of cross-sectional geometry, as well as traffic composition, so suggesting that a “one-size fits all” approach to road safety barrier selection is not appropriate.
9.
ACKNOWLEDGEMENTS
The authors acknowledge the support of the Queensland Government Department of Transport and Main Roads, from whom the weigh-in-motion data was obtained. The authors also thank the two anonymous reviewers for their valuable comments.
REFERENCES
AASHTO. (1996). Roadside Design Guide, 2nd Edition. Washington, D.C., U.S.A.: American Association of State Highway and Transportation Officials.
AASHTO. (2009). Manual for assessing safety hardware (MASH). Washington, D.C., U.S.A.: American Association of State Highway and Transportation Officials.
Anghileri, M. (2013). Current Status of EN 1317 and U.S.-Europe Test Result Mutual Recognition. In R. J. Troutbeck (Ed.), Roadside Safety Design and Devices International Workshop (pp. 22-27): Transportation Research Board.
Australian Transport Council. (2011). National Road Safety Strategy 2011-2020. Canberra, A.C.T., Australia.
Austroads. (2009). Guide to Road Design, Part 6: Roadside Design, Safety and Barriers. Sydney, New South Wales, Australia: Austroads.
Carrigan, C., Ray, M. H., & Johnson, T. O. (2014). Understanding Heavy Vehicle Encroachment Frequency. Paper presented at Transportation Research Board 93rd Annual Meeting, Washington, D.C., U.S.A.
Chowdhury, M. A., Warren, D. L., Bissell, H., & Taori, S. (1998). Are the criteria for setting advisory speeds on curves still relevant? ITE journal, 68, 32-45.
Doecke, S., & Woolley, J. E. (2011). Further investigation into the effective use of clear zones and barriers in a safe system’s context on rural roads. Paper presented at Australasian Road Safety Research, Policing and Education Conference, Perth, W.A., Australia.
European Committee for Standardization. (2010). EN 1317-2 Road Restraint Systems - Part 2: Performance Classes, Impact Test Acceptance Criteria and Test Methods for Safety Barriers including Vehicle Parapets. Brussels, Belgium: CEN.
Highways Agency UK. (2011). Guidance on the use of the Road Restraint Risk Assessment Process (RRRAP) associated with TD 19/06.
Hubbell, J. (2013). Can EN 1317 and NCHRP 350–MASH Be Used Interchangeably? In R. J. Troutbeck (Ed.), Roadside Safety Design and Devices International Workshop (pp. 22-27): Transportation Research Board.
Jehu, V. J., & Pearson, L. C. (1977). Impacts of European cars and a passenger coach against shaped concrete barriers. Crowthorne, UK: Transport and Road Research Laboratory.
La Torre, F., Erginbas, C., Thomson, R., Amato, G., Pengal, B., Saleh, P., Britton, C., & Redant, K. (2014). Development of a guideline for the selection of Vehicle Restraint Systems - identification of the key selection parameters. Paper presented at Transport Research Arena, Paris, France.
La Torre, F., Erginbas, C., Williams, G., Thomson, R., Hemmings, G., & Stefan, C. (2015). Guideline for the selection of the most appropriate Roadside Vehicle Restraint System: Conference of European Directors of Roads.
Levett, S. (2007). Retro-fitting incremental clearzone widths to existing rural roads. Paper presented at Australasian Road Safety Research Policing Education Conference, Melbourne, Australia.
Luk, J. (2006). Automatic vehicle classification by vehicle length. Sydney, New South Wales, Australia: Austroads.
Mak, K., & Bligh, R. (2002). Assessment of NCHRP Report 350 Test Conditions. Transportation Research Record: Journal of the Transportation Research Board, 1797(1), 38-43.
Mak, K. K., & Sicking, D. L. (2003). NCHRP Report 492 - Roadside Safety Analysis Program (RSAP) - Engineer's Manual. Washington, D.C., U.S.A.
Mak, K. K., Sicking, D. L., Albuquerque, F. D. B., & Coon, B. A. (2010) NCHRP Report 665: Identification of Vehicular Impact Conditions Associated with Serious Ran-off-Road Crashes. (pp. 77): Transportation Research Board.
Mak, K. K., Sicking, D. L., & Ross, H. E. (1986). Real-world impact conditions for run-off-the-road accidents (discussion and closure). Transportation Research Record, 1065, 45-55.
McLean, J. (2002). Review Of The Development Of U.S. Roadside Design Standards. Road and Transport Research, 11(2), 29-41.
McLean, J., Tziotis, M., & Gunatillake, T. (2002). Geometric design for trucks: When, where and how? Sydney, New South Wales, Australia: Austroads.
Montella, A. (2001). Selection of roadside safety barrier containment level according to European Union standards. Transportation Research Record, 1743(1), 104-110.
Naish, D. A., & Burbridge, A. (2015). Occupant severity prediction from simulation of small car impact with various concrete barrier profiles. International Journal of Crashworthiness, 20(5), 510-523.
Queensland Department of Transport and Main Roads. (2005). Road Planning and Design Manual. Brisbane, Queensland, Australia.
Queensland Department of Transport and Main Roads. (2013). Queensland Road Safety Action Plan 2013-15. Brisbane, Queensland, Australia.
Queensland Department of Transport and Main Roads. (2014). Road Planning and Design Manual 2nd Edition. Brisbane, Queensland, Australia.
Ray, M. H., Carrigan, C. E., Plaxico, C. A., Miaou, S.-P., & Johnson, T. O. (2012). NCHRP 22-27 Roadside Safety Analysis Program (RSAP) Update. Maine, U.S.A.: RoadSafe LLC.
Ray, M. H., RoadSafe, L., Carrigan, C. E., & Plaxico, C. A. (2013). Developing Selection Tables for Bridge Railing. Paper presented at Transportation Research Board 92nd Annual Meeting, Washington, D.C., U.S.A.
Ross, H. E., Sicking, D. L., Zimmer, R. A., & Michie, J. D. (1993). NCHRP Report 350: Recommended Procedures for the Safety Performance Evaluation of Highway Features. Washington, D.C.: Transportation Research Board / National Research Council.
Sicking, D., & Ross Jr, H. (1986). Benefit-cost analysis of roadside safety alternatives. Transportation Research Record (1065), 98-105.
Sicking, D. L., Lechtenberg, K. A., & Peterson, S. (2009). Guidelines for Guardrail Implementation NCHRP Report 638. Washington, D.C., U.S.A.
Standards Australia. (2009). AS/NZS ISO 31000:2009: Risk management – Principles and guidelines. Sydney, New South Wales, Australia; Wellington, New Zealand: Standards Australia; Standards New Zealand.
Standards Australia. (2015). AS/NZS 3845.1-2015 Road safety barrier systems. Strathfield, New South Wales, Australia; Wellington, New Zealand: Standards Australia; Standards New Zealand.
Stolle, C. S., & Sicking, D. L. (2013). Impact Conditions Associated with Cable Median Barrier Failures. Paper presented at Transportation Research Board 92nd Annual Meeting, Washington, D.C., U.S.A.
Stonex, K. A., & Skeels, P. C. (1963). Development Of Crash Research Techniques At The General Motors Proving Ground. Highway Research Record(4), 32-49.
Yang, M., & Zhang, H. (2013). In-Service Performance Evaluation of Freeway Barriers in Guangdong Province, China. Paper presented at 16th International Conference Road Safety on Four Continents, Beijing, China.