VTI meddelande
No. 775A » 1995
The influence of de-icing salt on vegetation, groundwater and soil along Highways E20 and 48 in Skaraborg County during 1994
1 VTI meddelande
No. 775A *- 1995
The influence of de-icing salt on vegetation,
groundwater and soil along Highways E20
and 48 in Skaraborg County during 1994
Lars Backman and Lennart Folkeson
SwedishNationalRoadand
ATransportResearchInstitute
Cover:LennartFolkeson
Publisher: Publication:
VTI Meddelande 775A
Published: Project code:
Swedish National Road and 1995 80068
A Transport Research Institute
S-581 95 Linkoping Sweden , Project:
Vegetation damage in Skaraborg County Printed in English 1996
Authors: Sponsor:
Lars Backman and Lennart Folkeson Swedish National Road Administration Goteborg
Title:
The influence of de-icing salt on vegetation, groundwater and soil along Highways E20 and 48 in Skaraborg County during 1994
Abstract (background, aims, methods, results):
The extensive damage to vegetation that occurred along the Highways E20 and 48 in Skaraborg County (SW Sweden) during 1994 can probably be attributed to three interacting factors: the large amount of de-icing salt applied during winter 1993/94, the lateness of the last salting and the hot, dry weather during the budding season. This conclusion is supported by the damage observations and the very high sodium and chloride concentrations in pine and spruce needles along the roads. In extreme cases, the sodium concentration was >1,000 ppm (dry wt.) in current-year needles and >5,000 ppm in needles from the previous year. The chloride concentration in needles from both years was >8,000 ppm. Brown needles from the previous year taken from a dying pine tree contained 1,7 % sodium and 2,0 % chloride. The concentrations decreased rapidly with increasing distance from the road. The needles had higher salt concentrations in branches turned towards the road than in branches in other directions. Needles from a tall pine tree and a tall spruce tree had higher salt concentrations in their lower branches than in their
upper branches.
'
The damage (affecting coniferous and deciduous trees as well as bushes) manifested itself as sparse
foliage, bare or dead branches and shoots, lack of budding and (in pines) redbrown needles from the
previous year. The damage decreased with increasing distance from the road. Exposure was of major
significance for the salt concentration and the extent of the damage. Extensive road salting during winter
1992/93 may have contributed to the vegetation damage in 1994.
The groundwater and soil (down to 165 cm) from an area along the E20 showed greatly increased
sodium and chloride concentrations, especially next to the road, compared with 1978, 1979 and 1988.
The concentrations decreased rapidly with increasing distance. The increased concentration can only be
explained by the heavy increase in road salting. In another area, the concentrations were lower, but still
on the high levels measured earlier. Both areas have unfavourable hydrogeological conditions, with
permeable surface soil layers, high groundwater level and poor rate of water renewal (flat terrain).
ISSN:
.
Language:
No. of pages:
0347-6030
English
45
Foreword
This work constitutes the final report from the project "Vegetation damage in Skaraborg County" (VTI Project No. 80068) and has been carried out by Lennart Folkeson (Project Leader) and Lars Backman of the VTI at the request of the Swedish National Road Administration (Region Goteborg) which has appointed Rolf Gustafsson at its Mariestad office as contact person.
The commussion was received on 7 June 1994. Preliminary reports were submitted on 20 June, 31 August and 30 September 1994.
The publication seminar was held at the VTI on 20 December 1994 and was led by Jarl Hammarqvist of the Swedish National Road Administration.
Warm thanks are expressed to Hakan Asp of the Department of Horticulture and Pia Barklund of the Department of Forest Mycology and Pathology at the Swedish University of Agricultural Sciences and Bengt Nihlgard of the Department of Ecology at the University of Lund for discussions of vegetation damage, to J. Hammarquist for discussions of vegetation damage and for manuscript revision at the publication seminar, to Siv Billberg, Maj-Lis Gernersson and Tommy Olsson for chemical analysis, to the Information Unit of the VTI for assistance with literature searches and to Anita Carlsson for editing.
The report has been translated into English by Tony Palm, Professional English AB.
Linkoping in March 1966
Lars Backman and Lennart Folkeson
Contents
Summary
1 Background
2 Winter salting and meteorological and hydrological conditions in the survey area
3 Field methods 3.1 Inspection
3.2 Needle sampling
3.3 Groundwater and soil sampling «4 Laboratory methods
4.1 Needles 4.2 Groundwater 4.3 Soil
5 Results
5.1 General damage situation in the area 5.2 Visible damage to coniferous trees
5.3 Visible damage to deciduous trees and bushes 5.4 Salt concentrations in needles
5.5 Salt concentrations in groundwater and soil 6 Discussion
6.1 Vegetation
6.2 Groundwater and soil 7 Conclusions
8 Action and research needs 9 References
VTI meddelande 775A
Page 11 12 14 14 14 16 18 18 18 18 19 19 19 20 20 29 37 37 41 42 43 44
The influence of de-icing salt on vegetation, groundwater and soil along Highways E20 and 48 in Skaraborg County during 1994
by Lars Backman and Lennart Folkeson
Swedish National Road and Transport Research Institute (VTI) S-581 95 LINKOPING Sweden
Summary
During spring 1994, extensive vegetation damage was observed along heavily used roads in southern Sweden, including those in Skaraborg County. The purpose of the investigation described here was to determine the cause of vegetation damage along Highways E20 and 48 through Skaraborg County by means of a damage survey and measurement of sodium and chloride concentrations in pine and spruce needles, groundwater and soil. At the same time, changes in salt concentration in groundwater and soil in two previously studied areas close to the E20 were documented.
A general inspection indicated that the damage occurred in most species of tree and bush, both in gardens and in natural vegetation on both sides of the road. The damage took the form of sparse foliage, bare or dead branches, twigs or shoots, lack of emerging shoots and (in pines) red-brown needles from the previous year.. The damage decreased rapidly with increasing distance from the road, especially in dense stands. Where there was insufficient protection from, for example, other trees, damage could be found on exposed trees up to 50 m from the road.
Trees close to the road had greatly increased sodium and chloride concentrations both in current-year needles and needles from the previous year. In extreme cases, sodium concentrations exceeded 1000 ppm (dry wt.) in currentyear needles and 5000 ppm in the previous year's needles. Chloride concentrations exceeded 8000 ppm in needles from both years. Brown pine needles from the previous year contained 1.7 % sodium and 2.0 % chloride. The international literature gives a level of 50-200 ppm for sodium and 500-800 ppm for chloride as normal concentrations in healthy needles.
In certain cases, the previous year's needles even showed increased concentra tions at a distance of 50 m compared with 100 m, both in a young pine plantation and in a mature mixed coniferous wood. At a distance of 100 m, the sodium concentration was generally down to the background level stated in the international literature.
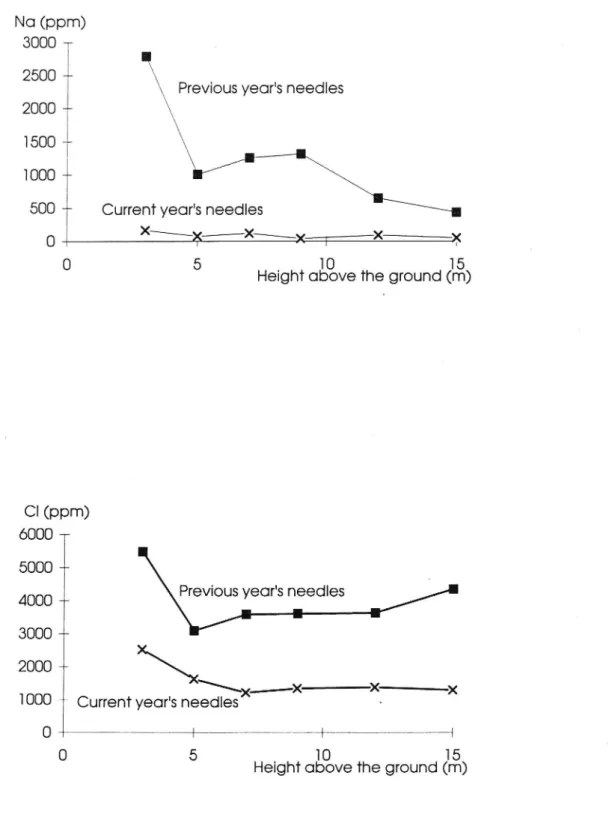
In a spruce tree and a pine tree next to the road, the sodium and chloride con-centrations were often higher in needles from the lower branches (4-8 m above the ground in the case of the pine and 3 m in the case of the spruce) compared to upper branches (16-19 m for the pine, 5-15 m for the spruce).
On branches oriented towards the road, the needles often showed many times higher concentrations of sodium and chloride compared with branches oriented away from the road. A dense spruce hedge had half the sodium and chloride concentrations in needles on its sheltered side compared to the side oriented towards the road, which showed major damage.
The previous year's needles often had many times higher sodium concentrations compared to current-year needles on the same branches. However, the chloride
concentrations were more similar between needles from the two years, although they tended to be higher in needles from the previous year.
The groundwater and soil (down to a maximum of 165 - >) from an area along the E20 showed increased sodium and chloride concentr: -s, especially next to the road, compared with 1978, 1979 and 1988. The conceutrations were highest next to the road and decreased with increasing distance from the road. In anc ier area along the E20, the concentrations were lower, but still on the relatively high levels measured in 1978, 1979 and 1988. From a pollution point of view, both areas had unfavourable hydrogeological conditions, with permeable surface soil layers, high groundwater levels and a very poor rate of water renewal (flat terrain).
The following conclusions were drawn from the investigation:
Relation to road/traffic: the extent of the vegetation damage clearly shows that this is related to the road (and its traffic).
De-icing salt: The very high concentrations of sodium and chloride in conifer
needles indicate that de-icing salt has played a decisive, or at least dominating,
part in causing the damage.
'
Direct foliar uptake/root uptake: Direct foliar uptake has probably played a
more important role than root uptake in the transport of salt to the needles. This is
supported by two observations: varying damage to branches with different
exposure to the road and varying salt concentration in needles with different
exposure and height above the ground.
Activating factors: The severity of the damage is probably due to three
interact-ing factors: the large quantity of salt applied durinteract-ing the 1993/94 saltinteract-ing season, the
lateness of the last salting and the hot, dry weather during budding.
Predisposing factors: The large quantity of salt applied also during winter
1992/93 has probably contributed to the damage that occurred in spring 1994. It is
possible that the unusual weather conditions in 1993 also had a certain influence.
Groundwater and soil: The groundwater and soil showed clearly increased salt
concentrations in the two areas along the E20. The large increase in concentration
in one of the areas during summer 1994 can only be explained by the heavy
increase in road salting.
1 Background
During early summer 1994, extensive damage to vegetation was observed along heavily used roads in large parts of southern and central Sweden, including clear signs of damage along Highway E20 in Skaraborg County. It was suspected even at an early stage that the damage was the result of road salting.
To investigate the cause, the Swedish National Road Administration estab-lished a programme involving experts in forestry, plant ecology, plant physiology, horticulture and hydrology. As part of this programme, the Swedish National Road Administration commussioned the VTI to carry out a damage survey in the field, together with a chemical analysis of conifer needles, groundwater and soil.
During the late 70s, the VTI had carried out a study of the environmental influ-ence of road salt based on seven observation areas in Skaraborg County where samples of soil, groundwater and vegetation were taken. The areas were followed up from spring 1978 to autumn 1979. The results showed increased salt concen-trations in several areas resulting from the use of road salt (Bickman 1980).
To study the long-term effects of winter road salting, the VTI performed further sampling in 1988 in three of the observation areas, but limited the samples to groundwater and soil. The results indicated that one area continued to be largely unaffected by salting, another showed a further increase in already high salt concentrations and the third had an unchanged high level of salt concentrations (Backman 1989).
The purpose of the present investigation is to contribute to identifying the causes of vegetation damage along Highways E20 and 48 in Skaraborg County using damage inspections and sodium and chloride analysis of conifer needles, groundwater and soil. In addition, changes in salt concentrations in groundwater and soil in two previously investigated areas along the E20 are documented.
2 Winter salting and meteorological and hydro-logical conditions in the survey area
In comparison with earlier years, road salt consumption by the Swedish National Road Administration was very high in winter 1992/93 and especially in winter 1993/94, both in Skaraborg County and in Sweden as a whole (Table 1). The last salt applications on the E20 took place relatively late: 14 March on the Vargarda-Vara section, 3 April on the Vargarda-Vara-Skara section, 25 March on the Skara-Gotene section and 3 April on the Gotene-Finnerodja section (Andersson, pers. comm.).
In the survey area (Figure 1), the E20 has an ADT of 8000-12,000, with a large proportion of heavy vehicles.
Table 1. Salt consumption (tonnes) by the Swedish National Road Administration. Data: Andersson (pers. comm.), Statistik iver saltforbrukningen 1991-1994 i Mariestadsdistriktet (1994), Statistik over saltforbrukningen pa E20 Skara-Gitene, Skara och Vara-Vargarda varen 1994 (1994).
Skarabc 7 All Sweden
Count,
Winter 1991/92 << 24,000 210,000
Winter 1992/93 26,000 330,000
Winter 1993/94 31,000 420,000
In the particular area, the period April-May 1994 was dry and precipitation 47-55% of normal. The temperature was unusually high for 4-5 weeks beginning on 22 April (Nederbords- och temperaturstatistik 1994). During April 1994, the groundwater level in the county was almost normal, unlike areas to the north and south where the groundwater level was higher than normal. In May, the ground-water level was lower than normal (Grundvattensituationen i april 1994 (1994), Grundvattensituationen 1 maj 1994 (1994)).
l | | |
Figure 1 Survey area.
3 Field methods 3.1 Inspection
The extent and character of the vegetation damage along Highway E20, Mariestad-Naum section, and Highway 48, Mariestad-Mullsj6 section, was inspected on 8 June 1994 by the authors under the guidance of Rolf Gustafsson and Sture Traneving of the Swedish National Road Administration in Mariestad (Hammarqvist 1994b).
A general survey had been made at the beginning of June 1994 by Swedish National Road Administration personnel from Mariestad (Hammarqvist 1994b).
The damage was discussed with Swedish National Road Administration personnel and the university experts listed in Chapter 9.
3.2 Needle sampling
Samples of current-year needles and the previous year's needles on Scots pine (Pinus sylvestris) and Norway spruce (Picea abies) twigs were collected on 8 June and 21 June 1994. This included sampling at two of the VTI's earlier sampling areas, R4 and R6 (see below). The samples were taken at different distances from the road, different heights above the ground and different orientations to the trunk.
The samples were taken at the sites listed below. The distance from the road is measured from the edge of the asphalt. Unless otherwise specified, samples were taken from twigs about 2-3 m above the ground. The height above the ground refers to the situation of the needles, not the point of branch insertion. Distance was measured by pacing out and height was judged by eye.
Site A: On the E20 in the village of Hova, the garden of a house at Roslunds vag 22. A well-cut spruce hedge about 2 m high, 1.5 m thick and 27 m long parallel to and about 6 m south-east of the road. Highly exposed. The ground is approximately level with the carriageway (separated by a ditch). On the side facing the road, the branches were completely dead up to about 1 m above the ground, but alive on the sloping top of the hedge. On the side facing the garden, the hedge was healthy and sprouting on both the top and the side. Samples were taken on 21 June 1994 from twigs on both sides of the hedge at about 1.5 m above the ground and about 12 m from the south-west end of the hedge. See Table 6.
Site B: On the E20 in the village of Hova, a plot of land at Roslunds vig 34 south-east of the road. A 3.5 m high spruce hedge at right angles to the road. The hedge begins at about 6 m and ends at about 58 m from the edge of the asphalt. Highly exposed towards the south-west. The ground is approximately level with the carriageway or slightly lower (intervening ditch). Nearest the road, the hedge had very sparse needles, which were almost all from the current year. At a distance of about 6 m to 40 m from the road, the hedge had a yellowish colour. Samples were taken on 21 June 1994 from twigs about 1.5-2 m above the ground on the south-west side of the hedge. See Figure 7.
Site C: On the E20 at Lyckan, 100 m north of the exit for Mariestad N. A 21 m high pine tree about 12 m west of the road. Mature, relatively dense mixed wood. Samples were taken on 21 June 1994 from branches (facing the road) at various heights above the ground; the ground where the tree stands is about 2 m below the level of the carriageway. The uppermost sample was taken about 1.5 m from the top of the tree. See Figure 5.
Site D: On the E20 at Lindesberg, 1.4 km south of the viaduct for the Mariestad N exit. Pine trees about 6 years old and 1.5 m high in a large pine plantation south-east of the road. Flat terrain level with the road. Samples were taken on 21 June 1994 from trees at various distances from the road: the pine standing about 98 m from the road is in an older and denser stand of pine and European birch (Betula verrucosa). The pine about 6 m from the road was severely damaged (brown needles) especially facing the road, but the top appeared healthy (green needles). Other trees showed no visible damage. See Figure 2.
Site E: On the E20 at Priastkvarn, 4.0 km south-west of the exit for Mariestad S. A 17 m high spruce tree about 8 m north-west of the road. Mature, relatively dense mixed wood. The ground where the spruce stands is 1 m below the level of the carriageway. The branch nearest the road extends to the wildlife fence. Samples were taken on 21 June 1994 from twigs (about 3 m above the ground), on branches (of the same whorl) facing different directions (see Table 5) and from branches (facing the road) at various heights above the ground (see Figure 6). The uppermost sample was taken about 2 m from the top of the tree. The branches where the uppermost two or three samples were taken had very coarse needles and
many cones. .
'
Site F (R4): On the E20 at Motorp, 3.5 km south-west of the exit for Lugnas.
North-west of the road: relatively dense mature spruce and pine wood. Nearest the
road, there is flat terrain, about 1 m below the level of the carriageway. Samples
were taken on 8 June (see Figure 4) and 21 June 1994 (see Figure 3) from 25-30 m
high spruce trees at various distances from the road. On the spruce tree about 6 m
from the road, the nearest branch reaches the wildlife fence. South-east of the
road: Relatively sparse mature spruce and pine wood. Samples were taken on
8 June 1994 on twigs about 3 m above the ground on a 30-40-year-old pine tree
about 9 m east of the road and on an 80-year-old spruce about 15 m
south-east of the road (see Table 3).
Site G: On the E20 at Fallet, 0.7 km north-east of the exit for Tisslatorp N. A
7 m high exposed pine tree about 9 m south-east of the road in a small, isolated
copse. The ground is on the same level as the road. Samples were taken on 21
June 1994 from branches about 3 m above the ground pointing towards and away
from the road. The needles had the same appearance on both sides of the tree. See
Table 5.
Site H:; On the E20 at Halvfaran, 100 m north-east of the crossroads. A 5 m
high bushy, exposed solitary pine tree about 6 m north-west of the road. Samples
were taken on 21 June 1994 from branches pointing towards andaway from the
road. The branches pointing away from the road had long, green needles from the
current year and previous year. Branches facing the road had long, coarse shoots
from the current year if they had any shoots at all. See Table 5.
'
SiteI: At an industrial site on the E20 at the Brinnebrona Cement company.
Two 10-year-old pine trees in an isolated, exposed row of pine trees about 7 m
north-west of the road. Samples were taken on 21 June 1994 from branches facing
towards and away from the road. The branches facing the road had brown needles
and lacked sufficient needles from the current year for sampling. See Table 5.
Site (R6): On the E20 at Boamarken, 3.5 km north-east of the exit for Gotene
N. Mature spruce and pine wood. Samples were taken on 8 June 1994 from a
healthy, mature spruce tree about 98 m south-east of the road and from three
small trees very close to the road. Spruce: about 9 years old, 0.5 m high, about 8 m
north-west of the road, severely damaged, top still alive but almost no needles from the »vious year on the branches. One pine: about 7 years old, 0.8 m high, about 8 __ of the road, dying, only lower portions alive. Second pine: about 7 y« uis old, 0.8 m high, about 9 m south-east of the road, dying (top dead). Needles from the current year taken from the first pine were green, and needles from the previous year taken from both pine trees were green/brown. See Table 2.
Site K: On Highway 48, at a lay-by at Tidavad (Mariestad-Skovde). A pine plantation between the road and the lay-by on the west side. Samples were taken on 8 June 1994 from two 3 m high pine trees about 8 m west of the road. One pine was dying (brown needles) and the other was alive (evident brown colour of needles on the side of the tree facing the road). Sampled twigs lacked shoots from the current year. Sampled needles from the previous year were completely brown on the dying pine and green/brown on the living pine. See Table 4.
The pine and spruce twigs were kept in plastic bags prior to further processing.
3.3 Groundwater and soil sampling
3.3.1 Area R4
'
Sampling of groundwater and soil was performed in two previously established
observation areas. Detailed descriptions of these areas are reported in Bickman
(1980) and the areas are therefore only briefly described below.
Area R4 (site F) is located on the E20 about 3.5 km south-west of Lugnas.
Here, the road is built on a low embankment and consequently there are no proper
ditches. The area is bordered to the east by a stream.
The clay in area F4 is covered by a comparatively thin (1.0-1.5 m) layer of
fine/medium sand. The groundwater level is mostly high, although during dry
periods it may fall below the level of the sand layer. The groundwater flows
slowly towards the north-east, i.e. parallel to the road. Since the road's
longitudi-nal profile also slopes towards the north-east, the area receives water from a
relatively long stretch of road immediately to the south-west.
During spring 1978, seven pipes were installed in the area for groundwater
sampling. The pipes were installed with the perforation 0.5-1.5 m below the
ground level, i.e. in the sand layer. In late autumn 1978, a further pipe was
installed east of the stream (pipe no. 8). Subsequently, one of the pipes nearest the
road (pipe no. 6) has been damaged and sampling is no longer possible.
Sampling of the groundwater was performed on 8 June 1994. The groundwater
-levels were then very low, and sampling was therefore possible in only three of the
seven pipes.
Soil sampling was performed on 7 July 1994. Samples were taken at two or
three levels down to 115 cm depth below ground level close to each groundwater
pipe. Sampling was performed with a spade drill 50 mm in diameter. It should be
noted that samples were taken only in the sand layer since it was likely that
ancient sea water could occur in the underlying clay.
3.3.2 Area R6
The area is located on the E20 about 5 km north-east of Gotene. It is level with
the road, from which it is separated only by a normal ditch.
Geologically, the area resembles area R4, with a relatively thin layer of
fine/medium sand overlying clay. Unlike area R4, however, the sand layer
permeable to water. During spring and autumn, the groundwater level is high, about 0.5 m below the ground surface. In dry periods during the summer, however, the groundwater level may fall below the level of the sand layer. Obser-vations of groundwater levels show that the groundwater flows in a westerly direction from the road.
During spring 1978, five groundwater pipes were installed in the area. The pipes have their perforations 0.5-1.5 m below ground level, i.e. in the lower part of the sand layer.
Samples of groundwater were taken on 8 June 1994. Because of the low groundwater levels, sampling was possible in only four of the five pipes.
Soil sampling was performed on 7 July 1994 when samples were taken from two to four levels down to 165 cm depth below ground level close to each groundwater pipe. Sampling was performed with a spade drill 50 mm in diameter. As in area R4, samples were taken only in the sand layer, since it was likely that ancient sea water could occur in the underlying clay.
4 Laboratory methods 4.1 Needles
Pine and spruce twigs were stored either in a freezer (after sampling on 8 June) or in a refrigerator (after sampling on 21 June). Twigs from the current year were separated from those from the previous year and were sent in plastic bags to the Department of Ecology at the University of Lund. No washing of the samples was performed. The twigs were dried in the opened plastic bags at 37+1 C to constant weight. For further processing, whole twigs were selected which in many cases _ were partly brown but mostly green, except in those cases where they are labelled
"dead" in the tables.
For sodium analysis, the samples (1 g dry wt.) were digested in 30 ml concen-trated HNO; (p.a.) for 4-7 days. After dilution in deionised (Milli-Q) water, the solutions were analysed for sodium using an emission spectrometer (inductively coupled plasma spectroscopy, ICP, Plasma II; Perkin-Elmer).
For chloride analysis, samples (1 g dry wt.) were placed in 75 ml deionised (Milli-Q) water under pressure (autoclave) for 30 min. After dilution in water, the solutions were analysed for chloride colorimetrically with FIA (Flow Injection Analysis; Tecator).
On 9 June 1994, samples from more or less damaged pine/spruce twigs from eight sampling sites were sent for closer ocular examination by experts in plant physiology and forest pathology at the Department of Horticulture and the Department of Forest Mycology and Pathology at the Swedish
Umvers y of
Agricultural Sciences.
4.2 Groundwater
The groundwater samples were sent for chemical analysis at the Department of
Ecology, University of Lund. After acid treatment with HNO; (to 0.1 %), sodium
analysis was performed with an atomic absorption spectrometer (flame emission:
Varian). Chloride was analysed (without pre-processing) using ion
chromatog-raphy.
4.3 Soil
The soil samples were sent for chemical analysis at the Department of Soil
Sciences at the Swedish University of Agricultural Sciences in Uppsala. After
extraction with ammonium acetate, sodium analysis was performed using an
atomic absorption spectrometer. After extraction in water, chloride analysis was
performed using potentiometric titration with silver nitrate.
5 Results
5.1 General damage situation in the area
A majority of the trees and bushes along the E20 in Skaraborg County showed clear signs of damage. On the Ek-Mulls;6 section of Highway 48, the same type of damage was observed but to a lesser extent, except in the case of pine trees.
The damage appeared on most species of tree and bush, both in gardens and in agricultural and forested areas. It took the form of bare or dead branches, twigs or shoots, lack of emerging shoots during the latest spring, red-brown needles from the previous year (pine), or generally sparse foliage. In general, the damage was by far the most pronounced in the immediate vicinity of the road. Trees and bushes nearest the road showed the most severe and apparent damage. There was no difference in vegetation damage on the two sides of the road. In the woods, the damage decreased rapidly with increasing distance from the road, in particular in dense stands. At sites with sparse stands or isolated trees or bushes, or where insufficient shelter by other trees was provided, the damage also appeared at greater distances from the road (at least 50 m). The damage was thus closely related to exposure to the road. Similarly, noise barriers provide good protection: often, the part of the tree exposed above the barrier showed clear signs of damage while the sheltered part of the tree was relatively undamaged.
5.2 Visible damage to coniferous trees
To the road user, the red-brown needles from the previous year on the
lower
branches of pine trees exposed to the road are the most striking sign of damage.
On small pine trees very close to the road, all the foliage was often red-brown,
sometimes with the exception of the top shoot. On somewhat less exposed pines
and also on older pines, damage usually occurred only on branches facing the
road. Similarly, the lower branches were often more damaged than the upper
branches, the top shoot being completely unaffected.
On exposed pine branches, the current-year shoots had often completely failed
to emerge, especially where the previous year's needles were red-brown.
However, it was not very unusual for shoot formation to have taken place also
from branches where the previous year's needles were completely red-brown and
where no older needles were present. Here, it should be added that in many cases
the pine nowadays has only 1-2 years' growth of living needles in southern and
western Sweden. The normal number should be 2-3. At the inspection on 8 June
1994, needles were elongating.
The damaged pine needles were generally completely red-brown along their
whole length. In those cases where the needles were not damaged, it was the basal
portion that was healthy (green). Discolouration had thus begun at the apex of the
needles and spread towards the base. The boundary between the necrotic and vital
portions of the needle was well-defined.
Remarkably enough, the spruce showed a different damage image. Close to the
road, small spruces and exposed branches of larger trees generally lacked needles
from previous years, but also these branches had to a large extent succeeded in
producing shoots in 1994. On fresh spruce shoots from the current year, the young
needles had a healthy bright-green colour at the inspection on 8 June 1994. The
current year's needles were still dense since the shoots were in the phase of cell
elongation. Because of the bright green current-year shoots, the spruces near the
road left a relatively healthy impression at a superficial inspection. It should be noted that the striking bright green colour of the growing needles distinguished the spruce from the pine, whose new shoots had a dark green colour from the beginning. Another factor that strongly influenced the difference in visual impression between the species in the observation area was that the red-brown needles from the previous year were still in place on the pine trees, while the spruce trees had already shed their dead needles.
Nowadays, spruces often have living needles only from the last 2-3 years. Normally, they should have needles from 5-8 years.
The juniper (Juniperus communis) also showed damage (red-brown needles), although this tree was not very common on the sections of road studied.
Foreign conifers such as cypress (Cupressus), arborvitae (Thuja) etc. had also been damaged. However, damage in gardens was not registered systematically.
5.3 Visible damage to deciduous trees and bushes
The damage to deciduous trees and bushes was very extensive in gardens and elsewhere along the roads studied. Most species of tree had been affected, such as alder, aspen, poplar, European beech, silver birch, downy birch, pedunculate oak, wild cherry, linden, Norway maple, mountain ash, Swedish whitebeam, goat willow and apple (Alnus spp., Populus tremula, P. spp., Fagus sylvatica, Betula pubescens, B. pendula, Quercus robur, Prunus avium, Tilia cordata, Acer plata-noides, Sorbus aucuparia, S. intermedia, Salix caprea, Malus domestica). On the contrary, a number of relatively undamaged specimens of horse chestnut and Japanese rose (Aesculus hippocastanum, Rosa rugosa) were noted.
On deciduous trees and bushes, the damage appeared mainly as sparse foliage, dried-up twigs and twigs that had produced no buds, and failure to flower (at least in the case of the lilac, Syringa vulgaris). In the birch, the transition from the dead distal portion of the twig and the living basal portion was diffuse: in the mountain ash, it was well-defined. On 21 June 1994, adventitious shoots were observed emerging from basal portions of twigs which had dried up in their distal portions. In a number of cases, signs of attack by aphids (green-fly) were observed in the birch and beech.
5.4 Salt concentrations in needles
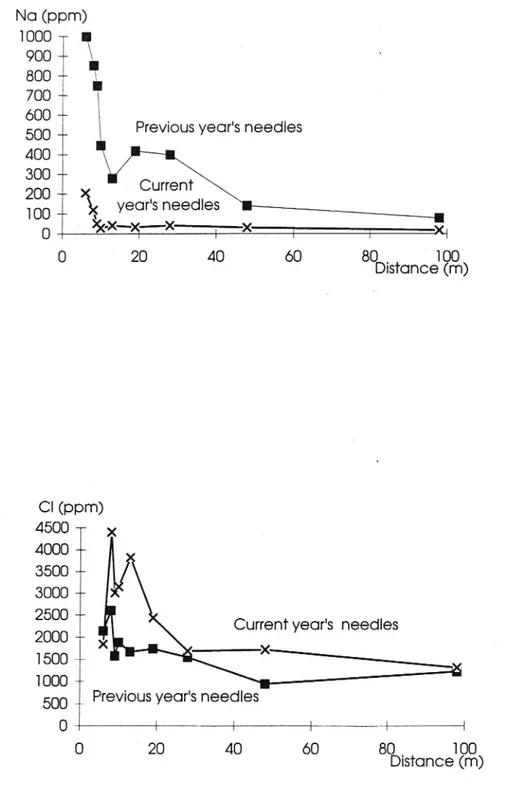
In every case, needles from the previous year had many times higher sodium concentrations than needles from the current year, both in high and low salt loading (Figures 2-7, Tables 2-6). The chloride concentrations were however more similar between the different year-growths of needles: often, the previous year's needles showed higher concentrations than the current year's needles, although seldom more than twice as high.
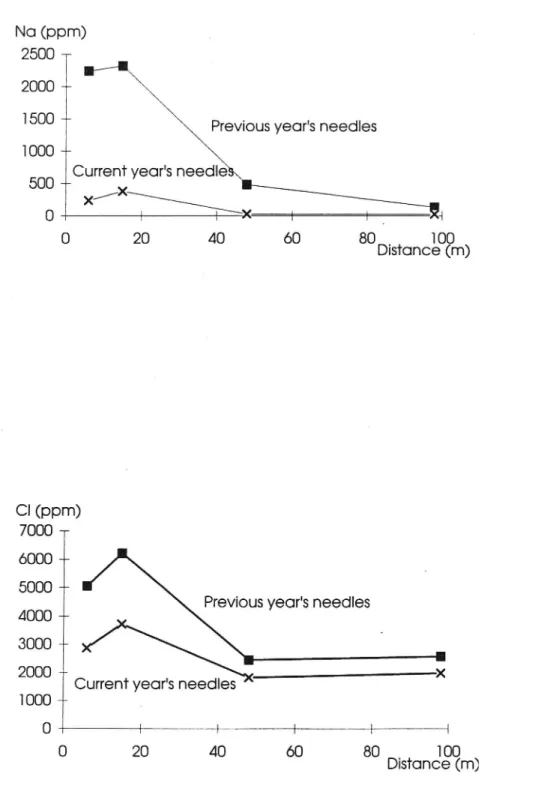
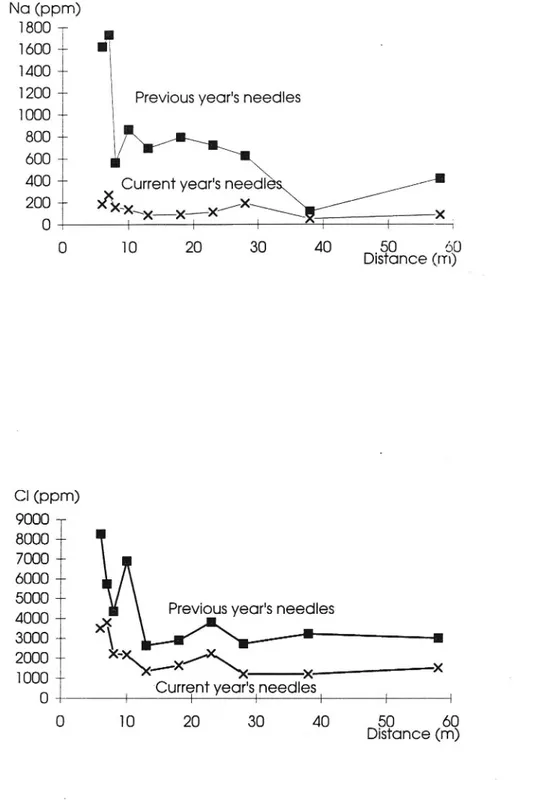
Samples taken close to the road showed heavily increased sodium and chloride concentrations both in needles from the current year and those from the previous year (Figures 2-4, Tables 2-5). In the case of sodium, needles from the previous year showed to a certain extent increased concentrations at distances of about 50 m compared with those at 98 m, both in a young pine plantation (Figure 2a) and in a mature, mixed coniferous wood (Figure 3a). At a distance of 98 m from the road, the sodium concentration can generally be said to have decreased to the background level stated in the international literature.
Na (ppm) 1000 -200 |
1
800
-700 <
600
500
-400 <
300
-200 {
100 <
0
0
x x
year's needles
*Previous year's needles
Current
>5<X-x--X
20
|f
40
xX,
,
100
Distance (m)
CI (ppm)
4500
4000
-3500 +
3000 +
2500 +
2000
1500
1000
-500 +
I
Current year's needles
Previous year's needles
tI
40
|t
20
Q .
100
Distance (m)
Figure 2.
Concentrations of sodium (2a) and chloride (2b) in needles from pine
trees at various
dzstances from Hzghway E20 at Site D (Lindesberg).
ppm = ug (g dry wt.).
Na (ppm)
2500
~-2000
--1500 -+ Previous year's needles 1000
+-Current year's needle 500 -+- y xy--
\
0
% ? X f ? Aq O 20 40 60 80 _. 100 Distance (m) CI (ppm) 7000 -6000 + 5000--Previous year's needles 4000
--3000 +
1
2000 + X
Current year's needles ** 1000 -+-
A
O
{
% } { |0 20 40 60 80 _. 100
Distance (m]
Figure 3. Concentrations of sodium (3a) and chloride (3b) in needles from spruce trees at various distances from Highway E2O at Site F (Motorp). North-west side of the road. ug (g dry wt. ).
Na (ppm) 3500 -3000 --2500
-+-2000 -+- Previous year's needles
1500
--1000 7+
Current year's needles 500 7+ has X_ 0 | | | | } --A 0 5 10 15 20 |I , 30 39 Distance (m) CI (ppm) 8000 T 7000 + 6000 + 5000 + 4000 -- e
3000 + Current year's needles 2000 +
1000 +
0 | | | |
%
|
|
0
5
10
15
20
25
Previous year's needles
A#,A
. 30
35
DISTQHCG (m)
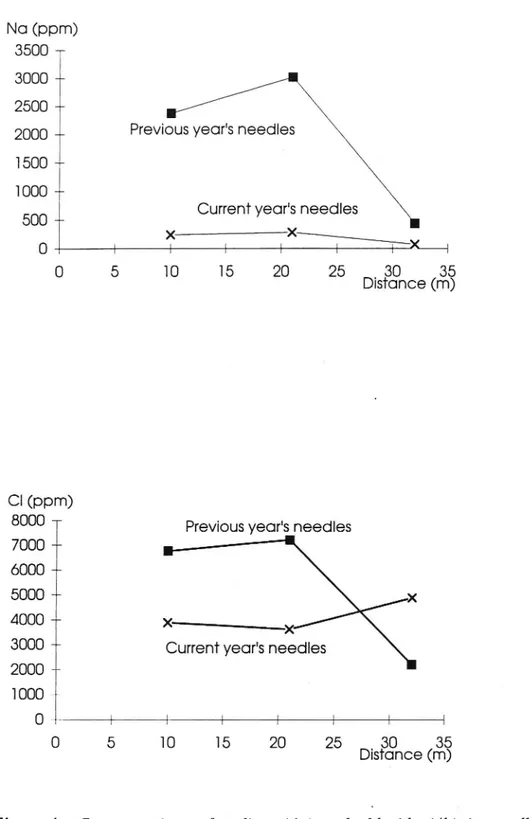
Figure 4. Concentrations of sodium (4a) and chloride (4b) in needles from spruce trees at various distances from Highway E2O at Site F (Motorp). North-west side of the road. ug (g dry wt. yp.
Na (ppm) 4000 3500 3000 2500 2000 1500 1000 500 -p - \ - -- £-0 O Previous year's needles
Current year's needles
10 15 20
Height above the ground (m)]
CI (ppm) 6000 ©5000 4000 3000 2000 -1000 +
Previous year's needles
X Current year's needles
| | | |
t T- 1 1
10 15 20
Height above the ground (m)
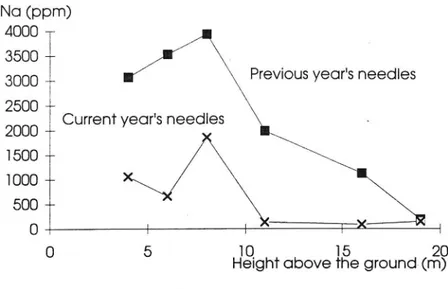
Figure 5. Concentrations of sodium (5a) and chloride (5b) in needles from branches at various heights in a pine tree about 12 m from Highway E20 at Site C (Lyckan). ug (g dry wt.).
Na (ppm) 3000 -2500
Previous year's needles 2000
1500 --1000 +
500 +- Current year's needles
0
X\I
Kmmmmygcre--K---%
0
o
10
15
Height above the ground (m)
CI (ppm)
6000 i
5000
-4000 -
Previous year's needles
/l
K3000
-2000 +
\
nny nne-X
1000 + Current year's needles
O
?
% | T I -% aPA O , 10 15Height above the ground (m)
Figure 6. Concentrations of sodium (6a) and chloride (6b) in needles from branches at various heights in a spruce tree about 8 m north-west of Highway E20 at Site E (Priistkvarn). ug (g dry wt.).
Na (ppm) 1800 --1600 - __ 1400
-1200 7 Previous year's needles 1000 -800 600 --400 -200 +-o, % | } ? t \ I { -X , 50 £0 Distance (m) CI (ppm) 2000 -8000 + 7000 + 6000 -+-5000 + 4000 --3000 +-2000 +
XHK\X?_4x,/4 \\§K
pmt
1008 I
|__
Current yeor'slneedlgsl
0
10
20
30
40
Distance (m)
50
60
{
Previous year's needles
Figure 7. Concentrations of sodium (7a) and chloride (7b) in needles from
spruce-hedge twigs collected at various distances from Highway E20
at Site B (Hova). ug (g dry wt.).
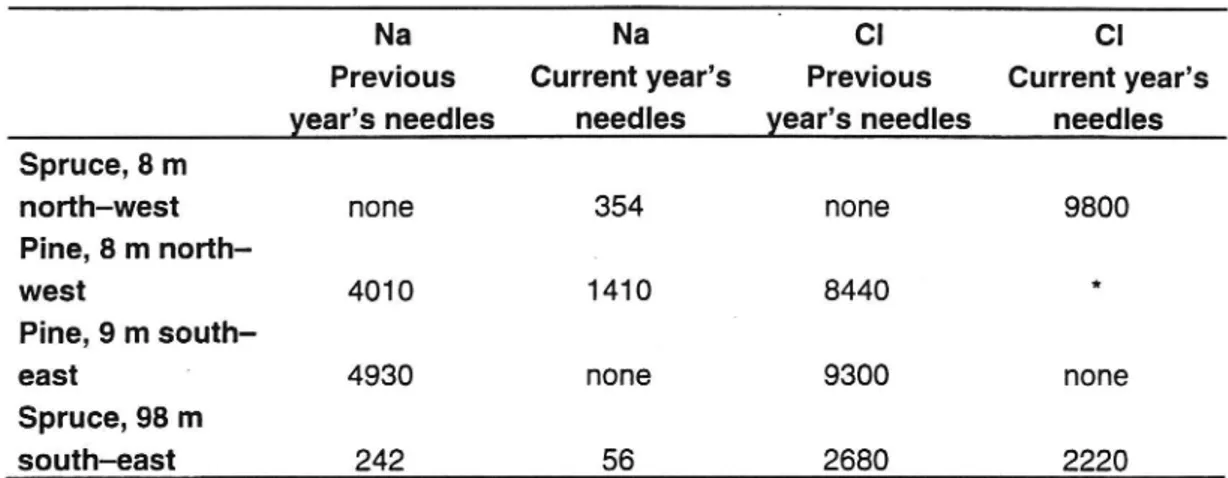
Table 2. Sodium and chloride concentrations in needles from four trees on the E20 at site J (Boamarken): three small damaged/dying trees close to the road (one approximately 9-year-old spruce tree 0.5 m high stand-ing about 8 m north-west of the road, one approximately 7-year-old pine tree 0.8 m high standing about 8 m north-west of the road and one approximately 7-year-old pine tree 0.8 m high standing about 9 m east of the road), and a mature spruce tree about 98 m south-east of the road.
*) Sample finished. ug (g dry wt.).
Na Na -_- Cl Cl
Previous Current year's Previous Current year's year's needles needles year's needles needles Spruce, 8 m
north-west none 354 none 9800
Pine, 8 m north- _
west 4010 1410 8440 *
Pine, 9 m south,
east ' 4930 none 9300 none
Spruce, 98 m
south-east 242 56 2680 2220
Table 3. Sodium and chloride concentrations in needles from a pine tree about 7 m south-east of the E20 and a spruce tree about 15 m south-east of the E20 at site F (Motorp). ug (g dry wt.).
Na Na Cl Cl
Previous Current Previous Current year's year's year's year's needles needles needles needles Pine, distance 7 m 3910 993 3770 5660 Spruce, distance 15 m 2110 252 3320 2600
Table 4. Sodium and chloride concentrations in needles from two pine trees about 8 m west of Highway 48 at site K (Tidavad). The dying pine has completely brown needles. ug (g dry wt. ).
Na Na CI of
Previous year's Current year's Previous year's Current year's needles needles needles needles
Dying pine 16800 none 20100 none
Living pine 1050 none 2560 none
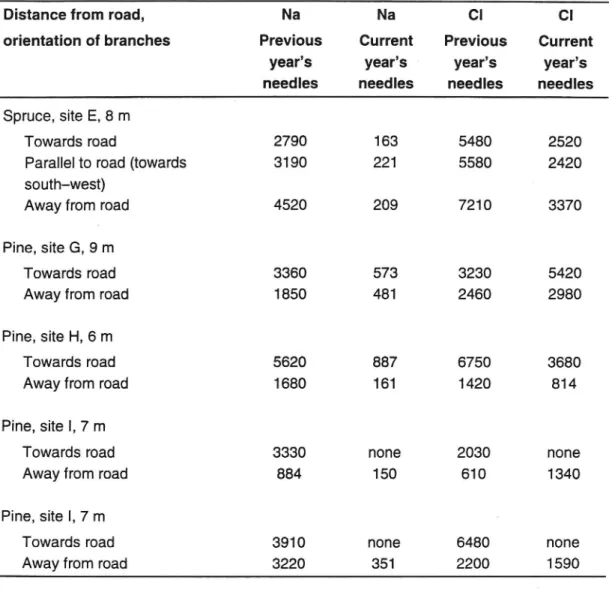
Table 5. Sodium and chloride concentrations in needles from branches (facing different directions) on five exposed trees: a spruce tree about 8 m north-west of the E20 at site E (Priistkvarn), a pine tree about 9 m south-east of the E20 at site G (Fallet), a pine tree about 6 m north-west of the E20 at site H (Halvfaran) and two pine trees about 7 m north-west of the E20 at site I (Briinnebrona Cement).
ug (g dry wt.)'.
Distance from road, Na Na Cl Cl
orientation of branches Previous Current Previous Current year's year's - year's year's needles needles needles needles Spruce, site E, 8 m
Towards road ' 2790 163 5480 2520
Parallel to road (towards 3190 221 5580 2420 south-west)
Away from road 4520 209 7210 3370
Pine, site G, 9 m
Towards road 3360 573 3230 5420
Away from road 1850 481 2460 2980
Pine, site H, 6 m
Towards road 5620 887 6750 3680
Away from road 1680 161 1420 814
Pine, site I, 7 m
Towards road 3330 none 2030 none
Away from road 884 150 610 1340
Pine, site I, 7 m
Towards road 3910 none 6480 none
Away from road 3220 351 2200 1590
Table 6. Sodium and chloride concentrations in needles from a spruce hedge on the E20 at site A (Hova). ug (g dry wt).
Na Na CI CI
Side of the Previous year's Current year's Previous year's Current year's
hedge needles needles needles needles
Facing road 744 62 4280 2200
The chloride concentration was greatly increased within about 10-30 m from the road, but the concentration was on the same level at a distance of 48 m as at 98 m (Figs. 2b and 3b). Even at 98 m, the chloride concentration showed a certain increase compared with normal concentrations according to the literature. However, it should be added that the studied area lies only 120-180 km from the sea and that salt can be transported long distances bythe wind.
In the long spruce hedge, both the sodium and chloride concentrations in the needles were highest next to the road and showed, with a certain variation, decreasing values with increasing distance (Fig. 7). The largest increase in the sodium concentration coincided with the extent of the yellowish colour of the needles observed during sampling. With few exceptions, the entire length of the hedge showed sodium concentrations at least twice as high as in a spruce tree 98 m from the road (Fig. 3a). On the contrary, the chloride concentration already at a distance of 28 m had fallen to the levels of around 2000-7000 ppm which were recorded in spruce needles in a wood 98 m from the road (Fig. 3b, Table 2).
The samples from various heights in the tall pine tree showed considerably higher sodium and chloride concentrations in the lower half of the tree than in the upper half (Fig. 5), with the exception of chloride in the current year's needles on the lowermost branch. The tall spruce tree showed a large increase in concentration of both sodium and chloride in the lowermost branch and a certain increase in sodium concentration in the previous year's needles up to a height of 9 m (Fig. 6). In needles from the branches nearest the tree top, the sodium and chloride concentrations decreased to values equivalent to those in branches close to the ground in trees 98 m from the road (Fig. 3, Table 2). An exception was noted in the case of the uppermost branch of the spruce (15 m), which had increased sodium and chloride concentrations in the previous year's needles.
With few exceptions, the needles on branches facing the road had many times higher concentrations of both sodium and chloride compared with branches facing away from the road (Table 5). A clear exception was the branch shown at the top of Table 5, in which the sodium and chloride concentrations were both somewhat higher in the branch facing away from the road compared with branches facing other directions. The fact that a dense spruce hedge along the road can offer effective protection is shown by the low sodium and chloride concentrations in needles on the lee side of the hedge compared with the high concentrations in needles on twigs facing the road, which showed extensive damage (Table 6).
In needles from extremely exposed trees, very high concentrations were recorded: for sodium sometimes over 1000 ppm in the current year's needles and 5000 ppm in the previous year's needles, and for chloride sometimes over 8000 ppm in both years' needles (Figs. 4, 5 and 7, Tables 2, 3 and 5). In brown previous year's needles of a dying pine, the sodium concentration was 1.7% and the chloride concentration 2% (Table 4).
5.5 Salt concentrations in groundwater and soil
5.5.1 Area R4
'
The sodium and chloride concentrations in groundwater samples taken in summer
1994 are shown in Table 7.
The sodium and chloride concentrations in all soil samples taken in area R4
from 1978 up to and including summer 1994 are shown in Tables 8-9.
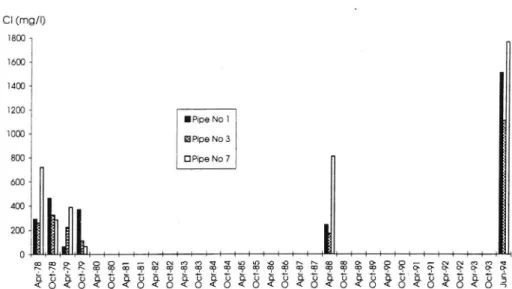
Compared with the earlier samplings, the sodium and chloride concentrations were greatly increased in 1994 both in the groundwater and soil samples (Figs. 8 and 9). The concentrations were increased at all sampling points, but the greatest increases were noted in those points nearest the road (points 2, 3 and 7). The concentrations also showed a very clear relationship to distance from the road.
5.5.2 Area RG
Sodium and chloride concentrations in groundwater samples taken during summer 1994 are shown in Table 7. Sodium and chloride concentrations in all soil samples taken in area R6 from 1978 up to and including summer 1994 are shown in Tables
10-11.
The sodium and chloride concentrations in area R6 in 1994 remained on the relatively high levels measured earlier (Fig. 10). However, the increase in concentrations was not at all as great as in area R4. It should also be noted that the concentrations at the two sampling points nearest the road were highest at a level 0.5 m below the ground surface.
Table 7. Sodium and chloride concentrations in
(groundwater samples in areas
R4 and R6 on 8 June 1994. »pm = mg L .
Area
Pipe no.
Distance
Nat
CV
from road
(ppm)
(ppm)
(m)
R4
1
21.9
1070
1510
3
6.0
808
1110
7
6.2
1240
1770
R6
1
4.5
\_
203
497
3
4.8
393
587
4
21.6
247
411
5
42.4
34
86
CI (mg/!) 1800 -1600 4 1400 7 1200 { WPipe No 1 1000 7 BPipe No 3 800 { O Pipe No 7 600 -400 7 200 | 0 --- --- --- --t----2 P R & § 8 5 a $ § $ 5 4 3 § 8 $ 8 b 5 § $ 8 $ P f a z § § ¢ P a 5 a 8 8 8 b 888 bE 88 R8 bE t B8 88 t 8 td 88 t$
Figure 8. Chloride concentrations in groundwater samples in area R4. Groundwater pipe 1: 21.9 m from edge ofpavement.
Groundwater pipe 3: 6.0 m from edge ofpavement. Groundwater pipe 7: 6.2 m from edge ofpavement.
Na (ppm) 200 7 800 700 -600 47 500 7 400 300 200
-mol lb
0 {
}
Jul
-78
Jul
-79
Jul
-80
Figure 9.
® Sampling point 3
B Sampling point 4
O Sampling point 5
Jul
-81
Jul
-82
Jul
-83
Jul
-84
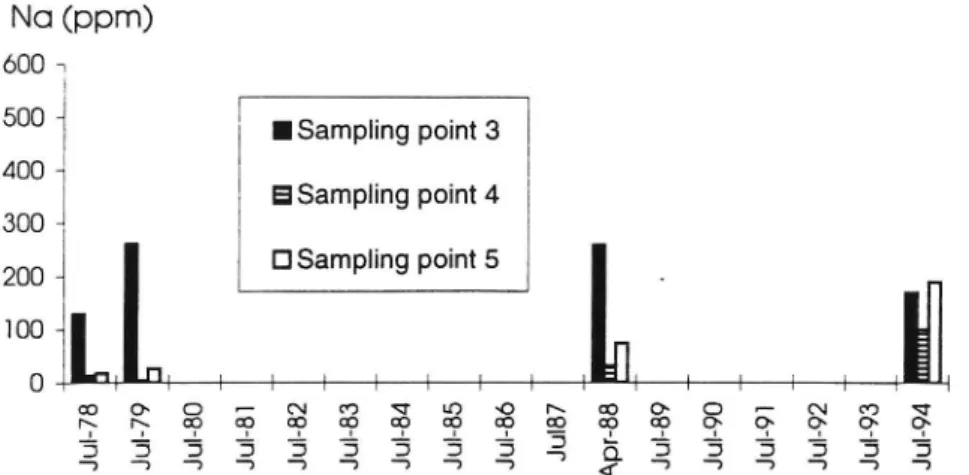
J U L8 5 J uk a J u L 8 7 -A-a < Ju k 8 9 J U L Q O J U F Q ]Sampling point 3: 6.0 m from edge ofpavement. Sampling point 4: 18.1 m from edge ofpavement. Sampling point 5: 29.0 m from edge ofpavement.
VTI meddelande 775A
Ju
l-92
Sodium concentrations in soil samples
from area R4.
Sampling depth 0-15 cm
Ju
l-93
Jul
-92
4
Jun
-94
-B -L.
31
Na (ppm) 600 500 400 300 -200 ~ 100 0 -© Sampling point 3 § Sampling point 4 O Sampling point 5 Ju l-79 Ju l-80 Ju l-82 Ju l-83 Ju l-84 Ju l-85 Ju l-86 Ju l-78 Ju l-81 Ju l8 7 Ap r-88 Ju l-89 Ju l-90 Ju l-91 Ju l-92 Ju l-93 _ Ju l-24
Figure 10. Sodium concentrations in soil samples from area R4. Sampling depth 0-15 cm.
Sampling point 3: 4.8 m from edge ofpavement. Sampling point 4: 21.6 m from edge ofpavement. Sampling point 5: 42.4 m from edge ofpavement.
Table 8. Sodium concentration in soil samples from area R4.
Sampling Distance Sampling Sodium concentration point from edge depth
of pavement
(m) (cm) (ppm)
Jul-78 Nov-78 Apr-79 Jul-79 _Oct-79 Apr-88 Jul-94
1 21.9 0-15 44 40 53 49 31 89 397 50-65 54 61 60 64 49 77 162 2 8.1 0-15 186 156 189 112 66 230 1140 50-65 67 23 76 68 56 128 193 100-115 68 42 83 61 58 115 133 3 6.0 0-15 80 88 96 139 89 141 865 50-65 44 55 68 67 52 68 147 4 __ 18.1 0-15 67 49 79 60 47 96 202 50-65 32 37 64 ~ 67 35 66 54 100-115 41 30 52 35 39 67 50 5 29.0 0-15 135 52 126 31 31 131 90 50-65 31 21 50 32 44 67 27 100-115 33 36 57 29 36 65 41 6 6.1 0-15 45 54 79 63 38 50-65 42 43 63 43 46 100-115 73 64 57 73 56 7 6.2 0-15 300 230 216 151 231 410 1010 50-65 153 98 167 110 89 310 383 100-115 77 123 98 41 137 203 8 41.9 0-15 35 32 3 17 29 50-65 42 13 21 15 21
Table 9. Chloride concentration in soil samples from area R4.
Sampling Distance Sampling Chloride concentration point from edge depth
of pavement
(m) (cm) (ppm)
Jul-78 Nov-78 Apr-79 _Jul-79 __Oct-79 Apr-88 Jul-94
1 21.9 0-15 11 44 29 36 20 43 576 50-65 75 84 48 62 72 47 248 2 8.1 0-15 176 137 108 45 13 231 920 50-65 70 23 81 56 20 147 240 100-115 61 66 42 62 46 141 184 3 6.0 0-15 51 24 29 39 46 83 946 50-65 51 61 45 59 46 25 226 4 0 4184 0-15 51 42 45 24 20 55 182 50-65 39 27 32 - 36 33 43 56
.
100-115
49
39
55
20
33
49
60
5
29.0
0-15
161
42
45
13
13
103
86
50-65
27
21
29
30
34
45
15
100-115
45
39
39
16
26
37
34
&
6.1
0-15
45
34
66
23
23
50-65
65
66
81
26
49
100-115
72
60
90
59
49
7
6.2
0-15
165
144
110
32
105
281
720
50-65
172
61
94
66
16
343
342
100-115
40
126
88
16 ___
165
322
8
41.9
0-15
10
10
3
16
50-65
3
3
3
14
Table 10. Sodium concentration in soil samples from area R6.
Sampling Distance Sampling Sodium concentration point from edge depth
of pavement
(m) (cm) (ppm)
Jul-78 _Nov-78 Apr-79 Jul-79 _Oct-79 Apr-88 Jul-94
1 4.5 0-15 181 220 186 327 570 160 177 50-65 360 160 223 382 410 220 196 100-115 81 74 99 102 69 145 78 2 24.8 0-15 29 16 112 29 16 81 84
"
50-65
27
24
58
34
23
56
39
100-115
67
20
80
49
173
3
4.8
0-15
129
153
192
261
266
260
170
50-65
147
41
129
280
98
230
190
100-115
54
53
91
80
143
48
66
150-165
108
41
74
49
58
118
4
21.6
0-15
13
9
33
4
6
32
101
50-65
11
11
62
32
27
74
59
100-115
33
x
47
44
29
50
49
5
42.4
0-15
18
4
49
27
26
74
191
50-65
8
12
31
12
17
41
34
Table 11 Chloride concentration in soil samples from area R6.
Sampling Distance Sampling Chloride concentration -point from edge depth
of pavement
(m) (om) | (ppm)
Jul-78 Nov-78 Apr-79 Jul-79 Oct-79 Apr-88 Jul-94
; 4.5 0-150 2480 287 100 352 707 113 102 50-65 469 160 252 468 £65 95 212
>
100-115
127
103
110
110
72
65
64
2
24.8
=--
0-150
43
13
29
7
10
39
96
50-65
21
34
13
10
10
34
36
100-115 _
8
40
19
7
37
3
4.8
0-15
19
47
81
168
174
159
56
50-650
16
19
324
98
85
520
100-1150
35
63
68
75
95
33
100
150-1650
92
63
45
39
26
220
4
21.6
0-is
6
18
3
10
7
26
88
50-65
16
36
o
30
23
103
os
100-115
35
63
10
36
20
31
78
5
- 42.4
0-15
10
21
16
7
7
29
180
50-65
6
27
o
7
___ 46
7
26
6. Discussion 6.1 Vegetation
6.1.1 Vegetation damage along roads
Damaged conifers along heavily used roads have long been a familiar sight. Nearest the road, the vegetation is generally exposed to severe conditions as a result of several interacting stress factors. These include:
e Exhaust emissions
Chemicals from vehicles (including tyres) and loads Abrasion products from the road pavement
Salt from winter road maintenance
Deviating local climate (precipitation, insolation, wind)
Deviating chemical and physical conditions in the soil (drainage, etc.)
In total, these unfavourable factors mean that vegetation along the road is exposed to an unfavourable environment. In many cases, this may lead to weakened general condition making the vegetation close to the road predisposed to damage from exhaust emissions, road salt and other pollutants, as well as attack by pathogens (fungi) of various types.
Road salt constitutes a prominent stress factor for vegetation close to the road. As a rule, salt damage is limited to the immediate vicinity of the road, since the salt concentrations in vegetation and soil decrease rapidly with increasing distance from the road (Reinirkens 1992). Salt transport from the carriageway to the surroundings takes place in the form of storm water runoff and spray from traffic. A certain outward transport of salt to the immediate vicinity of the road also occurs during snowclearing (Pedersen & Fostad 1994). However, salt may be transported over longer distances in the form of aerosols, especially in open countryside and areas exposed to strong winds. Transport of salt from dried road surfaces can also take place in the form of crystals which may be transported over distances of 100 m or more (Brod 1993).
In general, it is found that vegetation damage, like forest damage, is very difficult to explain clearly, both in individual cases and in larger regions (Persson 1985, Nihlgard 1992, Wijk et al. 1992, Barklund, pers. comm., Nihlgard, pers. comm.). Earlier, research has pointed relatively unambiguously towards the dominating role of air pollution. In recent years, the role of nutrition factors and climate factors in causing forest damage has been illuminated more clearly, especially in research performed in central Europe (Barklund, pers. comm.).
On thestudied section of the E20, damage to conifers was noted as far back as 1978 (Bickman et al. 1979, Backman 1980). In early summer 1994, evident damage was reported along heavily used roads in many places in southern and central Sweden (Hammarqvist 1994a). Damage was also reported from Norway involving both coniferous and deciduous trees (Skoglund 1994).
6.1.2 Damage situation for pine trees
The damage situation for the studied pine trees showed very clearly that the damage is of a physiological nature. The red-brown colour, often of the whole needle but initially at its tip, is typical of drying out as a result of salt (c.f. Hartmann et al. 1989). It is known that salt accumulation can produce rapid reactions in the form of needle discolouration and die-back.
No symptoms of insufficient nutrition were observed. Similarly, acidification, ozone and spring frost during spring 1994 can be excluded as direct causes of the rapid damage. On the c- vary, it is probable that the pollution load in combination with unfavourabie meteorological conditions causing frost drought or water stress during previous years may have weakened those trees that showed damage in 1994. It is known that during spring/early summer 1993, the spruce was exposed to severe frost drought on a large scale in southern Sweden, including Viastergotland. This led to shedding of weakened needles later in the same year. In many cases, the lack of p:vious year's needles observed during early summer 1994 may be attributed to frost drought during spring 1993 (or earlier; spring 1992 was also dry). (The term "frost drought" is used generally as a collective name for symptoms resembling drying which are caused either by frost or drought or a
combination of these). .
On collected twigs, fruiting bodies were observed in a few cases on both redbrown and green pine needles. However, there is nothing to indicate that attack by pathogens played a significant role in causing the particular damage.
6.1.3 Damage situation for spruce trees
The damage situation was typical of road salt also in the case of spruce (Hartmann et al. 1989). A lighter salt load is normally shown by red discolouration of the previous year's needles on a number of twigs, while the current year's needles usually have a normal green appearance. In higher salt loads, more extensive brown or copper red discolouration of the previous year's needles occurs between January and April, these needles being shed later in the year. Often, this is combined with dying buds. In repeated influence by salt, the shoots have only 1-2 years' growth of living needles (Brod 1993).
The above damage situation for spruce agrees well with that recorded in Skaraborg county. Probably, part of the damage situation can be explained by frost drought during spring 1993 (and previously), which led to weakening and in many cases shedding of needles as early as 1993. In addition, there are certain morphological and physiological species differences between spruce and pine. Compared with the spruce, pine needles have larger cells, which are also less compact than those of the spruce. Pine needles are also built up of fewer cell layers than spruce needles. The extent to which this influences sensitivity to road salt, for example, is unclear. It is also possible that the species difference may be partly due to initiation of the damage at a time when the buds, shoots and needles on the pine and spruce were in different stages of development (ageing) (Asp, pers. comm).
The fact that spruce trees standing close to a road and having heavily thinned crowns succeed to a large extent in producing buds from needle-less twigs offers no guarantee of survival of the current year's shoots throughout the growing season. The new needles are namely dependent on the older needles for their nutrition, at least at the beginning of the growing season. It may be added that the shedding of needles older than those of the current year probably has no connection with the rapid damage in 1994, but is most likely the result of influence in earlier years.
6.1.4 Sodium and chloride concentrations in needles
According to the literature, the sodium concentration in pine and spruce needles is normally between 50 and 200 ppm (ug per g dry wt.) and sometimes up to 1000 ppm (Brod 1993). This probably applies to needles from the previous year and before. In the samples of previous year's needles analysed here, sodium concentrations lower than 200 ppm were observed only in a spruce tree 98 m from the road, in the spruce hedge at a distance of 38 m from the road, in two pine trees 48 m and 98 m from the road, respectively, and in a pine branch 19 m above the ground. In the investigations carried out in 1978-79 along the particular section of the E20, the background concentration in the previous year's needles was about 60-80 ppm (Bickman 1980). The highest concentrations recorded in the present investigation, several thousand ppm, must be considered very high. Needles on small, dying trees had concentrations of over 4000 ppm and in completely brown pine needles 17,000 ppm was recorded. In the investigations carried out in 1978-79, it was found that trees with sodium concentrations over 5000 ppm in needles regularly showed damage in the form of dying needles and branches (Backman
1980).
In the case of salt damage, the chloride ion is considered more indicative than the sodium ion. The extent of visible vegetation damage is often stated to be closely related to the chloride concentration in the tissues (Dragsted 1980). Sometimes, a clear relationship between leaf damage and chloride concentration in the soil can be observed (Dragsted 1980). In the literature, needles (probably the previous year's needles and older needles) are stated normally to have chloride concentrations of 500-800 (-1300) ppm. Concentrations over about 2500-3500 are considered toxic. Other information indicates 4000-6000 ppm as a lower limit for the occurrence of damage. In one investigation, the needles on dying spruce trees proved to have chloride concentrations of 4500-10,000 ppm. An investigation of coniferous trees influenced by salt in highway storm water revealed chloride concentrations of 13,000-15,000 in damaged spruce trees, while undamaged spruce trees had concentrations below 1500 ppm. For current year's needles on spruce trees, a long-term investigation gives 3000 ppm as the lower limit for the occurrence of road salt damage. Older trees are stated to be somewhat more sensitive than younger trees. Similarly, the spruce is stated to be somewhat more sensitive to salt than the pine (literature quoted by Brod 1993). Norwegian investigations both in the field and the laboratory have shown that spruce and birch are more sensitive to salt than pine (Pedersen & Fostad 1994). The literature states that coniferous trees, which are evergreen, are generally more sensitive to salt damage than deciduous trees (Brod 1993).
6.1.5 Damage situation in deciduous trees
In regard to deciduous trees, the damage in the survey area proved to be of a remarkable and previously unknown extent. If the damage had been due only to direct accumulation of salt spray during the winter preceding the investigation, i.e. before the leaves appeared, either the salt accumulation on the swelling buds must have been heavy or the salt transport into the tissues must have been effective. However, the damage to deciduous trees that appeared in 1994 was, as in the conifers, probably the result of a combination of salt load and other stress factors over a series of years. The birch was probably weakened by drought stress following very hot, dry weather during spring/early summer both in 1993 and
particularly in 1992. Furthermore, the birch is recognised as a species sensitive to drying, but at the same time it can recover relatively quickly after damage. Field surveys along roads in south-east Norway have shown extensive salt damage to birch (Pedersen & Fostad 1994).
In regard to oak and alder, it is known that leaf development in general was poor in southern Sweden in 1994. The alder trees along the studied section of the E20 were severely damaged.
Insect attack (aphids) was observed on deciduoustrees, but probably played no
important part in the damage that occurred. In regard to insects and pathogens, the
reservation should however be made that the present investigation did not include
a field assessment by a pathologist.
6.1.6 Foliar uptake or root absorption
The sodium and chloride ions in the salt can reach the leaves or needles both by
foliar uptake and by root absorption. The fact that needle discolouration and lack
of shoot formation in the present study were clearly limited to the most exposed
branches and twigs indicates that transport took place mainly through direct spray
and aerosol deposition on the foliage, and that root absorption did not play a major
part, at least concerning the rapid damage. In root absorption, the damage would
not have been so clearly limited to the directly exposed branches and twigs. The
fact that salt damage primarily affects the parts of the vegetation exposed to the
road is known from the literature (Brod 1993).
'
Throughout the life of the needle, the protective surface layer, or cuticle, with
its wax coating, is exposed to abrasion, erosion, dissolution, mineral leaching and
other influence by air pollution, especially in exposed places such as a heavily
used road. When salt spray is deposited on a needle where the cuticle, owing to
cracks or other damage, has a reduced ability to exclude salt, the salt easily
pene-trates the needle, resulting in rapid desiccation. The physiological action of the salt
results in water being "drawn out" of the cells.
Even if the observed damage is probably more attributable to direct deposition
on the foliage than to root absorption, it cannot be excluded that unfavourable soil
conditions, such as salt stress and drought, during earlier periods may have
weakened the vegetation and made it predisposed to damage. Salt influence via
the roots during a long series of years may thus have contributed to a deterioration
of the tree's growth conditions. In the literature, salt damage is often discussed in
relation to influence via the roots, not least at sites where the soil as a result of
topography and texture conditions is directly influenced by road runoff (Brod
1993, Pedersen & Fostad 1994). Thus, a clay layer, for example, may constitute an
obstacle to the vertical transport of the water, so that salt water is trapped in the
root zone for a long time (Pedersen & Fostad 1994, Rohr 1994). A Norwegian
study stated special drainage conditions as the probable cause of damage to spruce
trees on marshy ground up to 60 m from the road (Pedersen & Fostad 1994).
It should be added that water and nutrition absorption by the roots is often
impeded by the unfavourable conditions in soil close to the road. Lengthy road
salting may lead to such high sodium concentrations in the soil that the soil
colloids are dispersed and the aggregates broken up. The deterioration of the soil
structure may lead to the soil being compressed, which disturbs water transport
through the soil. Similarly, the water may become less available for root
absorp-tion. In addition, the physiological effect of an increased salt concentration in the
soil solution impedes water absorption by the roots, resulting in drought stress (see also Folkeson 1994). (For further information on the physiological effects of salt, see Marschner 1990, Taiz & Zeiger 1991 and Brod 1993).
6.1.7 Road salting and weather
In addition to the quantity of salt applied, the timing and the weather conditions are stated to be among the most important factors controlling the occurrence of salt damage along roads (Brod 1993). It is likely that one of the main causes of vegetation damage can be found in the high salt application in the area during winter 1993/94 and that salting was carried out relatively late in the season. The hot, dry weather during the period of bud swelling, bud unfolding and shoot formation has probably contributed greatly to the occurrence of damage or at least aggravated it.
6.2 Groundwater and soil
A conclusion from the earlier investigations in the area (Bickman 1980) was that there is no clear and unambiguous relationship between the salt quantities spread on the road and the salt concentrations occurring in the surrounding natural environment. A certain quantity of salt may thus give rise to high concentrations in soil and groundwater in one area, while the same quantity of salt would lead to no observable salt increase in another area. Instead, it is the geological and hydro-logical conditions that determine the extent to which an area is affected by salt pollution.
From the pollution aspect, both the investigated sites on the E20 (R4 and R6) are considered to have unfavourable hydrogeological conditions with permeable surface soil layers, high groundwater levels and very poor water renewal rates (flat topography). This is also confirmed by the raised salt concentrations in soil and groundwater throughout the follow-up period (1978-1994).
It is difficult to determine with certainty what makes area R4 appear to be considerably more influenced than area R6 in 1994. A contributory cause is naturally the fact that R4 receives salt from a considerably longer section of road. The somewhat more permeable soil layers in area R6 may also contribute to the incoming quantities of salt being transported away more quickly. Another possible explanation is that there have been differences between the two areas in the salt quantities applied over the years.
It is worth noting that both R4 and R6 are located in a low-lying area which was covered by sea water after the latest deglaciation. The fine-grained sediments (principally clays) deposited in this salt water still contain considerable quantities of salt. As a result, the area has a relatively large number of salt-polluted wells (Knutsson & Morfeldt 1993). However, the salt concentrations in soil and groundwater reported here are not considered to be influenced by these conditions since sampling, both of groundwater and soil, has been performed only in the sand layers overlying the clay. Because of the permeability and the water renewal rate, it is unlikely that any ancient sea water salt remains in this layer.
Groundwater sampling with lysimeter technique would have been informative, but was outside the economic framework for the project.