1
Department of Mathematics and Physics
MASTER THESIS IN MATHEMATICS/
APPLIED MATHEMATICS
PRICING AN AMERICAN CALL ON DEVIDEND PAYING STOCK
by
PETER MALOSHA MAYUNGA
Magisterarbete i matematik/tillämpad matematik
Code: MDH.IMA.MAT.0092 (2007) 15 hp – AF
Department of Mathematics and Physics
Magisterarbete i matematik/tillämpad matematik
Date: 2007-11-21
Project name:
PRICING AN AMERICAN CALL ON DEVIDEND PAYING STOCKAuthor: Peter Malosha Mayunga
Supervisor: Associate Professor Anatoliy Malyarenko
Examiner: Professor Dmitrii Silvestrov
3
Abstract
The aim of this paper is to implement and create a Java applet that performs the simulation of
Fu and Hu model .The graphical result is presented on how investor can handle an American
call option with discrete dividends paying stock. The technical of stochastic approximation
algorithm is used to obtain the gradient, step size and observation length. The thesis is based
on Fu and Hu model (2005).
4
Acknowledgments
I would like to extend my deep-felt gratitude and appreciation to my supervisor Dr. Anatoliy
Malyarenko, who guided and advised me with kindness and fruitful discussion. His
willingness to help me expand my knowledge is deeply appreciated.
I also wish to thank all the Lecturers and Staff for their support during my study.
I owe thanks and appreciations to my friends and family for their support in coming with this
academic paper.
5
TABLE OF CONTENT
ABSTRACT... . 3
ACKNOWLDGMENTS... 4
TABLE OF CONTENT... 5
LIST OF THE IMPORTANT NOTATIONS... 6
1 INTRODUCTION...7
1.1 Statement of the Problem ...7
1.2 The Object of the study...7
1.3 Thesis structure...8
2. PRICING AN AMERICAN CALL ON DEVIDEND PAYING STOCK...9
3. HOW TO USE JAVA-APPLET.USER`S GUIDE...12
3.1 Input panel...12
3.2 Explanation of the Input Parameters...12
3.3 Calculate panel...13
3.4 Graphic panel...13
3.5 Output panel...14
3.6 Explanation of output Parameters ...14
3.7 Error massage...14
4 GRAPHICALLY RESULT...16
4.1 The Effect of changing Number of Iterations...17
4.2 The Effect of Changing Number of Simulations...18-20
4.3 The Effect of the Volatility...21-22
4.4 The Effect of Changing Interest Rate...23-24
4.5 The Effect of Changing the Number of Payment...25-26
5. ANALYSIS OF THE RESULT...27
6 CONCLUSIONS...28
REFERENCE...29
6
LIST OF INPORTANT NOTATIONS
Symbols and Notations are explained in this chapter so that any time they appear in any part
of this paper; it will help for easy identification of the symbols and their meaning.
SYMBOL EXPLANATION
t Current time
t
S
The stock price at time t
r The annualized continuously compounded riskless
Interest rate
σ
The annualized volatility of the underlying stock
K The tricking price of the American call option
T
The expiration date of the option contract
T
J
The net time 0 value of the option payoff
η
The number of dividends distributed during the
Lifetime of the call contract
0
t
0
η
t
t
t
1,
2,...,
The time moments of dividend payments
1 + η
t
T
1
1
,
≤
≤
η
+
τ
ii
t
i−
t
i−1η
≤
≤ j
D
j,
1
The amount of a cash dividend at time
t
jη
≤
≤
−j
S
jt
,
1
The stock price before the ex-dividend
η
≤
≤
+j
S
jt
,
1
The stock price after the ex-dividend
1
1
,
≤
j
≤
η
+
s
jThe option is exercised if
−j
t
S
>
s
j≥
K
,
s
η+1=
K
1{A} The indicator of the set A
t
Sˆ
The stock price at time t, excluding the present
Value of escrowed dividends
1 1
,...,
,
Z
Z
η+7
1.INTRODUCTION
1.1 STATEMENT OF THE PROBLEM
If you are responsible for taking decisions in your company dividend payment, probably you
would like to know how it will affect the value of your company. This issue goes directly to
the company, s investment financial decision. When the firm earns more profit they have two
alternatives, firstly, it either pays dividends or invest the profit for the expansion of the
company. The manager might choose any of the above alternatives depending on the financial
structure of the company that is, if the company is financed by the equity or by borrowing.
Dividends are more predictable than capital gain simply because it is possible to realize
dividend but stock price follows random process. Fama and Babiak conducted research into
dividend payment and discovered that if the company enjoys a good year, they increase their
dividends but the increment depends on if the earning is permanent, before the dividends are
fully adjusted. The company can shift their dividend policies provided that dividends are
taxed more heavily than capital gain.
There are several reasons why a company pays dividends. Firstly, dividends require the firm
to come up with hard cash, because the investor would favor firms which establish dividends
records and value information content of the dividends. But this is not easy for many
companies, some companies have tried to lie and report high profit but they end up with
bankruptcy because of the fact that dividends reduce firm value.
In reality dividends are always paid discretely, but the problem is how such discrete dividends
are to be handled?
1.2 OBJECTIVES AND SCOPE OF THE STUDY
The object of this study is to create a Java applet that performs the simulation of Fu and Hu
Model and to try to answer the equation above. This paper follows throughout FU and HU
model and considered an American call option on a dividend-paying stock at discrete time.
An American call option can be exercised at any time before the expiration date T, under the
assumption of no transaction cost which in this case the threshold exercise policy is adapted
to. Using equality through stochastic approximation algorithm the gradient estimate, step size
and selecting an observation length for each iteration is obtained.
In order to calculate the stock price at time t, the stock price follows the Black-Sholes
log-normal distribution. The applet provides clear graphical result of the development of
8
threshold (“decision”) levels for the call option. My java –applet may be used to see how
discrete dividend should be paid ,the investor can have a clear picture of what happens when
you change one of the parameters such as step size, the length, the stock price, interest rate
and so forth.
1.3 Thesis structure
The thesis comprises of pricing an American call option in chapter two, how to use the
Java-applet in chapter three, in chapter four the graphical result of my investigation is presented,
and the conclusion of my findings is presented on chapter five.
9
2. PRICING AN AMERICAN CALL ON DEVIDEND PAYING STOCK
Under the assumption of no transaction costs, the American option should be only exercise (at
an time) –if at all – right before an ex-dividend date or at the expiration date.
Thus we assume that the following threshold exercise policy is adopted: There is a stock price
K
s
j≥
associated with
t
jsuch that the option is exercised if
S
jj−
>
s
j.The net time 0 value of the option payoff,
J
T,can be calculated by the formula (6) which is
(
)
(
)
−
≥
∏
+
−
>
≤
∏
=
∑
= + = − − = − − − − − ) ( 1 ) ( 1 ) ( 1 1}
{
1
}
{
1
}
{
1
T i T j t T j t T r t i t i i j t rT Te
S
s
S
s
S
K
e
S
s
S
K
J
j i i i j η ηfrom FU
and Hu (2005.
If we define
s
η+1=
K
and change product of indicators by the indicator of the intersection the
formula simplifies to
.
)
}(
,
{
1
)
,...,
,
(
1 1 1 1 2 1 i i i j rt t i t j t i i j Ts
s
s
S
s
S
s
S
K
e
J
− + = − =−
>
≤
∩
=
∑
− − − η ηThe optimal exercise threshold level can then be defined as the point
(
s
1*,
s
*2,...,
s
*η)
at which
E
[
J
T(
s
1,
s
2,...,
s
η)
]
is maximised with respect to
s
1,
s
2,...,
s
η. The option value is equal to
E
J
T[
(
,
,...,
*)
2 * * 1s
s
ηs
].
If we put
[
(
,
,...,
)
]
)
,...,
,
(
s
1s
2s
E
J
s
1s
2s
ηg
n=
∇
Twhere ∇ denote the gradient with respect to
s
1,
s
2,...,
s
η.
The basic underlying assumption of
the stochastic approximation algorithm is that the problem of finding the optimal exercise
threshold level can be solved by finding the zero of the gradient, i.e. ., by finding such a point
)
,...,
,
(
* 2 * * 1s
s
ηs
that g
(
,
,...,
*)
2 * * 1s
s
ηs
= 0.
Let
(
,
,...,
0)
2 0 0 1s
s
ηs
be a starting point for the stochastic approximation algorithm. The
subsequent point has the following form:
),
ˆ
(
1 n j n n j n js
a
g
s
=
Π
Θ+
+n ≥ 0 , 1≤ j ≤
η
,
10
Where
gˆ
njis an estimate of
g
j(
s
1n,
s
n2,..,
s
ηn)
from n,
a
nis positive sequence of step sizes,
and
Π is a projection onto some set Θ , i.e. a point in Θ which is closed to
Θ nj n n j
a
g
s
+
ˆ
.
Like Fu and Hu (2005) in our case we put
s
0j=
K
,
Θ
=
[
K
,
5
K
]
,
and
a
0=
100
,
n
a
n=
100
for n
n ≥ 1.
To calculate the gradient estimate of
gˆ
njwhich denoted by
J
ˆ
T=
e
rTJ
Tso we substitute the
value of
θ
=
s
jto the following formula (8)
, ) ( ∂ ∂ − ∂ ∂ = ∂ ∂ − ∧ ∧ rT J J e J PA T rT PA T θ θ θ
From Fu and Hu (2005).
We obtain
( )
,
ˆ
∂
∂
−
∂
∂
=
∧ ∧ −rT
J
J
e
g
sj T PA Sj T rT nj
Which immediately simplifies to?
PA sj T rT n j
J
e
g
∂
∂
=
∧ −ˆ
.
In order to calculate the right hand side, we introduce the following notation:
* 1
;
ˆ
,
,,
,
1
−
=
− − −S
τ
r
σ
b
s
y
j j j T j jE
,
(
)
.
1 1 1 1 + − − − =
=
−
=
≤
Π
− + + − −s
S
s
e
E
S
K
S
J
j j j i t rt j t i t j i TIf we substitute to the value of
θ
=
s
jto the last display at p. 16 from Fu and Hu (2005) we
get
)},
(
)
(
)){
(
(
)
(
}
{
1
ˆ
1 1 * 1 * 1 1 1 1K
s
e
K
S
E
e
y
h
fi
y
h
s
S
g
i rt t rt i sj i k t i k i n j i i t i k∂
−
−
−
∂
∩
=
− − + − − − = = − + + −∑
η(1)
Where
fi
(
x
)
=
e
−x2/ 2π..Here we ignored the second and the third term of the above
mentioned display, because they are equal to zero.
11
j j j ij j i i t i i ib
s
s
y
h
r
S
b
s
y
h
iτ
σ
δ
τ
σ
σ
)
(
(
).
/
)
2
/
(
)
ˆ
/
)
(ln((
)
(
1 * 1 2 1 * 1 1 − − − −−
=
∂
∂
−
−
−
=
− −Substituting everything to equation (1) we obtain
)}.
(
)
(
{
)
(
))
(
(
}
{
ˆ
1 1 1 * 1 1 1K
s
e
K
S
E
e
b
s
y
h
f
s
S
g
rt t rt j j j j j k t j k n j j j j k−
−
−
−
≤
∩
=
− + − − − = = − + + −τ
σ
In our case we need to simulate the stock price
.
1
0
,
≤
≤
+
−j
η
S
j tIf we assume that the stock price follows the Black-Schoel log-normal distribution. Then
)
,
,
,
ˆ
;
(
ˆ
0t
r
σ
S
Z
h
S
t=
Where
h (Z;S,t,r
σ
) =
Se
(r−σ2/2)t+σ tZInitially we know the value of
00
S
S
t−=
we proceed as follow
1. calculate
∑
= − − − −=
η j i t t r j j iDie
b
1 ( 1)..
1
1
≤
j
≤
η
+
By using the value of
00
S
S
t−=
we calculate
− 0ˆ
tS
as
0. 0 0
ˆ
S
b
S
t−=
t−−
2 Loop with respect to j =1,2,...
η
.
ˆ
(
;
ˆ
,
,
,
),
1τ
r
σ
S
Z
h
S
t−j=
j tj−− jS
tS
ˆ
tb
j. j j=
+
− −Finally we calculate
ˆ
(
1;
ˆ
,
1,
).
1 η ητ
ησ
ηh
Z
S
r
S
t− + t− + +=
12
3. HOW TO USE JAVA-APPLET .USER`S GUIDE
This chapter describes how to use the Java-applet. For convenience to the user, the Java applet
is divided in to four parts.Input, Calculate button, Graphic panel, Output panel.
3.1 INPUT PANEL
figure
3.2 EXPLANATION OF INPUT PARAMETERS
I will give some explanation of each of the part.The first panel is Input panel and that gives an
opportunity for the user to enter the appropriate number in order to obtain the result.
Initial Stock price. The initial stock asset price at time zero
Number of Simulations. Here, the user may put any number of simulations which can be
simulated.
Strike Price. The striking price of the option contract
Number of payments. This is number of dividends payment
Interest rate. The riskless interest rate
Volatility. The distribution of underlying stock
Maturity. Expiration date of the option contract
13
3.3 CALCULATE PANEL
The user can perform the task by using this panel. Calculate panel has three buttons,
Calculate, reset, progress bar.
Reset button helps the no-experienced user to reset back after some modifications, while the
progress bar shows the percentage performing for the executed task.
Figure 2
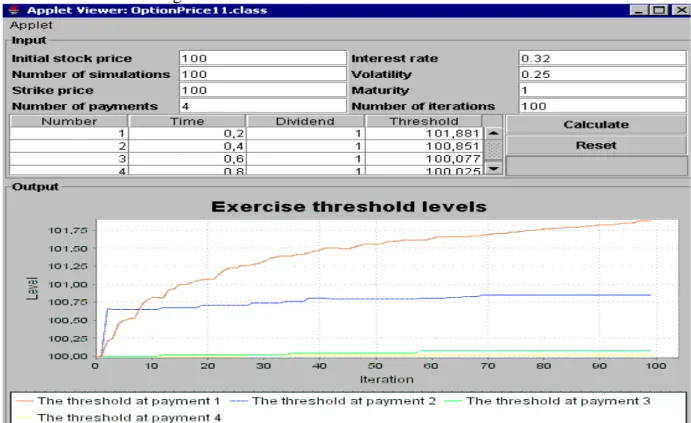
3.4 GRAPHIC PANEL
Figure 3 output graph in java-applet
The exercise threshold levels graph above has the level of threshold on the y-axis and the
number of iteration on the x-axis. The graph shows the theoretical level of the threshold
which is the level determined by the observed term structure movement at different payment
(from payment 1 to 4).
14
3.5 OUTPUT PANEL
Figure 4
All the output result will appear in the output panel. Output is deferent from the other panel
because all the fields are not accesible.It simply means the user can not change any value or
add something on this field. User can only obtain the result. The results appear together with
the graph after pressing button calculates on calculate panel
3.6 EXPLANATION OF OUTPUT PARAMETERS
Number. Number of dividends payment
Time.percentsge to be payed
Devidends.Number of dividends to be payed
Threshold. The amount to be payed
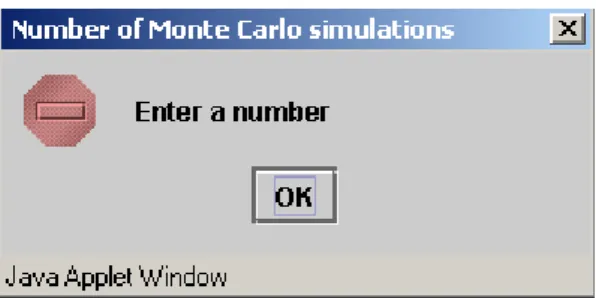
3.7 ERROR MESSAGE
Figure 5 Error message about wrong number format
Below is a picture massage that appears when the user try to enter the parameters that is not
numbers
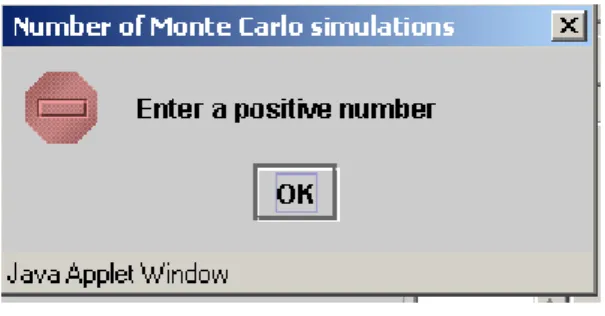
15
The massage below pops up when the user try to enter negative number”on positive”
Figure 6 Auxiliary tips help the user to type the right value to the field
I have added to each input field auxiliary tips and this shows up when the mouse points on
this field. The picture is bellow
16
4. GRAPHICAL RESULT
As I mentioned before dividends are always paid discretely, but the problem is how such a
discrete is to be handled. In this case it would be very interesting to change some of the
parameters such as number of simulation, the number of payment, interest and number of
iterations to see how the exercise threshold levels will be in graphic and in numeric result. I
will keep the other parameters constant whenever I change one of the parameter; this allows
us seeing the effect of each parameter.
The results of the applet option price when the default value are calculated is shown in the
below figure
17
When number of iteration is changed to1000
The option price when number of iterations is changed to10000
The result shows that the threshold level increase both cases when number of iterations is
changed to 1000 ,but when is change to 10000 only case 1and 2 increases but case 3 and 4
decreases.
18
Figure 4.2a Changing Number of Simulations
The option price applet when number of simulation is changed to 1000
Figure4.2b
19
When number of simulation is changed to 100000
Figure 4.2c
20
When the number of simulation is changed to 10
The result shows that when I increase the number of simulation the threshold level decreases
and when number of simulation is equal to 1000000, threshold became 100 for both cases, but
when we decrease number of simulation to 10, the threshold increase as shown in the above
graph.
21
Figure 4.3 when volatility is changed to .50
22
When volatility is changed to 5
When volatility is changed to 0.05
The result shows that when i increase the volatility the threshold decreases also when I
decrease the volatility threshold increase. That it is negative relation
23
Figure 4.4 the Effect of interest rate
When interest rate is changed to 0.07
24
When interest rate changed to 0.32
The result shows that when I increase the interest rate, the the threshold case 1 and 2,
increases but 3 and 4 decreases.
Figure 4. 5 Changing the Number of Payment
Finally, I will change the number of payment
25
When number of payment is changed to 1
26
When the number of payment changed to 4
27
5. ANALYSIS OF THE RESULT
The result shows that by changing any of the parameter, it gives a different result, that makes
it very difficult to take a decision whether to pay or not. Since all parameters are acting
differently. I would like to recognise some of the parameters to be in my decision policy in
paying out the dividend, because firms decision about how much cash to pay is normally
mixed up with other financial alternatives and investment decisions. Some firms pay little
whiles others pay more and that depends on the optimistic or pessimistic about the future.
Net present value is restricted to particular time period and to a certain cash flow. I will
initialise the threshold to be my net present value of the dividend, and the number of payment
limit to two as in figure 4, This allows the investor to choose the risk he or she desire, put
some limit whenever the threshold goes to zero as in figure 4.2c and when its- negative
dividends will not be paid at all.
The result indicates that some restrictions must be made with all other parameters remaining
fixed with only interest rate and volatility which will be unfixed to make a target decision and
for the fact that this parameter are controlled by other factors such as macroeconomics,
28
6. CONCLUSION
The FU and HU model is demonstrated by simulating the parameters such as Number of
payments, Number of iterations, Number of simulations, Strike price, interest rate and
provides clear graphical result of the development of threshold levels for the call option , in
such a way that the problem of how to handle discrete dividends paying stock is answered.
The probability outcome gives the Investor the choice to pay or not to pay dividend simply by
simulating the parameter either by increasing or decreasing it. The investor can see exactly
which is the best choice that is either to pay or not to pay the dividents.This java applet is
very important tool for the firm ,this approach has several advantages such as;
• It simplifies the price dynamics.
• It is easy to deal with dividend that are paid discretely
29
Reference
• Michael C FU and JIAN-Qiang HU (Sensitivity Analysis for Monte Carlo Simulation
of Option Price) June 2005.
• Michael C.FU (Optimization Via Simulation: A Review) April 1993 pp 21-22
• Ralf Korn and L.C.G Rogers (Stocks Paying discrete dividents: Modelling and Option
Pricing.
30
APPENDIX
/** *
* Copyright (c) 2007 Mälardalen University
* Högskoleplan Box 883, 721 23 Västerås, Sweden. * All Rights Reserved.
*
* The copyright to the computer program(s) herein * is the property of Mälardalen University.
* The program(s) may be used and/or copied only with * the written permission of Mälardalen University * or in accordance with the terms and conditions * stipulated in the agreement/contract under which * the program(s) have been supplied.
* @author Peter Malosha Mayunga * Mail:pma03002@student.mdh.se
* JAVA APPLET FOR PRICING AN AMERICAN CALL OPTION ON A DIVIDEND- PAYING STOCK */ import java.awt.*; import java.awt.event.*; import java.applet.*; import javax.swing.*; import javax.swing.border.*; import javax.swing.event.*; import javax.swing.table.*; import java.text.*; import java.util.*; import org.jfree.chart.*; import org.jfree.chart.axis.*; import org.jfree.chart.plot.*; import org.jfree.data.xy.*; import org.jfree.data.statistics.*;
public class OptionPrice11 extends JApplet
implements FocusListener, TableModelListener, ActionListener { // class variables // panels
private JPanel mainPanel = null; private JPanel inputPanel = null; private ChartPanel outputPanel = null; private JPanel dataPanel = null;
private JPanel generalPanel = null; private JPanel tablePanel = null; private JPanel buttonPanel = null;
// progress bar
private JProgressBar progressBar = null;
//Labels
private JLabel initialPriceLabel = null; private JLabel interestRateLabel = null; private JLabel simulationsLabel = null;
31
private JLabel volatilityLabel = null; private JLabel strickingPriceLabel = null; private JLabel expirationDateLabel = null; private JLabel numberofDividendsLabel = null; private JLabel numberofInteratialLabel = null; private JLabel calculateBLabel = null;
private JLabel resetLabel = null;
//Text fields
private JTextField initialStockpriceField = null; private JTextField interestRateField = null; private JTextField simulationsField = null;
private JTextField volatilityField = null; private JTextField strickingPriceField = null;
private JTextField expirationDateField = null; private JTextField numberofDividendsField = null;
private JTextField numberofInteratialField = null;
//Buttons
private JButton calculateButton = null; private JButton resetButton = null;
// String constants
private final String INPUT_LABEL = "Input"; private final String OUTPUT_LABEL = "Output";
private final String INITIALPRICE_LABEL = " Initial stock price"; private final String INTERESTRATE_LABEL = " Interest rate";
private final String DRIFTCOEFFICIENT_LABEL = " Number of simulations"; private final String VOLATILITY_LABEL = " Volatility";
private final String STRICKINGPRICE_LABEL = " Strike price";
private final String EXPIRATIONDATE_LABEL = " Maturity";
private final String NUMBEROFDEVIDENDS_LABEL = " Number of payments"; private final String NUMBEROFINTERATIAL_LABEL = " Number of iterations";
// Button texts
private final String CALCULATE = "Calculate";
private final String RESET = "Reset";
// column names
private final String COLUMN1 = "Number"; private final String COLUMN2 = "Time"; private final String COLUMN3 = "Dividend"; private final String COLUMN4 = "Threshold";
// tooltip texts
private final String INITIAL_TOOLTIP = "Initial stock price"; private final String INTEREST_TOOLTIP = "Interest rate"; private final String DRIFT_TOOLTIP = " Number of Monte Carlo
simulations";
private final String VOLATILITY_TOOLTIP = " Volatility"; private final String STRICKING_TOOLTIP = " Stricke price"; private final String EXIPIRATION_TOOLTIP = "Maturity";
private final String NUMBERDIVIDENDS_TOOLTIP = "Number of payments"; private final String NUMBEROFINTERATIAL_TOOLTIP = "Number of
iterations";
// Error messages
private final String NOT_A_NUMBER = " Enter a number";
private final String NON_POSITIVE = " Enter a positive number"; // Graph constants
32
private final String LEGEND = "The threshold at payment "; private final String GRAPH_TITLE = "Exercise threshold levels"; private final String X_LABEL = "Iteration";
private final String Y_LABEL = "Level";
// table models
private DividendTableModel model = null;
// tables
private JTable table = null;
// scroll panes
private JScrollPane pane = null;
// Numerical constants
private double INITIAL_STOCK_PRICE = 100; private double INTEREST_RATE = 0.05; private int SIMULATIONS = 100;
private double VOLATILITY2_VO = 0.25; private double STRICK_PRICE = 100; private double EXPIRATION_DATE = 1.0; private int NUMBER_OF_DIVIDENDS = 4; private int NUMBER_OF_ITERATIONS = 100; private double DIVIDEND = 1.0;
// numerical variablles
private double stockPrice = INITIAL_STOCK_PRICE; private double interest = INTEREST_RATE;
private int simulations = SIMULATIONS;
private double volatility1 = VOLATILITY2_VO; private double strick = STRICK_PRICE;
private double expiration = EXPIRATION_DATE ; private int dividends1 = NUMBER_OF_DIVIDENDS; private int iteration = NUMBER_OF_ITERATIONS; private double[] times = null;
private double[] sizes = null;
// Number formatters
private DecimalFormat myFormatter = null;
// Random number generator
Random generator = null;
// class methods
public void init() {
// Initialise formatter
DecimalFormatSymbols symbols = new DecimalFormatSymbols(); symbols.setDecimalSeparator('.');
myFormatter = new DecimalFormat("###.###",symbols);
// get content pane
Container contentPane = getContentPane();
// create main panel
mainPanel = new JPanel();
mainPanel.setLayout(new BorderLayout());
// add it to the content pane
contentPane.add(mainPanel); // create input panel
33
inputPanel.setBorder(new TitledBorder(INPUT_LABEL));
// add it to main panel
mainPanel.add(inputPanel,BorderLayout.NORTH);
// create output panel
outputPanel = new ChartPanel(null);
outputPanel.setBorder(new TitledBorder(OUTPUT_LABEL)); // add it to main panel
mainPanel.add(outputPanel, BorderLayout.CENTER);
// create data panel
dataPanel = new JPanel(new GridLayout(0,4));
// add data panel to input panel
inputPanel.add(dataPanel,BorderLayout.NORTH);
// create initialPrice label
initialPriceLabel = new JLabel(INITIALPRICE_LABEL);
// create interestRate label
interestRateLabel = new JLabel(INTERESTRATE_LABEL);
// create driftcoefficient label
simulationsLabel = new JLabel(DRIFTCOEFFICIENT_LABEL);
// create volatility label
volatilityLabel = new JLabel(VOLATILITY_LABEL);
// create strickingPrice label
strickingPriceLabel = new JLabel(STRICKINGPRICE_LABEL); // create expirationDate label
expirationDateLabel = new JLabel(EXPIRATIONDATE_LABEL);
// create numberofdevidends label
numberofDividendsLabel = new JLabel(NUMBEROFDEVIDENDS_LABEL);
// create numberofInteratial label
numberofInteratialLabel = new JLabel(NUMBEROFINTERATIAL_LABEL);
// create initialStockprice jtextField
initialStockpriceField = new JTextField();
initialStockpriceField.setText(myFormatter.format(INITIAL_STOCK_PRICE)); initialStockpriceField.setToolTipText(INITIAL_TOOLTIP);
initialStockpriceField.addFocusListener(this);
// create interestRate jtextField
interestRateField = new JTextField();
interestRateField.setText(myFormatter.format(INTEREST_RATE)); interestRateField.setToolTipText(INTEREST_TOOLTIP);
interestRateField.addFocusListener(this);
// create driftCoefficient jtextField
simulationsField = new JTextField();
simulationsField.setText(myFormatter.format(SIMULATIONS)); simulationsField.setToolTipText(DRIFT_TOOLTIP);
simulationsField.addFocusListener(this);
// create volatility jtextField
34
volatilityField.setText(myFormatter.format(VOLATILITY2_VO)); volatilityField.setToolTipText(VOLATILITY_TOOLTIP);
volatilityField.addFocusListener(this);
// create strickingPrice jtextField
strickingPriceField = new JTextField();
strickingPriceField.setText(myFormatter.format(STRICK_PRICE)); strickingPriceField.setToolTipText(STRICKING_TOOLTIP);
strickingPriceField.addFocusListener(this);
// create expirationDate jtextField
expirationDateField = new JTextField();
expirationDateField.setText(myFormatter.format(EXPIRATION_DATE)); expirationDateField.setToolTipText(EXIPIRATION_TOOLTIP);
expirationDateField.addFocusListener(this);
// create numberofDividends jtextField
numberofDividendsField = new JTextField(); numberofDividendsField.setText(myFormatter.format(NUMBER_OF_DIVIDENDS)); numberofDividendsField.setToolTipText(NUMBERDIVIDENDS_TOOLTIP); numberofDividendsField.addFocusListener(this); // create jtextField
numberofInteratialField = new JTextField();
numberofInteratialField.setText(myFormatter.format(NUMBER_OF_ITERATIONS)); numberofInteratialField.setToolTipText(NUMBEROFINTERATIAL_TOOLTIP); numberofInteratialField.addFocusListener(this);
// add initialPrice to the data panel
dataPanel.add(initialPriceLabel); dataPanel.add(initialStockpriceField);
// add interestRate to the data panel
dataPanel.add(interestRateLabel); dataPanel.add(interestRateField);
// add driftcoefficient to the data panel
dataPanel.add(simulationsLabel); dataPanel.add(simulationsField); // add volatility to the data panel
dataPanel.add(volatilityLabel); dataPanel.add(volatilityField);
// add strickingPrice to the data panel
dataPanel.add(strickingPriceLabel); dataPanel.add(strickingPriceField);
// add expirationDate to the data panel
dataPanel.add(expirationDateLabel); dataPanel.add(expirationDateField);
// add numberofdevidends to the data panel
dataPanel.add(numberofDividendsLabel); dataPanel.add(numberofDividendsField);
// add numberofInteratial to the data panel
dataPanel.add(numberofInteratialLabel); dataPanel.add(numberofInteratialField);
35
// create table panel
tablePanel = new JPanel(new BorderLayout()); // add it to input panel
inputPanel.add(tablePanel,BorderLayout.SOUTH);
// create table model
model = new DividendTableModel(); // add columns
model.addColumn(COLUMN1); model.addColumn(COLUMN2); model.addColumn(COLUMN3); model.addColumn(COLUMN4); // create call table
table = new JTable(model); // put it into the scroll pane
pane = new JScrollPane(table);
table.setPreferredScrollableViewportSize(new Dimension(250,50)); // add it to table panel
tablePanel.add(pane, BorderLayout.CENTER);
// create button panel
buttonPanel = new JPanel(new GridLayout(0,1)); // add it to table panel
tablePanel.add(buttonPanel, BorderLayout.EAST); calculateButton = new JButton(CALCULATE);
calculateButton.addActionListener(this); buttonPanel.add(calculateButton);
resetButton = new JButton(RESET); resetButton.addActionListener(this); buttonPanel.add(resetButton);
// create progress bar
progressBar = new JProgressBar(); progressBar.setStringPainted(true);
progressBar.setValue(0);
progressBar.setIndeterminate(true); // add it to progress panel
buttonPanel.add(progressBar);
addLines();
// add table model listener
model.addTableModelListener(this);
// initialise random number generator
generator = new Random(); }
// Reads double numbers
private double readNumber(JTextField field, double oldValue, String title) {
boolean isOK = true; double newValue = 1; try { // test input
newValue = Double.parseDouble(field.getText()); }
catch (NumberFormatException e) { // ERROR message
JOptionPane.showMessageDialog(null,
36
title,
JOptionPane.ERROR_MESSAGE); isOK = false;
}
if (newValue < 0) { // ERROR message
JOptionPane.showMessageDialog(null, NON_POSITIVE, title, JOptionPane.ERROR_MESSAGE); isOK = false; } if (isOK) { return newValue; } else { field.setText(myFormatter.format(oldValue)); return oldValue; } }
// Reads positive integer numbers
private int readIntNumber(JTextField field, int oldValue, String title) {
boolean isOK = true; int newValue = 1; try { // test input
newValue = Integer.parseInt(field.getText()); }
catch (NumberFormatException e) { // ERROR message
JOptionPane.showMessageDialog(null, NOT_A_NUMBER, title, JOptionPane.ERROR_MESSAGE); isOK = false; }
if (newValue <= 0) { // ERROR message
JOptionPane.showMessageDialog(null, NON_POSITIVE, title, JOptionPane.ERROR_MESSAGE); isOK = false; } if (isOK) { return newValue; } else { field.setText(Integer.toString(oldValue)); return oldValue; } }
public void focusGained(FocusEvent e) { }
public void focusLost(FocusEvent e) { Object source = e.getSource();
// if initial stock price
if (source == initialStockpriceField) {
stockPrice = readNumber(initialStockpriceField, stockPrice,
37
initialStockpriceField.getToolTipText()); return; } // if interest rate if (source ==interestRateField) { interest = readNumber(interestRateField, interest, interestRateField.getToolTipText()); return; } if (source == simulationsField) { simulations = readIntNumber(simulationsField, simulations, simulationsField.getToolTipText()); return; } if (source == volatilityField) { volatility1 = readNumber(volatilityField, volatility1, volatilityField.getToolTipText()); return; } if (source == strickingPriceField) { strick = readNumber(strickingPriceField, strick, strickingPriceField.getToolTipText()); return; } if (source == expirationDateField) { double oldValue = expiration;expiration = readNumber(expirationDateField, expiration,
expirationDateField.getToolTipText());
// change table
if (expiration != oldValue) {
// delete old rows
model.removeTableModelListener(this); for (int i=dividends1-1; i>=0; i--) {
model.removeRow(i); }
// add new rows
addLines(); model.addTableModelListener(this); } return; } if (source == numberofDividendsField) { int oldValue = dividends1;
dividends1 = readIntNumber(numberofDividendsField, dividends1,
38
// change table
if (dividends1 != oldValue) {
// delete old rows
model.removeTableModelListener(this); for (int i=oldValue-1; i>=0; i--) {
model.removeRow(i); }
// add new rows
addLines(); model.addTableModelListener(this); } return; } if (source == numberofInteratialField) { iteration = readIntNumber(numberofInteratialField, iteration, numberofInteratialField.getToolTipText()); return; } }
private void addLines() {
// delete old times and sizes
times = sizes = null;
// create new times and sizes
times = new double[dividends1+2]; sizes = new double[dividends1+2]; times[0] = 0.0;
sizes[0] = 0.0;
// add lines to the table
for (int i=1; i<dividends1+1; i++) {
times[i] = expiration*(i)/(dividends1+1); sizes[i] = DIVIDEND;
Object[] row = {new Integer(i), new Double(times[i]), new Double(sizes[i]), new Double(0.0)}; model.addRow(row); } times[dividends1+1] = expiration; sizes[dividends1+1] = 0.0; }
public void tableChanged(TableModelEvent e) { int row = e.getFirstRow();
int column = e.getColumn();
Object data = model.getValueAt(row, column); double newValue = ((Double)data).doubleValue(); if (newValue < 0) { // ERROR message
JOptionPane.showMessageDialog(null, NON_POSITIVE, "Call table", JOptionPane.ERROR_MESSAGE); if (column == 1) { model.setValueAt(new Double(times[row]),row,column); } else { model.setValueAt(new Double(sizes[row]),row,column); } return;
39
} else { if (column == 1) { times[row] = newValue; System.out.println(newValue); } else { sizes[row] = newValue; } } }public void actionPerformed(ActionEvent e) { Object source = e.getSource();
// if reset button if (source == resetButton) { stockPrice = INITIAL_STOCK_PRICE; interest = INTEREST_RATE; simulations = SIMULATIONS; volatility1 = VOLATILITY2_VO; strick = STRICK_PRICE; expiration = EXPIRATION_DATE ; dividends1 = NUMBER_OF_DIVIDENDS; iteration = NUMBER_OF_ITERATIONS; model.removeTableModelListener(this); addLines(); model.addTableModelListener(this); initialStockpriceField.setText(myFormatter.format(INITIAL_STOCK_PRICE)); interestRateField.setText(myFormatter.format(INTEREST_RATE)); simulationsField.setText(myFormatter.format(SIMULATIONS)); volatilityField.setText(myFormatter.format(VOLATILITY2_VO)); strickingPriceField.setText(myFormatter.format(STRICK_PRICE)); expirationDateField.setText(myFormatter.format(EXPIRATION_DATE)); numberofDividendsField.setText(myFormatter.format(NUMBER_OF_DIVIDENDS)); numberofInteratialField.setText(myFormatter.format(NUMBER_OF_ITERATIONS)); return; } // if calculate button if (source == calculateButton) { // calculate tau
double[] tau = new double[dividends1+1]; for (int i=1; i<=dividends1+1; i++) {
tau[i-1] = times[i]-times[i-1]; }
// introduce b
double[] b = new double[dividends1+1]; for (int j=1; j<=dividends1+1; j++) {
b[j-1] = 0.0;
for (int i=j; i<=dividends1; i++) {
b[j-1] += sizes[i]*Math.exp(-interest*(times[i]-times[j-1]));
} }
// introduce resulting array
double[][] results = new double[dividends1+1][iteration];
// choose starting point
for (int i=1; i<=dividends1+1; i++) { results[i-1][0] = strick;
40
}
for (int n=1; n<iteration; n++) { results[dividends1][n] = strick; }
double[] currentPrice = new double[dividends1+2]; currentPrice[0] = stockPrice;
double[] g = new double[dividends1];
double[] tildeS = new double[dividends1+2]; // Prepare progress bar
progressBar.setMaximum(iteration); progressBar.setValue(0);
progressBar.setIndeterminate(false);
// stochastic approximation loop
for (int n=1; n<iteration; n++) { progressBar.setValue(n+1);
progressBar.paint(progressBar.getGraphics());
double a = 100.0/n;
for (int i=1; i<=simulations; i++) {
for (int j=1; j<=dividends1; j++) { g[j-1] = 0.0;
}
tildeS[0] = stockPrice - b[0];
// Simulate pricing process
for (int j=1; j<=dividends1;j++) {
tildeS[j] = h(generator.nextGaussian(), tildeS[j-1], tau[j-1], interest, volatility1); currentPrice[j] = tildeS[j] + b[j]; } currentPrice[dividends1+1] = h(generator.nextGaussian(), tildeS[dividends1], tau[dividends1], interest, volatility1); tildeS[dividends1+1] = currentPrice[dividends1+1]; estimate:
for (int j=1; j<=dividends1; j++) { double result = 0.0; for (int k=1; k<=j-1;k++) { if (currentPrice[k]>results[k-1][n-1]) { break estimate; } } result = Math.max(currentPrice[j+1]-strick,0); result *= Math.exp(-interest*times[j+1]); result -= Math.exp(-interest*times[j])*(results[j-1][n-1]-strick); result /= (results[j-1][n-1]-b[j-1]); result /= volatility1; result /= Math.sqrt(tau[j-1]);
double another = inverseH(results[j-1][n-1]-b[j-1], tildeS[j-1], tau[j], interest, volatility1); result *= Math.exp(-another*another/2.0); result /= Math.sqrt(2.0*Math.PI); g[j-1] += result;
41
} }
for (int j=1; j<=dividends1; j++) {
g[j-1] /= simulations;
double result = results[j-1][n-1] + a*g[j-1]; if (result < strick) { result = strick; } if (result > 5*strick) { result = 5*strick; } results[j-1][n] = result; } } model.removeTableModelListener(this); for (int j=1; j<=dividends1; j++) {
model.setValueAt(new Double(results[j-1][iteration-1]), j-1,3); }
model.addTableModelListener(this);
// show results
// create dataset
XYSeriesCollection dataset = new XYSeriesCollection(); // create series
XYSeries[] series = new XYSeries[dividends1]; for (int j=1; j<=dividends1; j++) {
series[j-1] = new XYSeries(LEGEND+j); }
double minResult = Double.POSITIVE_INFINITY; double maxResult = Double.NEGATIVE_INFINITY; for (int j=1; j<=dividends1; j++) {
for (int n=0; n<iteration; n++) { // fill series series[j-1].add(n,results[j-1][n]); if (results[j-1][n]<minResult) { minResult = results[j-1][n]; } if (results[j-1][n]>maxResult) { maxResult = results[j-1][n]; } }
// add series to data set
dataset.addSeries(series[j-1]); }
// create graph
JFreeChart chart = ChartFactory.createXYLineChart(
GRAPH_TITLE, // chart title
X_LABEL, // x axis label
Y_LABEL, // y axis label
dataset, // data
PlotOrientation.VERTICAL, true, // include legend
true, // tooltips
false // urls
); // change y axis
XYPlot plot = (XYPlot) chart.getPlot(); ValueAxis rangeAxis = plot.getRangeAxis();
rangeAxis.setRange(minResult-0.02, maxResult+0.02); // show graph
42
outputPanel.setVisible(true); return;
} }
private double h(double z, // standard normal random variable
double strike, // strike price
double t, // time
double r, // interest rate
double sigma // volatility
) { double answer = r; answer -= sigma*sigma/2.0; answer *=t; answer += sigma*Math.sqrt(t)*z; answer = strike*Math.exp(answer); return answer; }
private double inverseH(double s, double tildeS, double tau, double interest, double volatility) { double answer = s; answer /= tildeS; answer = Math.log(answer); answer -= (interest-volatility*volatility/2.0)*tau; answer /=(volatility*Math.sqrt(tau)); return answer; }