http://www.diva-portal.org
Preprint
This is the submitted version of a paper published in Review of Behavioral Economics.
Citation for the original published paper (version of record): Eriksson, K., Cownden, D., Ehn, M., Strimling, P. (2014) ‘Altruistic’ and ‘antisocial ’ punishers are one and the same Review of Behavioral Economics, 1(3): 1-13
https://doi.org/10.1561/105.00000009
Access to the published version may require subscription. N.B. When citing this work, cite the original published paper.
Permanent link to this version:
1
‘Altruistic’ and ‘antisocial’ punishers are one and the
same
Kimmo Eriksson1,2, Daniel Cownden1, Micael Ehn1, Pontus Strimling1
1Centre for the Study of Cultural Evolution, Stockholm University, Sweden
2School of Education, Culture and Communication, Mälardalen University, Västerås, Sweden
Correspondence should be addressed to Kimmo Eriksson, Centre for the Study of Cultural Evolution, Stockholm University, SE-10691 Stockholm, Sweden. E-mail:
kimmo.eriksson@mdh.se.
Email addresses of other co-authors: dcownden@gmail.com, micael.ehn@gmail.com, pontusstrimling@gmail.com
This research was supported by the Swedish Research Council [grants 2009-2390 and 2009-2678].
2
‘Altruistic’ and ‘antisocial’ punishers are one and the
same
Abstract
In certain economic experiments, some participants willingly pay a cost to punish peers who contribute too little to the public good. Because such punishment can lead to improved group outcomes, this costly punishment has been conceived of as altruistic. Here we provide evidence that individual variation in the propensity to punish low contributions is unrelated to altruism. First, individual use of punishment was uncorrelated with contribution to the public good, contrary to the hypothesis that punishers are proximally motivated by prosocial
preferences. Second, individual use of punishment was positively correlated across situations where the use of punishment is typically group beneficial and situations where the use of punishment is typically group detrimental, as well as across situations of radically different strategic structures. These findings contrast sharply with the premise that the tendency to use punishment can fruitfully be regarded as an adaptation for solving social dilemmas.
3
Economic experiments have shown that people use costly punishment in public goods games more frequently than is expected from rational optimizers of financial gain (1-3). Often, though not always, this punishment is directed at those who have made low
contributions to the public good. While contributions to the public good diminish over time in the absence of punishment, the addition of costly punishment, contingent on the particular usage of that punishment, can induce and sustain cooperation. Thus punishment, in some cases, appears to solve the first order social dilemma of the public goods game. This finding has inspired an “altruistic” punishment hypothesis: human cooperation in social dilemmas is explained, in part, by the prevalence of individuals predisposed by evolution to pay the costs of punishing non-cooperators and thus sustain cooperation. Here we provide direct tests of both a motivational and an instrumental interpretation of the “altruistic” punishment hypotheses namely: i) Punishment is directly motivated by prosocial preferences. ii)
Regardless of proximal motivation, individual propensity to punish is a (cultural) group level adaptation specifically for solving collective action problems.
Under the motivational interpretation of the altruistic punishment hypothesis, punishment of low contributors should be correlated with other behaviors that are motivated by prosocial preferences. Although general patterns of behavior in the public goods game can be
understood without invoking prosocial preferences (4), individual differences in contributions to the public good when there is no threat of punishment are related to individual differences in prosocial preferences (5). Therefore, within groups playing a public goods game the motivational interpretation of the altruistic punishment hypothesis predicts individual variation in contributions (in a condition with no punishment) to be correlated with use of punishment against low contributors (in a punishment condition).
4
Under an instrumental interpretation of the altruistic punishment hypothesis, the
propensity to engage in costly punishment of low contributors is viewed as an adaptation for solving social dilemmas. For this to be the case altruistic punishers should differentiate between those situations where punishment benefits the group and where punishment is detrimental for the group, and selectively employ punishment only when it will be of benefit. This assumption can be tested by comparing individual punishment behavior across distinct strategic situations.
Both the motivational and the instrumental interpretations of the “altruistic” punisher hypothesis can be tested within the experimental paradigm that inspired the hypothesis in the first place. We use the extensive cross-cultural data on behavior in public goods games, with and without punishment, assembled by Herrmann, Thöni & Gächter (6). Their study showed that the group benefit of costly punishment is contingent on the particular usage of costly punishment, and further that there are stable cross-cultural patterns in usage. Specifically, in some countries punishment of high contributors was so common that contributions were no higher with punishment than without punishment. While the original analysis focused on cross-cultural variation, the focus of our reanalysis is on individual variation in use of punishment. In addition, we also conducted a new experiment to test whether individual punishment behaviors are correlated across situations with radically different strategic structure. To obtain a simple but strategically radical modification of the public goods game we made contributions vicarious instead of voluntary.
Results
We first report results from our reanalysis of data from (6), and then turn to results from the new experiment. Two-tailed tests are used throughout with significance level 0.05.
5
Frequencies of different uses of punishment
In order to analyze individual variation in uses of punishment in (6), contributions to the public good were categorized as low, median, or high, depending on how they compared to the group’s median contribution in the same period. Every participant had opportunity to punish each of three other group members in each of ten periods, for a total of 33,600
punishment opportunities (29% of which were of low contributors, 27% of high contributors, and 43% of median contributors). Punishment was used with very different frequencies depending on the target’s contribution: whereas 46% of opportunities to punish low
contributions were used, high contributions were punished only 18% of the time, and median contributions only 8%. Note that this pattern is consistent with most punishment being triggered by norm violations (7), where deviation downwards from the median is more provocative than deviation upwards.
The effect on group outcome of different uses of punishment
For each group we calculated the total effect of punishment on contributions as the group’s total contribution over the ten periods with punishment minus the group’s total contribution over the preceding ten periods with no punishment. For each group we also computed the frequencies with which punishment was used per opportunity to punish low, median, and high contributions. Table 1 reports the results of a linear regression predicting the total effect of punishment on contributions from the three frequencies of different kinds of punishment (explaining 26.3% of the total variance). As expected, punishment of low contributions had a positive effect on contributions, whereas punishment of high contributions had a negative effect. Also punishment of median contributions had a negative effect on contributions, although not as large. As the negative effect of punishment of median contributions has no
6
straightforward interpretation, our subsequent analysis will focus on the other two uses of punishment.
Table 1. Linear regression predicting the total of effect of punishment on a group’s
contributions from the frequencies with which different uses of punishment were used in the group.
beta t p
punishment of low .37 6.08 <.001 punishment of median -.22 -2.86 .005 punishment of high -.28 -3.58 <.001 Note. Betas are standardized coefficients.
Individual differences in uses of punishment
Throughout the remainder of this results section, “correlation” will always refer to
Spearman correlation. For every participant we computed the relative frequencies with which the participant used opportunities to punish low contributors and high contributors. A
frequency was left undefined if there was not a single opportunity on which to base it. Within each group of four participants we computed the correlation between the two frequencies as a measure of the extent to which frequent punishers of high contributors also tended to be frequent punishers of low contributors. This correlation was defined for the 182 (out of 280) groups where both frequencies were defined and had non-zero variation. As presented in Figure 1(a), these within-group correlations were mostly positive and the mean correlation was significantly greater than zero, M = 0.29, SD = 0.53, t(181) = 7.43, p < .001. Analysis by city yielded a positive mean correlation in each of the 16 cities (ranging from 0.06 in Athens, Greece, to 0.65 in Riyadh, Saudi Arabia). Thus, it may be a universal tendency that
7
individuals who often punish low contributors are also more likely to punish high contributors.
Figure 1. Distributions of the within-group correlations between individual use of
punishment against low contributors and (a) use of punishment against high contributors, (b) individual contributions in condition without punishment.
Correlations between individual’s contributions and their use of punishment
To assess the relation between altruism and use of punishment we computed each participant’s total contribution over the ten periods without punishment. Within each group we measured the extent to which those who made relatively high contributions (without punishment) tended to be frequent users of punishment against low contributors. The mean correlation was not significantly different from zero (M = -0.01, SD = 0.58, based on 247 groups). Thus, individual variation in punishment behavior was independent from individual variation in contribution behavior; see Figure 1(b).
Voluntary and vicarious contributions to the public good
Intrigued by the finding that individual use of punishment against high and low contributors is correlated, we wanted to test whether individual variation in punishment use was correlated
8
across a diverse, yet comparable, sample of strategic situations. Specifically, we sought to contrive a strategic structure such that punishment of high, rather than low, contributors would be the more frequent use of punishment. To this end we added treatments where contributions to the public good were vicarious instead of voluntary. In these treatments, at the beginning of each period every player was assigned a vicarious donor, another group member who decided on a contribution on that player’s behalf. Note that the vicarious donor’s interest is aligned with the collective interest but opposed to the selfish interest of the group member on whose behalf the contribution is made. Whereas voluntary contributions showed a marked increase with punishment, Figure 2 shows that vicarious contributions were high already without punishment and did not increase with punishment.
Figure 2. Groups’ mean contribution per player and period in four different treatments
9
Shift in use of punishment under voluntary and vicarious contributions
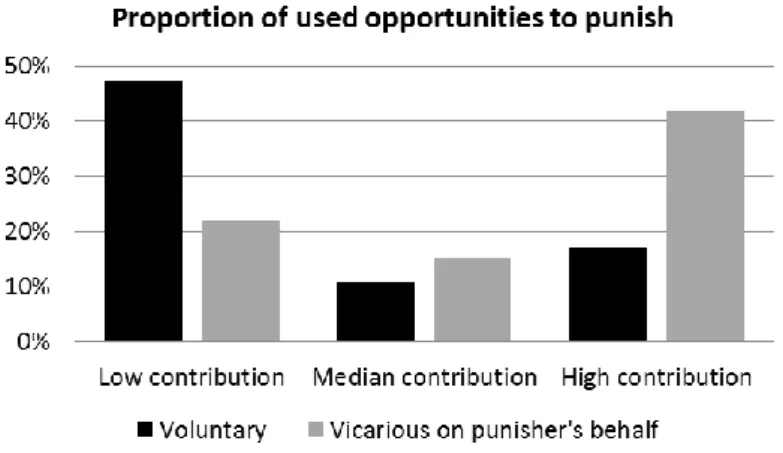
Figure 3. Total proportions of opportunities to punish voluntary contributors and vicarious
donors on punisher’s behalf when they made low, median, and high contributions.
Figure 3 shows the total frequencies of punishment per opportunity, against voluntary contributors and against the punisher’s vicarious donor. First, note that results for voluntary contributions closely replicate the pattern found in the first study. Second, note that the
punishment pattern is reversed for the vicarious donor: vicarious contributions on a punisher’s behalf were much more likely to be punished when they were high than when they were low.
Importantly, this shift in use of punishment can be observed also on the level of
individuals. Consider the subset of participants who punished low voluntary contributions at least once but never punished high voluntary contributions. These would be the strongest candidates for individuals consistently using punishment “altruistically”. Nonetheless, when the setting changed to vicarious contributions most of them changed their punishment
behavior: the majority (60%) used at least one opportunity to punish their vicarious donor for making a high contribution on their behalf; in contrast, only a minority (37%) used any opportunity to punish their vicarious donor for making a low contribution on their behalf.
10
Correlations between individuals’ use of punishment of voluntary and vicarious contributions Focusing only on voluntary contributions to begin with, the findings of the first study were
replicated in this experiment: the mean correlation between the two uses of punishment was positive (M = 0.41, SD = 0.45, t(23) = 4.50, p < .001; based on 24 groups), whereas use of punishment against low contributors was not significantly correlated with high contributions in the absence of punishment (M = 0.09, SD = 0.54; based on 36 groups),.
The main point of the new experiment was to study whether individual differences in propensity to use punishment correlated across the two strategic structures (regardless of whether the target contribution was high or low). Indeed they did. As presented in Figure 4, within-group correlations between individuals’ frequency of punishment of voluntary
contributors and their frequency of punishment of their vicarious donor were mostly positive with mean significantly greater than zero (M = 0.30, SD = 0.55, t(32) = 3.19, p = .003; based on 33 groups).
Figure 4. Histogram over the distribution of the within-group correlations between
individual use of punishment against voluntary contributors and against vicarious donors on the punisher’s behalf (N = 33).
11
Above two key findings emerged regarding individual differences in use of costly
punishment. First, use of punishment was unrelated to prosociality (measured by contributions to a public good under no threat of punishment). Second, use of punishment showed
significant consistency across distinct situations: The same individuals tended to be the most frequent punishers of both high and low contributors, and of both voluntary and vicarious contributions. This consistency across situations is remarkable given that the effect of
punishment tends to be positive for the group in some situations and negative in others. These findings have implications for both the proximate mechanisms driving costly punishment and the evolutionary origins of these mechanisms.
The basic premise of personality psychology is that individuals show consistent patterns of behavior across diverse situations. An important question is how personality traits help shape behavior in economic games. Recently Yamagishi et al. (8) found that prosocial behaviors are correlated across a variety of distinct strategic situations and also correlate with the
personality trait social value orientation.
Our finding that contribution behaviors and punishment behaviors are uncorrelated suggests that prosocial preferences, though they act broadly across multiple strategic
situations, are not significant determinants of punishment behavior. This is in agreement with the recent finding of Yamagishi and colleagues (9) that rejection of low offers in the
ultimatum game (long viewed as a form of altruistic punishment) is uncorrelated with various helping behaviors. Use of punishment and sanctions instead appear to be related to patience and impulsivity (10, 11), normative considerations (7, 12-15), and genetic correlates of aggression (16).
Thus, an accumulating body of evidence suggests that punishment behaviors and prosocial behaviors do not share the same proximal motivations. This, however, says nothing about the
12
possibility that the propensity to punish may have been selected for as a means of maintaining cooperation.
A decade ago the notion that costly punishment behavior may be a specific adaptation to social dilemmas was popularized (3), though see (17, 18). A recent meta-analysis has confirmed that the effects of punishment on cooperative behavior in social dilemma experiments tend to be positive on average (19). Nonetheless, the case for this particular evolutionary origin of punishment is weakened by experiments showing that the
group-beneficial effects of punishment are easily nullified by cultural conditions (6, 20) or by adding an opportunity for costly counter-punishment (21), suggesting that the provision of
punishment cannot generally be considered a public good (22).
Our findings highlight an additional problem, namely the premise that costly punishment is an adaptation to a specific strategic situation. The assumption of situational specificity is implicit in all evolutionary models, e.g. (23-28). Our findings require that this premise be reconsidered because it is inconsistent with the actual observed patterns of individual punishment use. Recall that we found the propensity to engage in costly peer-to-peer punishment to be correlated across situations where punishment is beneficial and where punishment is detrimental, both for the punisher and their group.
If the same set of proximate mechanisms (such as impulsivity, normative sensitivity, and aggression) determine punishment behavior across various situations, as the correlation between punishment behaviors across situations suggests, then the payoffs associated with any one particular situation cannot be used to model the evolution of punishment. Instead the relative evolutionary significance of each situation where punishment occurs and the impacts of punishment in that situation must be considered in aggregate. The task of the evolutionary theorist becomes more complicated still if the proximal motivators of punishment also impact other non-punishment behaviors. In this case the relative evolutionary significance of each
13
situation where a given proximal motivator affects behavior and the impact of that proximal motivator on the outcome of the situation must be considered in aggregate. This situation can be viewed as analogous to the biological situation of pleiotropy where multiple traits are influenced by a single gene, resulting in the selective pressures on that gene being determined not by the fitness effect of any one particular trait, but by the aggregate fitness effects of each trait associated with the gene. In the case of costly punishment it appears likely that a small set of proximal motivators create a consistent pattern of punishment use across a variety of situations. For instance, to the extent that use of punishment is determined by aggression and aggression is genetically influenced (16), one must consider the aggregate fitness effects of aggression across the multitude of relevant situations. This makes it impossible to view punishment behavior in any one particular situation (e.g., the public goods game) as an
adaptation. Indeed, in the rich and rapidly changing context of human social life, it remains an open question as to whether punishment-prone individuals are on average an asset or a
problem for their groups.
We hope these findings will spur empiricist and theoreticians to consider the evolution of personality traits, normative behavior, and the interaction of the two within the context of multiple strategically distinct but perceptually similar game situations.
Methods
Herrmann et al. (6) conducted their experiment in 16 cities across the world. A total of 1120 participants were assigned to 280 fixed groups with four participants in each group. Each group took part in 20 periods of a repeated public goods game that followed a standard protocol. In each period, players made voluntary contributions to a public account, which was multiplied by a factor of 1.6 and redistributed equally to all players regardless of their
14
provided. During the last ten periods participants were given an opportunity to punish other players after contributions had been made and revealed. Specifically, a player might reduce other players’ profits at a cost of 1 unit for every 3 units of profit reduction. For all further details we refer to the original paper.
For the new experiment, one hundred sixty participants (54% male, average age 28 years) were recruited from a pool of volunteers, primarily students at a university in Sweden. Participants were assigned to one of 40 fixed groups with four participants in each group. Each group took part in 32 periods of a repeated public goods game played over a local computer network. In each period every participant received an endowment of 20 units and contributions from these endowments to the common pot were doubled and distributed equally to all group members. These 32 periods were broken into four separate treatments, each a distinct variant of the public goods game iterated for eight periods. Two treatments were similar to the first study. The other two treatments used the vicarious contribution
mechanism, first without punishment and then with punishment. Players could be punished on the basis of the vicarious contributions they had chosen for others, again at a cost to the punisher of 1 unit for every 3 units of lost profit inflicted. In addition it was made clear to potential punishers which contribution was made on their behalf. Full instructions are presented in the Supplemental Material available online.
Acknowledgments
Helpful comments from Brent Simpson, Nikos Nikiforakis, Benedikt Herrmann, and Marilynn Brewer are gratefully acknowledged.
References
1. Yamagishi T (1986) The provision of a sanctioning system as a public good. Journal
15
2. Fehr E & Gächter S (2000) Cooperation and punishment in public goods experiments.
The American Economic Review 90(4):980-994.
3. Fehr E & Gächter S (2002) Altruistic punishment in humans. Nature 415(6868):137-140.
4. Burton-Chellew MN & West SA (2013) Prosocial preferences do not explain human cooperation in public-goods games. Proceedings of the National Academy of Sciences 110(1):216-221.
5. Balliet D, Parks C, & Joireman JA (2009) Social value orientation and cooperation in social dilemmas: A meta-analysis. . Group Processes & Intergroup Relations
12(4):533-547.
6. Herrmann B, Thöni C, & Gächter S (2008) Antisocial punishment across societies.
Science 319(5868):1362-1367.
7. Irwin K & Horne C (2012) A Normative Explanation of Antisocial Punishment. Social
science research.
8. Yamagishi T, et al. (2013) Is behavioral pro-sociality game-specific? Pro-social preference and expectations of pro-sociality. Organizational Behavior and Human
Decision Processes 120(2):260-271.
9. Yamagishi T, et al. (2012) Rejection of unfair offers in the ultimatum game is no evidence of strong reciprocity. Proceedings of the National Academy of Sciences 109(50):20364-20368.
10. Crockett MJ, Clark L, Lieberman MD, Tabibnia G, & Robbins TW (2010) Impulsive choice and altruistic punishment are correlated and increase in tandem with serotonin depletion. Emotion (Washington, DC) 10(6):855.
11. Espín AM, Brañas-Garza P, Herrmann B, & Gamella JF (2012) Patient and impatient punishers of free-riders. Proceedings of the Royal Society B: Biological Sciences 279(1749):4923-4928.
12. Brauer M & Chaurand N (2010) Descriptive norms, prescriptive norms, and social control: An intercultural comparison of people's reactions to uncivil behaviors.
European Journal of Social Psychology 40(3):490-499.
13. Carpenter J & Matthews PH (2009) What norms trigger punishment? Experimental
Economics 12(3):272-288.
14. Chaurand N & Brauer M (2008) What Determines Social Control? People's Reactions to Counternormative Behaviors in Urban Environments1. Journal of Applied Social
Psychology 38(7):1689-1715.
15. Parks CD & Stone AB (2010) The desire to expel unselfish members from the group.
Journal of personality and social psychology 99(2):303.
16. McDermott R, Tingley D, Cowden J, Frazzetto G, & Johnson DD (2009) Monoamine oxidase A gene (MAOA) predicts behavioral aggression following provocation.
Proceedings of the National Academy of Sciences 106(7):2118-2123.
17. Fowler JH (2005) Altruistic punishment and the origin of cooperation. Proceedings of
the National Academy of Sciences of the United States of America 102(19):7047-7049.
18. Rankin DJ, dos Santos M, & Wedekind C (2009) The evolutionary significance of costly punishment is still to be demonstrated. Proceedings of the National Academy of
Sciences 106(50):E135-E135.
19. Balliet D, Mulder LB, & Van Lange PA (2011) Reward, punishment, and cooperation: A meta-analysis. Psychological Bulletin 137(4):594.
20. Wu J-J, et al. (2009) Costly punishment does not always increase cooperation.
16
21. Nikiforakis N (2008) Punishment and counter-punishment in public good games: Can we really govern ourselves? Journal of Public Economics 92(1):91-112.
22. Strimling P & Eriksson K (In Press) Regulating the regulation: Norms about how people may punish each other. Social Dilemmas: Punishment and Rewards, eds Van Lange P, Yamagishi T, & Rockenbach B (Oxford University Press, Oxford).
23. Boyd R, Gintis H, Bowles S, & Richerson PJ (2003) The evolution of altruistic punishment. Proceedings of the National Academy of Sciences 100(6):3531-3535. 24. dos Santos M, Rankin DJ, & Wedekind C (2011) The evolution of punishment
through reputation. Proceedings of the Royal Society B: Biological Sciences 278(1704):371-377.
25. Eldakar OT & Wilson DS (2008) Selfishness as second-order altruism. Proceedings of
the National Academy of Sciences 105(19):6982-6986.
26. Hauert C, Traulsen A, Brandt H, Nowak MA, & Sigmund K (2007) Via freedom to coercion: the emergence of costly punishment. science 316(5833):1905-1907. 27. Henrich J & Boyd R (2001) Why people punish defectors. Journal of theoretical
biology 208(1):79-89.
28. Rand DG & Nowak MA (2011) The evolution of antisocial punishment in optional public goods games. Nature Communications 2:434.