Factors that make non buyers
hesitant to buy groceries
online
KOREA, SARGON
LE, JULIA
ONURSAL, RUBAR
School of Business, Society & Engineering Course: Bachelor Thesis in Business
Administration
Course code: FOA243 15 cr
Supervisor: David Freund Date: 2021.06.02
ABSTRACT
Date: 2021.06.02
Level: Bachelor Thesis in Business Administration, 15 cr
Institution: School of Business, Society and Engineering, Mälardalen University
Authors: Korea, Sargon Le, Julia Onursal, Rubar
(99/02/11) (98/09/09) (93/04/18)
Title: Factors that make non buyers hesitant to buy groceries online
Tutor: David Freund
Keywords: Non buyers, Online grocery, Theory of Planned Behavior and
Technology Acceptance Model
Research-Question: What are the factors that make non buyers hesitant to buy groceries online?
Purpose: The purpose of this study is to examine why non buyers hesitate to
buy groceries online. Different factors are linked to two theoretical frameworks, namely Theory of planned behavior (TPB) and Technology acceptance model (TAM).
Method: This study is of a quantitative nature, by conducting a web-based
questionnaire. The study applies a deductive approach in order to test the relationship between the dependent and independent variables of TPB and TAM in the context of non buyers of online grocery in Sweden. The main analysis for this study is a simple linear regression analysis.
Conclusion: The results of this study show that the main predictor of non buyers’ hesitation to buy groceries online are the factors of perceived behavioral control. Other factors that had a significant effect on intention were the ones regarding attitude, external variables and perceived ease of use. While factors of subjective norm and perceived usefulness had no influence on non buyers’ intention.
Table of Content
1. Introduction 1
1.1 Problem background and research question 1
1.2 Purpose 2
2. Literature Review 4
2.1 Theory of planned behavior literature 4
2.2 Theory of planned behavior combined with other frameworks 6
2.3 Technology acceptance model literature 7
2.4 Other literature in the same research field 9
2.5 Articles without a theoretical framework 9
2.6 Choice of theoretical framework 10
3. Conceptual Framework 11
3.1 Theory of Planned Behavior 11
3.1.1 Attitude 12
3.1.2 Subjective norm 13
3.1.3 Perceived behavioral control 13
3.1.4 Intention 14
3.1.5 Behavior 14
3.2 Technology Acceptance Model 15
4. Methodology 17
4.1 Methodological approach 17
4.2 Methods of data collection 18
4.2.1 Primary data 19
4.2.2 Construction of questionnaire 19
4.2.3 Sampling 23
4.2.4 Operationalization 24
4.2.5 Secondary data 27
4.3 Process of literature review 27
4.4 Method of analysis 27
4.5 Reliability 31
4.6 Validity 32
5. Analysis and findings 33
5.1 Selection and multiple choice questions 33
5.2 Demographics 34
5.3 Items 35
5.4 Correlation 37
5.4.1 TPB’s correlating items 37
5.4.3 TAM’s correlating items 38
5.5 Simple linear regression 39
7. Conclusion 45
8. Limitations 46
9. Recommendations for future research 47
References 48
1. Introduction
In this chapter, a brief overview of the e-commerce industry will be introduced, followed by the online grocery market, research question and purpose for this study.
1.1 Problem background and research question
The switch from physical stores into electronic commerce (hereafter referred to as e-commerce) has been backed by cost and business efficiency in different departments of the value chain. For instance, a positive impact on the cost of labor, the cost of inventory management and the cost of materials ordering process has been noted in a study conducted by Baršauskas et al. (2008). Furthermore, e-commerce not only decreases costs and increases efficiency of businesses, but it also allows for consumers to receive quality products and services for lower prices in a much more convenient way, which in turn increases the competitiveness of businesses. In addition, e-commerce makes it possible for enterprises to reach out to new markets, which would not have been possible had it not been for e-commerce (Wang, 2016).
The most common business model within e-commerce is the business to consumer model. The model applies to a large scale of businesses and offers several unique perspectives. The fundamental aspect of the business to consumer business model is the transaction of goods or services between the company and the individual. The transactions have different perspectives, as it may occur in several ways. The most common type is direct sellers, this perspective includes both smaller online businesses as well as larger corporations. Moreover, direct sellers include everything an individual is able to buy online (Keikha & Sargolzaei, 2017).
The convenience and cost efficiency of e-commerce is growing, however, not many customers have chosen to adapt to the technological innovation in the online grocery industry. The adoption of online grocery shopping has been relatively slow compared to other industries within e-commerce.
For instance, online grocery shopping in Europe amounted to just under 20% in the year of 2020. In comparison, the most adopted industry which is clothing, had over 60% of people between the age of 16-74 making an online purchase (Eurostat, 2021). According to Eurostat (2020) 82% of the Swedish individuals between the age of 16-74 had ordered goods or services online. Even though the customer gains several benefits from purchasing groceries online, many customers are willing to adapt only if the cost is right. Driving to the supermarket, and walking through the store with a shopping cart and losing out on valuable time is not the optimal choice of purchasing groceries (Galante et al., 2013).
Consumers that are skeptical and unwilling to try new services such as online grocery shopping are, according to Bryła (2016) and Soopramanien (2011) known as non buyers. This type of consumer tends to emphasize the negative aspects of a new service. Research regarding the motives behind the hesitation of non buyers of online groceries is still in its infancies, which leads to the research question that this study will attempt to answer:
● What are the factors that make non buyers hesitant to buy groceries online?
1.2 Purpose
The purpose of this study is to fill in the gap that has been identified in previous studies regarding purchase intention of online consumers. Furthermore, the authors are curious as to why adoption of online grocery seems to be slow in comparison to other highly adopted industries such as online clothing (Eurostat, 2021). As different studies such as Saleki et al. (2019) and Troise et al. (2020) have focused on factors that affect the purchase intention for online grocery buyers, this study will instead focus on factors that make non buyers of online groceries not buy online. This is due to the lack of previous research in the particular topic of non buyers of online groceries. Non buyers defined
by the authors of this paper, refers to individuals that have not purchased groceries online more than twice in the last 12 months and are therefore not considered regular online grocery buyers.
The chosen topic will be investigated through the use of the theory of planned behavior (hereafter referred to as TPB) with the technology acceptance model (hereafter referred to as TAM) as a supportive theory. This study will focus on the thematic units that were pointed out in the study conducted by Klepek and Bauerovȧ (2020). The thematic units include; preference to see groceries in person, faster in store grocery shopping, personal contact with sellers, among other factors that will be specified later in the methodology. In addition, Klepek and Bauerová (2020) recommended further research using a quantitative approach in order to produce a more generalizable outcome. Therefore, the aim of this study will be fulfilled by conducting a quantitative study by offering the respondents a closed ended questionnaire, instead of an open ended one similar to Klepek and Bauerovȧ’s (2020). Moreover, a study conducted by Gao et al. (2020) investigated consumers’ online food purchase behavior in the context of COVID-19. Nonetheless, their main focus was to investigate the effects of COVID-19 on the online food purchasing, as well as only focusing on the Chinese market. In addition, several studies including Driediger and Bhatiasevi (2019) and Troise et al. (2020) applied the TPB and TAM to their research papers when investigating purchasing behavior of grocery shoppers, which partly influenced the choice of using these frameworks for this study.
None of the aforementioned studies fulfill the same objective as this research paper. For instance, the purchasing behavior of online grocery consumers has been thoroughly researched through the years such as the research conducted by Saleki et al. (2019). The behavior of non buyers has not been equally focused on in previous research, thus leading to the purpose of this study with non buyers of online groceries as the main objective. Additionally, previous research has been focusing on various countries, henceforth, to the best of our knowledge, most of the researched countries were either located in Asia or Eastern Europe. Sweden which is the focus of this study is a well developed country located in northern Europe, with a developed economy (United Nations, 2021). According to Svenskarna och internet (2019) and Statista (2019), 98% of the Swedish inhabitants have access to the internet, whilst only 86% of the Czech population that was explored in the study by Klepek and
Bauerová (2020), have access to the internet. Therefore, this allows the authors of this paper to choose Sweden as the focus area for this study.
The next chapter contains a brief description of the literature review (chapter 2), followed by the conceptual framework where the chosen theory for this research paper will be further elaborated upon (chapter 3). In chapter 4 we define the methodology of the research paper, followed by our findings in chapter 5. Next, in chapter 6 we discuss our findings and conclude in chapter 7 with the implications of our findings, as well as the results of the study and what it means for our research question. In chapter 8 we present the limitations of this study followed by the final chapter (chapter 9) where we present recommendations for future research.
2. Literature Review
This chapter will offer the reader a brief overview of previous research in the chosen field. The authors will elaborate upon the most relevant studies regarding the concept of buying groceries online and e-commerce in general as well as the chosen frameworks used to conduct the chosen studies and thereby choose the appropriate framework for this research.
2.1 Theory of planned behavior literature
A study conducted by Saleki et al. (2019) aimed to examine different factors that may affect purchase intention and purchase behavior for the consumer of organic food in a non western context by applying the TPB. The authors used judgemental sampling and obtained responses from 246 Malaysian organic food consumers. Partial least squares structural equation modeling was the method used by Saleki et al. (2019) in order to analyze the obtained data. The variables that were in focus of the study include; attitude, subjective norm, perceived behavioral control, moral norm, self identity and environmental concern. These variables were found to have a significant positive effect on consumers’ purchase intention. In addition, these variables and purchase intention had a positive
effect on purchase behavior. Furthermore, the study also found that the relationship between purchase intention and purchase behavior was moderated by price consciousness.
As mentioned earlier, this study made use of the TPB and expanded the framework by including additional variables, namely, moral norm, self identity and environmental concern. This in turn helped improve the TPB’s ability to predict consumer behavior. Some of the main implications of this study was that it places an emphasis on marketers to implement different marketing strategies. For instance, discounts, new product development and reducing the cost of organic food may assist with increasing consumers’ intention to purchase organic food and attract more customers. Nonetheless, the study had some limitations which presented opportunities for future research. According to Saleki et al. (2019), one limitation of their research was that there are still some variables that are unaccounted for in the study when it comes to behavioral intention. Thus, opening the way for future research to include more variables in the TPB in order to further improve its predictive abilities when it comes to consumers’ purchase intention of organic food.
Another relevant study for this paper is a research conducted by Rasmus and Nielsen (2005). The study focused on what consumers think when purchasing groceries online. The research paper used the TPB as a theoretical framework in order to explore the chosen topic. The methodological approach for this paper was that it used focus group interviews conducted in the United Kingdom as a method for gathering the data. The TPB was used as a framework to construct guidance for the seven focus groups in question, and was to be followed by all. The chosen respondents were of diverse backgrounds, that covered a wide range of experienced online buyers. The findings revealed that the majority of the focus groups were united in their thoughts and beliefs for buying groceries online, which could be connected to the attitude variable of the TPB. The advantages were the convenience, product range and price. Whereas, the disadvantages were the risk of receiving inferior quality grocery as well as the loss of the recreational aspect of grocery shopping. However, the research bears minor limitations such as, the methodological approach of only conducting focus groups as well as the high areal concentration rate.
2.2 Theory of planned behavior combined with other frameworks
Other studies that are relevant to this research have combined the TPB with other theories such as the theory of reasoned action (hereafter referred to as TRA) and the TAM. One such study is the one conducted by Hansen et al. (2004) with the purpose to test two consumer theories, namely, TRA and the TPB, and their ability to predict consumer buying intention regarding online grocery shopping. The theories were also compared to each other in order to be able to fulfill the main aim of the study, which was to find out which of the theories has the better predictive ability. Data was collected using two web based surveys with self administered questionnaires. One for the Swedish consumers, which included 1038 respondents, and the other for the Danish consumers with 1222 responses collected. Different measurement scales were used in the questionnaires in order to gather data from the respondents. The scales include a five-point Likert scale, a seven-point semantic scale and a seven-point scale ranging from 0% to more than 50%. As mentioned before, Hansen et al. (2004) used TRA and TPB with the inclusion of a path from subjective norms to attitude in the framework. One of the main findings of the study was that both theories were capable of predicting buying intentions of online grocery consumers. As it was revealed that subjective norms had a significant relationship with online buying intention. In addition, a significant relationship between attitude and online buying intention were also allocated, along with the relation between perceived behavioral control and online buying intention. Like any other study, the study conducted by Hansen et al. (2004) had some limitations that made room for further research. For instance, only behavioral intention was considered in this study as it did not examine any other factors that might provide different results, for example, actual online shopping patterns. The study may also not be generalizable since it only takes groceries into account and does not consider other product categories.
Another study that combined the TPB with another theory is the study conducted by Troise et al. (2020). This study had a purpose to analyze consumers of online food delivery services willingness and intention to use food delivery apps. In order to fulfill the purpose of the study, Troise et al. (2020) used an integrated framework that combines the TPB with the TAM. The authors intended to extend
the framework, to also consider factors of food choices, convenience, trust and the effect of the risks related to the COVID-19 pandemic. In addition, the partial least squares approach to structural equation modeling was used as a method in the study. A final sample consisting of 425 people located in Italy was the focus of this study when conducting the research questionnaires. One of the main findings of this study is that the model used, which combines the TPB and the TAM, could be a valid model in understanding the behavioral intention of online food delivery users. The results of the study showed that subjective norm had a stronger effect on behavioral intentions than the personal attitude. The TPB was found to be fully supported, as the authors found significant influences on behavioral intention from attitude, subjective norm and perceived behavioral control. The TAM was found to be partly supported since no support was found for the relationship between perceived usefulness and behavioral intention. However, some limitations still persisted in this study. According to Troise et al. (2020), the lack of previous research in the field that this study covered, may be regarded as a limitation since research for comparison was missing. In addition, the choice of only investigating the Italian environment may be regarded as a limitation due to the inability to generalize the outcome.
2.3 Technology acceptance model literature
In regard to research that applies TAM as a single theoretical framework, Driediger and Bhatiasevi (2019) conducted a study with the purpose of observing the acceptance and usage behavior of online grocery shopping in Thailand. The authors used the TAM and expanded the framework by including subjective norm, visibility, perceived risk and perceived enjoyment. The reason behind the expansion was to gain a profound understanding of the factors and explore whether it leads to an acceptance or rejection of online grocery shopping. The methodological approach of this paper was of quantitative nature as the authors aimed to collect a broad range of responses, as well as confirming currently existing literature on the topic of online grocery shopping.
Driediger and Bhatiasevi (2019) focused on residents of Bangkok by applying a snowball sampling technique in order to collect the data. The study had two main sources of participants, the first one being parents of high school students and the second one being, graduate students from institutions and universities around Bangkok. A total of 450 questionnaires were distributed, however, the response rate was only 74% which resulted in 333 responses. Furthermore, due to the fact that the questions were primarily written in English and thereafter translated to Thai, the responses had to be translated back in order to be interpreted correctly. This led to several incomplete and invalid responses that had to be removed, which resulted in a total of 263 valid responses. As for the instrument development, the authors were able to use existing scales and items from current literature on TAM.
Moreover, Driediger and Bhatiasevi (2019) used a partial least squares structural equation modeling in order to draw the conclusion that perceived ease of use, intention to use, perceived usefulness, subjective norm and perceived enjoyment had a significant relationship toward the acceptance of online grocery shopping. On the contrary, perceived risk and visibility did not have a significant impact on the usefulness of online grocery shopping. Driediger and Bhatiasevi (2019) stated that this study is the first one to examine this area, they later on mentioned that it bears some limitations due to several reasons. As the authors had the aim to capture an overall representation of Thailand, it is uncertain whether the tested sample would be representative of the acceptance of online grocery shopping in Thailand. This is mainly due to the logistical challenges of online grocery shopping in less developed areas around the country. For future recommendations, the authors stated that a qualitative approach could be used in order to discover further unknown factors.
2.4 Other literature in the same research field
A study that may be relevant to this paper is a research conducted by Zendehdel et al. (2015) which had an aim to analyze college students’ online purchasing behavior in Malaysia. College students were selected as the target group for the study, due to several reasons. The main reason was because college students are seen as more active internet users compared to other groups in the society. The second reason was because this segment spends more money on the internet. A total of 375 students from different universities in Klang Valley were selected as participants for the study. The purpose of the study was the lack of research examining the particular topic, as Malaysia is perceived as one of the leading countries within e-commerce. By using Roger's innovation diffusion theory, the authors were able to examine particular factors that may have influenced the students' purchasing behavior. The particular factors that were examined are the perception of risk when purchasing online, as well as the subjective norms toward online purchasing. Zendehdel et al. (2015) noted that the lack of security when purchasing online was the common ground regarding limitations. An additional result of the study was that low cost benefits and discounts have a positive impact on potential buyers. However, the study lacked variables within the theoretical framework and reliability due to the limited target group.
2.5 Articles without a theoretical framework
A relevant research to this this paper is a study conducted by Klepek and Bauerovȧ (2020). The main focus area of this study was why retail customers hesitate to shop groceries online. Even though the study lacked a theoretical framework by using an inductive approach, it was still a valuable study that may be used as guidance for this paper. The authors applied a methodological approach by offering the respondents a web based questionnaire with open ended questions. The researchers gathered data from 670 respondents, targeting the general internet users of the Czech population. Furthermore, the sample size was divided into subgroups of; gender, age group, educational background, distribution by city and cohesion regions of the Czech Republic. The results of this paper were divided into two
sections, one from the gathered data of the open ended questionnaire, and the other by comparing similar studies from previous and ongoing research papers.
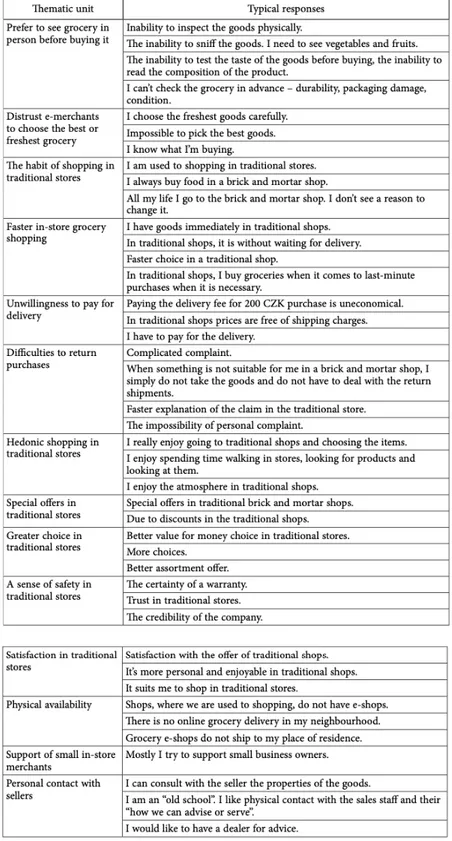
The results from the open ended questionnaire offered the researchers to allocate 14 thematic units that were frequently answered. Examples of the most frequent thematic units include that the respondents prefer to see groceries in person before making a purchase, which amounted to 43% of the respondents. The second most frequent thematic unit of 24.9% regarded the respondents' distrust toward e-merchants to choose the best or freshest groceries. The third thematic unit of 9% being that the respondents felt that they could buy their grocery in-store faster than buying online. The rest of the 11 thematic units amounted to less than a quarter of the respondents. This research paper was compared to previous research in the similar field, offering the reader extensive results. The sample size was on average 752.5 respondents for previous research, which concludes that this paper was of high validity. The main result of this paper showed that consumers hesitate to purchase online due to the absence of incorporating their senses, which previous research has also claimed. Moreover, this research offered similar results regarding the risk of not receiving fresh groceries due to the mistrust in the retailer as well as the slow process of receiving the goods due to the large time gap. However, this study bears several limitations which creates room for further research. The research design was of a qualitative nature, with a joint approach of induction as well as deduction, while the majority of similar research papers had quantitative methodological approach. Furthermore, this research paper only examined door to door delivery methods while neglecting other online grocery buying methods such as click and collect.
2.6 Choice of theoretical framework
To conclude, the seven studies discussed in the literature review have assisted with the development of the conceptual framework of this paper. Five of the studies reviewed that have applied the TPB, either alone or in combination with the TRA or TAM are the studies conducted by Saleki et al. (2019),
Rasmus and Nielsen (2005), Hansen et al. (2004), Troise et al. (2020) and Driediger and Bhatiasevi (2019). As for the aforementioned study that applied another theoretical framework, is the research paper conducted by Zendehdel et al. (2015). Furthermore, there was one study that did not apply a theoretical framework, namely, Klepek and Bauerovȧ (2020).
As for the methodological approach of the previous research, the majority chose to apply a quantitative approach, more specifically five studies chose to apply a quantitative approach whilst only two chose to conduct their research using a qualitative method. Furthermore, Klepek and Bauerova’s study (2020), which used a qualitative approach, recommended future research using a quantitative method. Therefore, the advantage of this study is that it will apply a quantitative method in order to form a more generalizable outcome since a qualitative method would not be appropriate to make a generalization on a population. After reviewing the theoretical frameworks of the different studies, the TPB and TAM were found to be the most appropriate frameworks in the specific research field of online grocery shopping as they are deemed the most useful when trying to explain human behavior by the authors of this paper and are two of the most widely applied theories when researching behavior. Thus, the two theories will be further explained in the next chapter.
3. Conceptual Framework
This chapter will outline the main conceptual framework for this study, namely the Theory of Planned Behavior (TPB) supported by the Technology Acceptance Model (TAM). The chosen frameworks in this chapter will be used for analyzing and understanding the behavior of non buyers of online groceries.
3.1 Theory of Planned Behavior
The theory of planned behavior (TPB) was developed in 1985 by Icek Ajzen, who is a social psychologist and a professor emeritus at the University of Massachusetts Amherst (Ajzen, 2011). The
TPB originates from the theory of reasoned action (TRA) that was developed earlier in 1967 by Martin Fishbein and is an extension to it (Conner & Armitage, 1998). Both theories are intended to explain and predict behavioral intentions of individuals that will in turn lead to actual behavior. While TRA only takes attitude and subjective norm into consideration when it comes to predicting
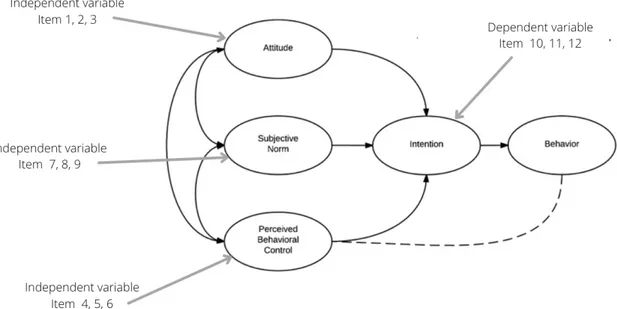
behavioral intention and eventually, actual behavior, the TPB extends the TRA to also include perceived behavioral control (see figure 1) (Conner & Armitage, 1998; Lin et al., 2015).
As for this research, the TPB framework may be applicable due to several reasons. To begin with, the TPB may be used in order to process the gathered data as well as variables depending on the subject. Moreover, the different categories may facilitate the process of drawing a conclusion on which factors that may affect non buyers’ hesitation to buy groceries online. Linking the result to different variables of the TPB such as attitude, perceived behavioral control, subjective norm and intention, will in turn lead to the prediction of behavioral outcome and factors behind non buyers hesitation to buy groceries online. Each variable of the TPB will be further explained in detail below.
3.1.1 Attitude
The first determinant variable of intention is the attitude toward the behavior. This concerns the extent to which an individual favorably or unfavorably evaluates or appraises a certain behavior. It is also noted that, the more favorable the individual’s attitude is, the more it is likely that the individual’s
intention to perform the behavior in question will increase (Ajzen, 1991). Underlying salient beliefs
are the determinants to an individual’s attitude according to the TPB. However, each individual may hold countless beliefs about a certain behavior, which makes it harder to detect the salient ones. According to Fishbein and Ajzen (Conner & Armitage, 1998; Fishbein & Ajzen, 1975), it is the first five to nine mentioned beliefs about a behavior that should be considered salient in a free elicitation, and therefore determinant of the individual’s attitude toward the behavior in question. For this study,
attitude will be used as an independent variable in order to examine if it is a factor behind non buyers’
3.1.2 Subjective norm
Subjective norm is a variable within the TPB that refers to the function of a product in regard to one’s
normative belief. Subjective norm may be defined as ‘’a person's belief that the salient referent thinks he or she should (or should not) perform the behavior, and his or her motivation to comply’’ (Ajzen, 1991). The subjective norms are appraised by social pressures on individuals to act or behave in a certain manner, also referred to as others. Others may include pressures from so called ‘referents’ who think the individual shall behave in a certain manner (Conner & Armitage, 1998). According to Ajzen (1991), a common rule to assume is that a more preferable subjective norm regarding a certain behavior, may strengthen the individual’s intention to perform that said behavior. For this study,
subjective norm will be used as an independent variable to examine any association it might have with
non buyers’ intention toward buying groceries online.
3.1.3 Perceived behavioral control
The third section of the TPB refers to perceived behavioral control and plays an important role within the model. The perceived behavioral control may act as the bridge between the TRA and the TPB, as this part contributes to the extension of the former theory and is the key difference between the two theories. Perceived behavioral control consists of two components, the first one being self-efficacy, which refers to the individual's perception of its capabilities to perform a given behavior, for instance, how easy or difficult it is to perform the behavior of interest. The second component is the controllability, which refers to whether the individual has the necessary resources, in the form of money or time, opportunities and skills to perform (Ajzen, 1991). Perceived behavioral control will be examined as an independent variable for this study, in order to determine if there is an association behind why non buyers of online groceries hesitate to buy online.
3.1.4 Intention
The intention variable of the TPB, refers to an individual's intention to perform a given behavior at a given time and place. Intentions are dependent on the aforementioned variables within the TPB framework. The independent determinants are attitude, subjective norm and perceived behavioral
control. Nevertheless, since the closing measures are reduced in regard to complexity, there is a high
tendency for future researchers to approach this variable in a straightforward manner (Conner & Armitage, 1998). For this study, intention will be used as a dependent variable in order to examine if the aforementioned independent variables have any influence on why non buyers hesitate to buy groceries online. In addition, intention may be seen as a precursor to behavior, and in turn determine the significant factors behind non buyers’ hesitation.
3.1.5 Behavior
The outcome of combining the function of intention and of perceived behavioral control is the performance of behavior. However, in order to acquire an accurate prophecy for behavior performance, the following conditions should be met. It is important for the measures of intention and of perceived behavioral control to correspond with the predicted behavior. This means that the
intentions and perception of control have to be assessed to the specific context of the intended
behavior. In addition, the specific context needs to align with the behavior that is to occur (Ajzen, 1991; Ajzen & Fishbein, 1980). The next condition for acquiring an accurate prediction is the stabilization between intentions and perceived behavioral control when assessing and observing the certain behavior. The final condition in order to increase the validity, has to do with the accuracy of
perceived behavioral control. As earlier mentioned, the prediction of behavior in relation to perceived behavioral control may improve the accuracy of to what extent the participants' perceptions could
rationally reflect the actual behavior (Ajzen, 1991). In this study, behavior is seen as a variable that is dependent on intention, in other words intention may act as a predictor of behavior regarding non buyers of online groceries.
Figure 1. The Theory of Planned Behavior Model
3.2 Technology Acceptance Model
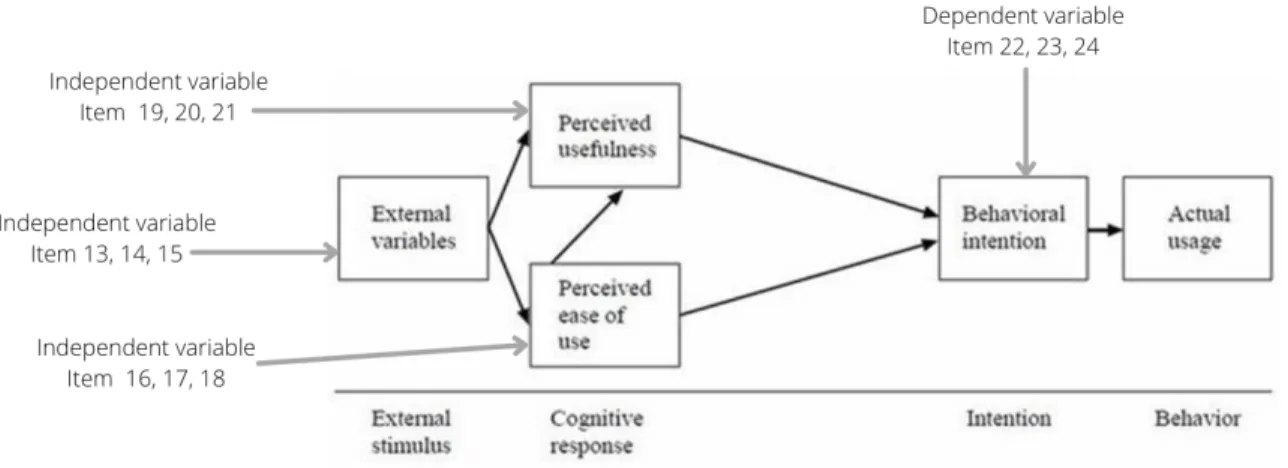
The technology acceptance model (TAM) was first proposed by Fred Davis in 1985 and further developed in 1986 by relying on the TRA by Fishbein and Ajzen. The TAM has been refined through the years in order to increase its validity and abilities, furthermore it has had various extensions to it in many research papers. However, this study will apply the final version of TAM by Venkatesh and Davis from 1996 as a supportive theory (see figure 2). The TAM has a purpose to explain and predict users’ acceptance or rejection of technological systems. That is accomplished by identifying external
variables that influence the user’s perceived usefulness and perceived ease of use. Those perceptions
will in turn have a direct influence on the user’s behavioral intention leading to either actual usage of the system or a rejection of it (Chuttur, 2009).
The TAM may be useful for this study in order to understand whether the technology behind online food purchasing is an issue for consumers of groceries or not. This will in turn assist in gaining a deeper understanding about consumers' perceptions of online ordering systems of groceries, the
payment methods as well as the ease of, for example returning damaged goods. In addition, this will provide an answer for the research question of this study concerning the factors behind the hesitation of non buyers of online groceries.
The TAM consists of five variables, namely, external variables, perceived ease of use, perceived
usefulness, behavioral intention and the actual usage. External variables are factors that influence an
individual’s perceptions and beliefs --the perceived usefulness and perceived ease of use-- about a certain system. Those external variables could be the characteristics of a system, userparticipation in design, user training and the implementation process’ nature (Chuttur, 2009). As for this study,
external variables will be examined as an independent variable.
Moreover, there are two determinant factors that conclude whether or not a computer system will be accepted by the participant. The two factors are perceived usefulness and perceived ease of use and are both examined as independent variables for this study. As for perceived usefulness, it aims to investigate to what extent an individual believes that utilizing a system will improve job performance. Furthermore, the variable of perceived ease of use aims to investigate to what extent an individual believes using the system will be free of effort (Venkatesh & Davis, 2000).
The individual's behavioral intention to use a system according to the TAM is dependent on the aforementioned beliefs, namely, external variables, perceived usefulness and perceived ease of use. The behavioral intention is therefore defined as the individual's degree of ability to perform or not perform a certain future behavior. In addition, the behavioral intention is the dependent variable that leads the individual to either use or reject the technology. To conclude, the actual usage is the end point that leads individuals to use the technology and is dependent on behavioral intention (Venkatesh & Davis, 2000;Warshaw & Davis, 1985).
Figure 2. The Technology Acceptance Model
4. Methodology
This chapter aims to describe the methodological approach of this paper. In addition, the methods for data collection, analysis as well as reliability and validity will be discussed below.
4.1 Methodological approach
In this research, the authors used a quantitative research design in order to examine the factors that prevent non buyers from buying groceries online in the context of the Swedish consumers of groceries. A deductive approach was undertaken due to the fact that this research used a theory driven approach where the TPB and TAM has been tested through the data gathered from the questionnaire (Saunders et al., 2016). The TPB and TAM are common theories that have been used by other researchers in previous studies in the same field. In addition, both theories emerged and were commonly used in the literature review, which indicated that the chosen theories were suitable for this study (Troise et al., 2020; Saleki et al., 2019; Rasmus & Nielsen, 2005; Driediger & Bhatiasevi, 2019).
In addition, a mono method quantitative approach was used, which means that primary data was collected using a single data collection technique only, namely questionnaires (Saunders et al., 2016). Furthermore, inferential statistics were used in order to make use of the data gathered from the questionnaires and be able to make a generalization over the targeted population (Saunders et al., 2016).
The combination of descriptive and explanatory research formed the research design for this paper, namely, descripto-explanatory. The descriptive statistics that were used are the variables that describe the gathered data in the form of models, tables and figures which were derived from the simple linear regression and the correlation analysis. Thereafter, the descriptive statistics were used as a precursor to form an explanation regarding the relationship between the dependent and independent variables from the two theoretical frameworks (Saunders et al., 2016).
This research is part of a cross-sectional study, due to the fact that the authors aimed to investigate a specific problem area at a specific time. A cross-sectional design was chosen due to the method of investigating the topic of non buyers at a specific time, this allowed for the study to be more representative of the examined population. However, there are limitations of using this design because it only focuses on a specific time frame and is hard for future researchers to replicate (Christensen et al., 2016).
4.2 Methods of data collection
Primary data was gathered by the authors of this paper in order to try to answer the specific research question of this study. That was accomplished by conducting a questionnaire that provided this study with insights regarding Swedish consumers of groceries and the factors behind their hesitation to purchase groceries online. In addition, this study has made use of secondary data in order to form the
introduction of this paper. The secondary sources that were used in this paper include Svenskarna och Internet (2019), Statista (2019) and Eurostat (2021).
4.2.1 Primary data
There are several methods to create primary data, which is data created by the authors themselves, such as semi structured or unstructured interviews, observations and questionnaires (Saunders et al., 2016). For this study, the authors have created a questionnaire in order to collect primary data. The reason for the authors opting for a questionnaire is due to the descripto-explanatory design of the research. The questionnaire was distributed in Sweden, as the purpose of this study was to investigate non buyers of online groceries in a Swedish context. The questionnaire for this research paper was a self completed web based questionnaire where a link was shared to the respondents through different social media platforms that would direct them to the questionnaire. Different platforms included Facebook, Twitter, Instagram and LinkedIn. Furthermore, probability sampling has been used, more specifically simple random sampling which meant that respondents were selected at random and all individuals had an equal chance of being selected.
4.2.2 Construction of questionnaire
The questionnaire was constructed using Google forms. During the process of developing the questions for the questionnaire, the authors made use of the 14 thematic units by Klepek and Bauerová (2020) (See table 1), in addition to several statements developed based on the two chosen theories by the authors themselves. Before starting the questionnaire, the respondents were provided with a short summary about the aim of the study followed up by information regarding the confidentiality of the questionnaire. In order to reduce the level of non external missing response rate, two items were provided as selection questions (Q1 & Q2 in table 2). The first item was ‘Have you purchased groceries online more than twice during the last 12 months?’. This was provided in order to collect data from non buyers only. The second item was ‘Do you live in Sweden?’ This aimed to
eliminate any responses that are not within the targeted population which is people living in Sweden. Besides the selection questions, 24 items in the form of statements were provided in the table below.
Table 1. The thematic units - The most frequent responses in thematic units (Klepek & Bauerová, 2020).
The majority of statements connected to the different variables of the TAM and the TPB were designed using a linear scale, more specifically a 5-point Likert scale where 1 was ‘do not agree at all’ and 5 was ‘completely agree’. This was intended to provide the authors with an understanding of to what extent the respondents agree with each statement in order to be able to answer the research question of this study (Saunders et al., 2016). The remaining statements connected to the TPB and TAM were of a dichotomous design (yes / no questions). The items regarding the demographics of the respondents were designed as multiple choice questions. The questionnaire was designed to not allow respondents to submit the questionnaire unless all questions had been answered, this in order to reduce the level of complete refusal, break off or partial response. The questionnaire was originally constructed in English and thereafter transcribed into Swedish in order to attract more respondents (Saunders et al., 2016).
According to Saunders et al. (2016), questionnaires are often used in descriptive or explanatory research due to the possibility of having standardized questions that all respondents will interpret in the same way. Therefore, the questionnaire consisted of 33 standardized questions including 24 items connected to the theories, 1 item about the respondents’ purchasing frequency, 5 items about demographics, such as gender, age, location, occupation and education as well as 2 selection questions. The two selection questions included; If the respondent had bought groceries online the last 12 months, if the respondent was a resident of Sweden. The last question of the survey was a multiple choice question which aimed to investigate where the respondents had found the questionnaire.
Gender, age, education, occupation and location can be considered to be descriptive (or nominal) data in this study, which is a type of categorical data that is impossible to be placed in ranked order and is categorized based on characteristics (Brown & Saunders, 2008). For this study, the nominal data has been analysed by using a grouping method, where the nominal variables were sectioned together and divided into different categories. The frequency and percentage was then calculated and presented in tables.
In the questionnaire of this study, several items made use of ranked data where respondents had the option to choose from a 5-point Likert scale ranging from completely agree with the statement or do not agree at all. Henceforth, when coding the results, all values from 1-5 had to be labeled. The given label for the variables included; Do not agree at all: 1, Do not agree: 2, Neither agree nor disagree: 3, Agree: 4 and Completely agree: 5
The items that were included as dummy variables were concerning gender, age, education, occupation, location and frequency of grocery shopping. The respondents had the choice of choosing 3 types of genders, namely, female, male and other. Having ‘’other’’ was done in order to reduce the level of discrimination. The labeling of these variables was as following when inserting the data into SPSS; Male: 0, Female: 1 and Other: 2
Age was categorized into 10 year intervals with 5 different categories, which in turn facilitated the process of coding the data. The 5 different categories to choose from were labeled as following; 18-27 (labeled 1), 28-37 (labeled 2), 38-47 (labeled 3), 48-57 (labeled 4) and 58+ (labeled 5).
The education for respondents were divided into 3 categories; high school, university or lower or no education. Lower or No Education was labeled: 0, High School was labeled: 1 and University labeled: 2. For occupation, the respondents were offered 3 different categories; student, working or other. Offering ‘’other’’ was necessary in order to include all respondents such as those that are unemployed, searching for a job or unable to work due to various reasons. The following labels were given to each category; Student labeled: 1, Working labeled: 2 and Other labeled: 3.
As for location, the respondents were offered 5 different cities located in Sweden, namely; Stockholm, Västerås, Örebro, Göteborg, Malmö or other. All cities were not included due to the authors’ choice of categorizing respondents into major cities of Sweden. The alternatives were labeled as the following; Stockholm: 1, Västerås: 2, Örebro: 3, Göteborg: 4, Malmö: 5 and Other: 0
As for the frequency of the respondents' monthly grocery shopping, they were provided 4 different alternatives, namely; 1-3, 4-6, 7-9 or 10-or more times per month. The alternative 1-3 was labeled: 1, 4-6 was labeled: 2, 7-9 was labeled: 3 and the last alternative 10+ was labeled: 4.
For the dichotomous questions of the questionnaire, the authors chose to recode the variables into two separate numerical variables, namely yes: 1 and no: 0. The dichotomous design included selection question 1 and 2 as well as 5 items of the questionnaire. The last question of the questionnaire, which was a multiple choice question, had five alternatives that were coded as follows; Facebook: 1, LinkedIn: 2, Twitter: 3, Instagram: 4 and other: 0. When all strings were coded, the authors could begin to test the data.
4.2.3 Sampling
The target sample size was at least 150 respondents in order to form a representative sample size for this research paper. According to Saunders et al. (2016), a representative sample size needs to be at least 30. The larger the sample size, the more accurate it will be to draw a conclusion based on the population in general. The reason for the choice of a sample size of 150 respondents is in correspondence with the resources available for this research such as time and money (Saunders et al., 2016). As for the age limit of the survey, the authors chose to exclude respondents below the age of 18. The swedish limit for adults by law is set to 18 years of age, which was one of the criterias before sending out the survey (Barnombudsmannen, n.d). Another reason for excluding respondents below the age of 18 was also due to the fact that adults are more likely to purchase groceries. A simple random sampling technique was applied in order to gather data from respondents of different demographic backgrounds. Although the authors targeted a sample size of 150 respondents, only 138 were valid responses out of the total 162. The remaining 24 responses were missing data due to the respondents either being buyers of online groceries or not residents of Sweden.
4.2.4 Operationalization
The study focused on the thematic units that were pointed out in the aforementioned study conducted by Klepek and Bauerová (2020). Therefore, the design of the questionnaire was formed based on the 14 thematic units. The 14 thematic units are a representation of the most frequent answers in the qualitative study conducted by Klepek and Bauerová (2020) and were chosen as a basis for the questionnaire of this research due to the similarity in both studies’ purpose. All 14 thematic units could be found in table 1. In addition to the 14 thematic units, all statements were connected to the TPB and the TAM in order to be able to gain an understanding of each concept. Each independent variable (attitude, perceived behavioral control and subjective norm in TPB and external variables,
perceived ease of use and perceived usefulness in TAM) of the chosen theories was connected to three
items in the questionnaire, while the dependent variables (intention in TPB and behavioral intention in TAM) were also connected to three items each (see figure 1 and 2). The reason for choosing three items was based on the literature that was reviewed, as most previous research had an average of three items for each concept. The choice of not including items connected to the behavior variable of the TPB and the actual usage variable of the TAM in the questionnaire, was due to those variables being dependent on the data gathered from the questionnaire and therefore, hard to measure. Thus, the authors chose to draw a conclusion regarding the two variables based on the findings of the questionnaire.
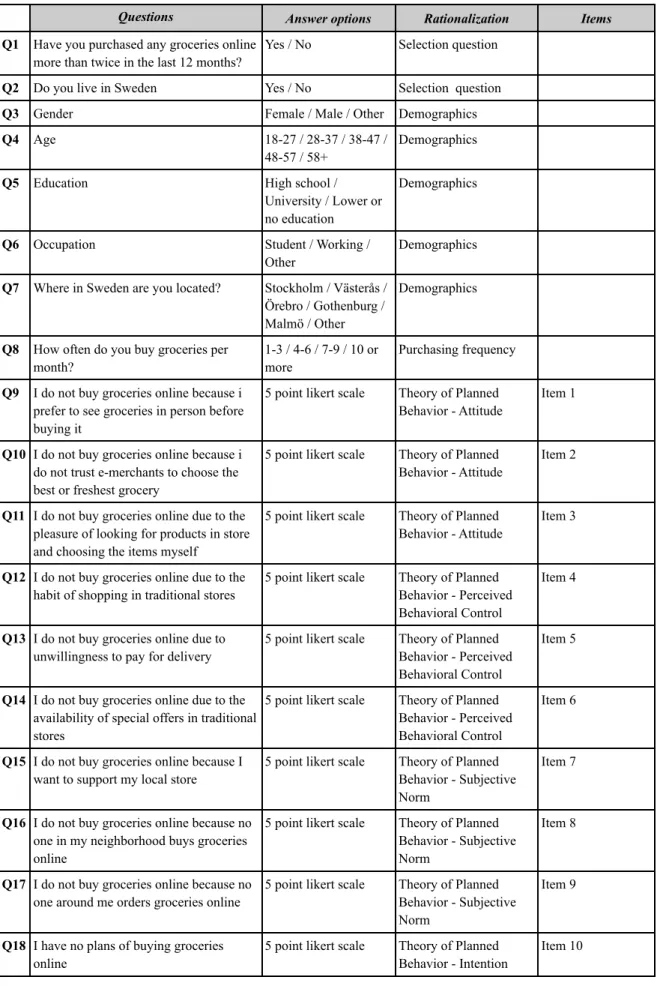
The table below will illustrate the different concepts connected to the specific items included in the questionnaire. In addition, the items have been rationalized in order to understand the connection between the concept and the item.
Table 2. Questionnaire and operationalization of questions
Questions Answer options Rationalization Items Q1 Have you purchased any groceries online
more than twice in the last 12 months?
Yes / No Selection question Q2 Do you live in Sweden Yes / No Selection question
Q3 Gender Female / Male / Other Demographics
Q4 Age 18-27 / 28-37 / 38-47 /
48-57 / 58+
Demographics
Q5 Education High school /
University / Lower or no education
Demographics
Q6 Occupation Student / Working /
Other
Demographics Q7 Where in Sweden are you located? Stockholm / Västerås /
Örebro / Gothenburg / Malmö / Other
Demographics
Q8 How often do you buy groceries per month?
1-3 / 4-6 / 7-9 / 10 or more
Purchasing frequency Q9 I do not buy groceries online because i
prefer to see groceries in person before buying it
5 point likert scale Theory of Planned Behavior - Attitude
Item 1
Q10 I do not buy groceries online because i do not trust e-merchants to choose the best or freshest grocery
5 point likert scale Theory of Planned Behavior - Attitude
Item 2
Q11 I do not buy groceries online due to the pleasure of looking for products in store and choosing the items myself
5 point likert scale Theory of Planned Behavior - Attitude
Item 3
Q12 I do not buy groceries online due to the habit of shopping in traditional stores
5 point likert scale Theory of Planned Behavior - Perceived Behavioral Control
Item 4
Q13 I do not buy groceries online due to unwillingness to pay for delivery
5 point likert scale Theory of Planned Behavior - Perceived Behavioral Control
Item 5
Q14 I do not buy groceries online due to the availability of special offers in traditional stores
5 point likert scale Theory of Planned Behavior - Perceived Behavioral Control
Item 6
Q15 I do not buy groceries online because I want to support my local store
5 point likert scale Theory of Planned Behavior - Subjective Norm
Item 7
Q16 I do not buy groceries online because no one in my neighborhood buys groceries online
5 point likert scale Theory of Planned Behavior - Subjective Norm
Item 8
Q17 I do not buy groceries online because no one around me orders groceries online
5 point likert scale Theory of Planned Behavior - Subjective Norm
Item 9
Q18 I have no plans of buying groceries online
5 point likert scale Theory of Planned Behavior - Intention
Q19 I would consider buying groceries online if the delivery fee was removed
Yes / No Theory of Planned Behavior - Intention
Item 11 Q20 I would consider buying groceries online
if the range of offers/campaigns were similar to the traditional store
Yes / No Theory of Planned Behavior - Intention
Item 12
Q21 I do not buy groceries online because the actual process of buying online feels complicated
5 point likert scale Technology Acceptance Model - External Variables
Item 13
Q22 I do not buy groceries online because it is difficult to navigate through the website
5 point likert scale Technology Acceptance Model - External Variables
Item 14
Q23 I do not buy groceries online because the payment methods are complicated
5 point likert scale Technology Acceptance Model - External Variables
Item 15
Q24 I do not buy groceries online due to complications of returning orders
5 point likert scale Technology Acceptance Model - Perceived Ease of Use
Item 16
Q25 I do not buy groceries online because the process of correcting the receipt and file a complaint feels complicated
5 point likert scale Technology Acceptance Model - Perceived Ease of Use
Item 17
Q26 I do not buy groceries online due to easy accessibility to buy groceries near my residence
5 point likert scale Technology Acceptance Model - Perceived Ease of Use
Item 18
Q27 I do not buy groceries online due to faster in-store grocery shopping
5 point likert scale Technology Acceptance Model - Perceived Usefulness
Item 19
Q28 I do not buy groceries online due to the larger options of various items in traditional stores
5 point likert scale Technology Acceptance Model - Perceived Usefulness
Item 20
Q29 I do not buy groceries online because I buy groceries when I need them without missing out on 1 or 2 day time gap
5 point likert scale Technology Acceptance Model - Perceived Usefulness
Item 21
Q30
I have a negative perception about using online grocery services
Yes / No Technology Acceptance Model - Behavioral Intention
Item 22
Q31 I would consider using online grocery services if the payment process is simplified
Yes / No Technology Acceptance Model - Behavioral Intention
Item 23
Q32 I would consider purchasing groceries online if there was a reduced risk of leaving digital footprints e.g. wanting to be anonymous
Yes / No Technology Acceptance Model - Behavioral Intention
Item 24
Q33 Where did you find the questionnaire? Facebook / LinkedIn / Twitter / Instagram / Other
4.2.5 Secondary data
Information can be gathered using secondary sources, which refers to the data that is available and has been collected from government publications as well as industry statistics and reports (Saunders et al,. 2016). Sources such as Eurostat and statista were used in the introduction in order to describe the industry whereas the United Nations was used in order to define the Swedish market in general. In addition, Svenskarna och internet was used in order to define internet accessibility of the Swedish population. Such usage of secondary data has increased and strengthened the possibility to provide more reliable results, along with the use of primary data (Saunders et al,. 2016).
4.3 Process of literature review
The usage of previous literature was beneficial for this study in terms of exploring previous articles and literature leading up to the chosen topic of this research. Previous articles were carefully reviewed and analyzed in order to gain an understanding of the chosen topic and the gaps in already existing articles. The same process was carried out during the selection of relevant and suitable theories for the purpose of this study. The literature search has been conducted by using the search engine Google Scholar and the database ABI/INFORM GLOBAL. The keywords that were used when conducting the literature review included words such as; Retail, online purchasing, grocery shopping, E-grocery, online grocery, consumer behavior, E-commerce, cost efficiency, non buyers, theory of planned behavior and technology acceptance model.
4.4 Method of analysis
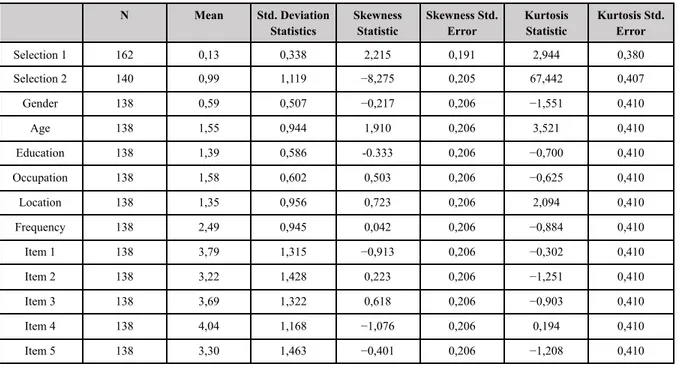
The method of analysis for this paper was carried out by conducting a simple linear regression and in turn highlighting the significant factors behind non buyers’ hesitation to buy groceries online. The authors began to apply a Cronbach reliability test for the questionnaire in order to examine how closely related all items for each variable were to each other. In addition, a descriptive table was constructed in order to detect if any items in the questionnaire had a high or low level of kurtosis and
skewness. As for the main analysis, the authors have chosen to apply a simple linear regression analysis method by analyzing the independent variables individually and in turn detect if there were any factors that could explain why non buyers hesitate to buy groceries online. The results from the significance level and R squared (R²) for the simple linear regression combined with the Pearson correlation results may in turn determine which factors are behind the non buyers’ hesitation.
Before conducting the main analysis which was the simple linear regression analysis, the authors began to test the normality of the distribution, namely the skewness and kurtosis. Skewness was analyzed in order to detect if the items were within reasonable symmetry, whereas kurtosis was analyzed in order to detect if the tails were within reasonable limits. According to Brown (1997) values of skewness above ±3 are beyond the critical limits and therefore highly skewed. As for this data set, selection question 2 was not within the critical limit. Selection question 2 regarding the residence of the respondents had a highly negative skewness of -8.275. As for the kurtosis of the questionnaire, According to Brown (1997), a reasonable kurtosis level should be within ±10. The datasets that had a high degree of kurtosis was the item regarding residence (selection 2) which amounted to 67.44.
Table 3. The Descriptive Statistics
N Mean Std. Deviation Statistics Skewness Statistic Skewness Std. Error Kurtosis Statistic Kurtosis Std. Error Selection 1 162 0,13 0,338 2,215 0,191 2,944 0,380 Selection 2 140 0,99 1,119 −8,275 0,205 67,442 0,407 Gender 138 0,59 0,507 −0,217 0,206 −1,551 0,410 Age 138 1,55 0,944 1,910 0,206 3,521 0,410 Education 138 1,39 0,586 -0.333 0,206 −0,700 0,410 Occupation 138 1,58 0,602 0,503 0,206 −0,625 0,410 Location 138 1,35 0,956 0,723 0,206 2,094 0,410 Frequency 138 2,49 0,945 0,042 0,206 −0,884 0,410 Item 1 138 3,79 1,315 −0,913 0,206 −0,302 0,410 Item 2 138 3,22 1,428 0,223 0,206 −1,251 0,410 Item 3 138 3,69 1,322 0,618 0,206 −0,903 0,410 Item 4 138 4,04 1,168 −1,076 0,206 0,194 0,410
Item 6 138 2,99 1,430 −0,111 0,206 −1,312 0,410 Item 7 138 2,49 1,389 0,421 0,206 −1,078 0,410 Item 8 138 1,73 1,205 1,496 0,206 0,999 0,410 Item 9 138 2,11 1,376 0,962 0,206 −0,361 0,410 Item 10 138 3,36 1,383 −0,239 0,206 −1,208 0,410 Item 11 138 0,67 0,470 −0,750 0,206 −1,459 0,410 Item 12 138 0,64 0,482 −0,579 0,206 −1,689 0,410 Item 13 138 2,59 1,376 0,319 0,206 −1,190 0,410 Item 14 138 2,25 1,255 0,602 0,206 −0,817 0,410 Item 15 138 1,86 1,203 1,264 0,206 0,490 0,410 Item 16 138 3,00 1,409 −0,111 0,206 −1,264 0,410 Item 17 138 2,74 1,549 0,171 0,206 −1,518 0,410 Item 18 138 4,31 0,995 −1,429 0,206 1,459 0,410 Item 19 138 4,33 0,977 −1,573 0,206 2,038 0,410 Item 20 138 4,38 1,347 −0,440 0,206 −0,888 0,410 Item 21 138 3,38 1,313 −0,629 0,206 −0,659 0,410 Item 22 138 3,56 0,419 1,334 0,206 −0,224 0,410 Item 23 138 0,22 0,473 0,715 0,206 −1,511 0,410 Item 24 138 0,33 0,459 0,898 0,206 −1,212 0,410 Selection 3 138 1,10 0,776 1,246 0,206 2,704 0,410
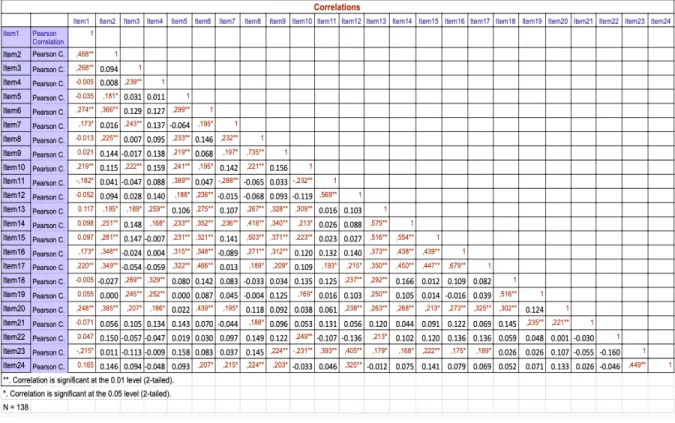
In order to measure the internal consistency of the items in the questionnaire, the authors conducted a reliability test for the entire instrument as well as for each framework individually. The testing of Cronbach’s alpha for the entire instrument resulted in an internal consistency of 0.81, which indicated that the items were reliable and closely related. In addition, the testing of Cronbach’s alpha for the TPB resulted in an internal consistency of 0.65, which indicated a moderate reliability for the TPB items as a group. The testing of Cronbach’s alpha for the TAM resulted in an internal consistency of 0.75, which indicated good reliability for the TAM items as a group (Taber, 2018). Pearson correlation test was conducted in order to investigate the strength of association between the items as well as the variables. The variables that were significantly correlating with a significance at the 0.01 or 0.05 level were analyzed in order to determine if there were any additional factors that could strengthen the results from the simple linear regression.
Descriptive statistics was used in order to form the descriptive tables, which included the mean and standard deviation for the demographics, selection questions and items. By analyzing the mean, the authors could draw a conclusion whether the respondents were in agreement with the statements or not. In turn, this was combined with the results from the correlation and simple linear regression analysis in order to form a conclusion.
The next step was to compute the items into 8 different composite variables and conduct the simple linear regression. The composite variables for the TPB were labeled into SPSS as following; depv (intention), attitude, PBC and SN. As for the TAM, the composite variables were labeled into SPSS as following; TAMdep (behavioral intention), EV, PEU and PU. This was done in order to combine the 3 items for each variable into one composite variable.
Simple linear regression analysis was conducted between the constructed variables of each dependent variable with the independent variable of the two frameworks in order to analyze the coefficient of determination R² for the dependent variable in relation to each independent variable. R² defines the proportion of association between the dependent variable toward the independent variable. The authors calculated the significance of the dependent variable in relation with the independent variable by inserting the variables into SPSS individually. The reason for choosing a simple linear regression analysis was due to the authors’ methodological approach of examining the factors behind non buyers’ hesitation. By gathering data for each independent variable, the authors could draw a conclusion based on the significance level and R² individually. This may not have been possible if the authors would have conducted a multiple regression analysis, as the results would have offered only one R² value for each framework.
The dependent variable for the TPB was Intention, which was tested in relation to the independent variables; attitude, subjective norm and perceived behavioral control. As for the TAM, the dependent variable was behavioral intention, which was tested in relation to the independent variables; external
were then further analyzed in combination with descriptive statistics, correlations and the simple linear regression analysis in order to draw a conclusion regarding the behavior of non buyers of online groceries.
4.5 Reliability
In order to strengthen the reliability of this paper, the authors chose a less sensitive time for data collection, by sending out the questionnaire in the middle of the week in order to avoid participant error. In addition, the survey was open during a week's time, in order to offer the respondents a time that suited their schedule and in turn reduce low engagement from the respondents. For the purpose of reducing participant bias, the authors chose to design the questionnaire with anonymized participation, which was clarified in the survey disclaimer as well as right before the first question of the survey. These measures were taken into consideration when conducting the data collection and thereby strengthened the reliability of the research. Saunders et al. (2016) describes reliability as to whether the gathered data collection techniques and analytic procedures would create consistent findings if they were to be repeated or replicated by other researchers. In addition, the questions in the questionnaire are not of a sensitive nature. Due to the methodological approach that was chosen to be used in this study, there is a less chance of personal interpretations by the authors. One reason for this is that the study is of a quantitative nature, where the items will be presented in frequencies and therefore it will be difficult for the researcher to make subjective interpretations of the results. This in turn reduced researcher bias.
Internal consistency could be further increased by conducting the survey multiple times, however the authors chose to disregard it due to limited resources such as the restricted time frame. The procedure was also described in detail and the authors have worked in a fully transparent manner in order to make it possible for others to replicate the study. Even though good reliability is a criteria for good quality research, it is not enough to ensure the quality by itself without various types of validity precautions.
Receiving missing data has been taken into consideration before conducting the questionnaire. The authors expected a certain degree of missing data due to the two selection questions in the beginning of the questionnaire, where respondents were not able to complete the survey if they did not belong to the targeted population, namely non buyers of online groceries that live in Sweden and therefore resulting in missing data.
4.6 Validity
In order to establish internal validity, items from the questionnaire are connected to concepts from the chosen theories. However, there were several threats to internal validity, which the authors have tried to take into consideration when conducting this study. The authors did not change the instrument during the process of data collection, nor did they have any influence over the respondents’ attitudes, behaviors or response options. There were no future consequences for the respondents from the response options, which means that the respondents could answer the questions from the questionnaire freely without fear of expressing their views or attitudes. However, it was difficult to draw any causal relationships, because this study was not a true experiment or conducted in a fixed environment. In addition, the content validity could have been increased by conducting a pilot test survey, however this was not implemented due to limited resources.
It is also important to highlight to what extent this study's outcome could be generalized to other settings or groups, which is a measurement for external validity. Selection of samples is an important criteria for external validity. The sample may not be representative of the general population since the sample size of the gathered data may be insufficient.
5. Analysis and findings
This chapter aims to showcase the findings of the analysis. The demographics will be discussed followed by the items of the questionnaire. Furthermore, the correlation table will be discussed where the authors highlight the significance relationship between various items. In addition, the results from the simple linear regression analysis are presented with models in order to facilitate the interpretation.
5.1 Selection and multiple choice questions
The findings show that out of the total number of 162 participants, only 138 were valid. The first selection question indicated that 140 respondents which corresponds to 86.4% had not bought groceries online more than twice the last 12 months, whereas 22 had done so and were therefore not eligible to fill out the questionnaire.
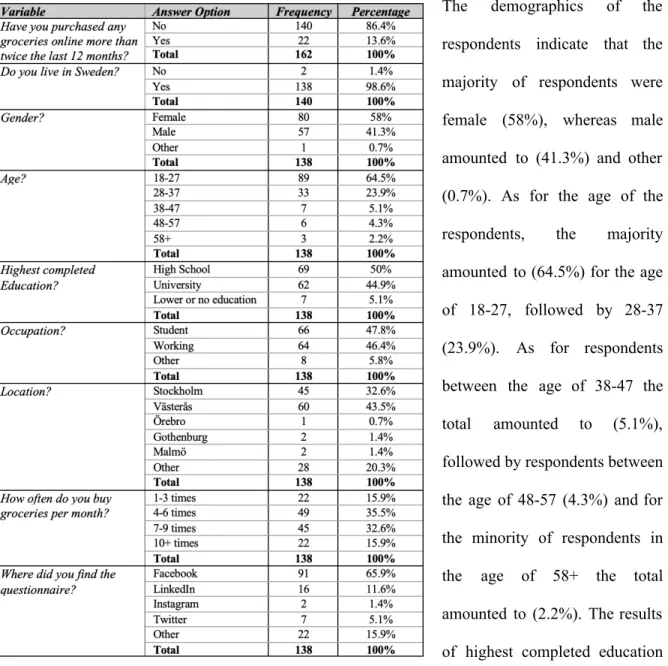
As for selection question 2, 138 respondents did live in Sweden and were therefore allowed to complete the questionnaire, while 2 participants did not live in Sweden and were not able to complete it. Out of the two selection questions, the researchers gathered valid data from a total of 138 respondents and a total of 24 responses were counted as missing data. The questionnaire was concluded with a multiple choice question which was ‘Where did you find the questionnaire?’. The results show that the majority of the respondents had found the questionnaire on Facebook and amounted to 91 respondents (65.9%) followed by “Other” with 22 respondents (15.9%), LinkedIn with 16 respondents (11.6%), Twitter with 7 respondents (5.1%) and Instagram with 2 respondents (1.4%).
5.2 Demographics
Table 4. Presentation of respondents
The demographics of the
respondents indicate that the majority of respondents were female (58%), whereas male amounted to (41.3%) and other (0.7%). As for the age of the respondents, the majority amounted to (64.5%) for the age of 18-27, followed by 28-37 (23.9%). As for respondents between the age of 38-47 the total amounted to (5.1%), followed by respondents between the age of 48-57 (4.3%) and for the minority of respondents in
the age of 58+ the total
amounted to (2.2%). The results of highest completed education of the respondents show that high school respondents were the majority and had a percentage of (50%), followed by university students that amounted to (44.9%). The minority of respondents with lower or no education amounted to (5.1%). As for the occupation of the respondents, the result did not vary significantly. The majority of the respondents were students and amounted to (47.8%), followed by working respondents that amounted to (46.4%). The minority of respondents were respondents that chose to submit “other” which amounted to (5.8%).