ScienceDirect
Available online at www.sciencedirect.com
Procedia Manufacturing 35 (2019) 252–258
2351-9789 © 2019 The Authors. Published by Elsevier B.V.
Peer-review under responsibility of the organizing committee of SMPM 2019. 10.1016/j.promfg.2019.05.036
10.1016/j.promfg.2019.05.036 2351-9789
© 2019 The Authors. Published by Elsevier B.V.
Peer-review under responsibility of the organizing committee of SMPM 2019. Available online at www.sciencedirect.com
ScienceDirect
Procedia Manufacturing 00 (2019) 000–000
www.elsevier.com/locate/procedia
2351-9789 © 2016 The Authors. Published by Elsevier B.V.
Peer-review under responsibility of the organizing committee of SMPM 2019.
2nd International Conference on Sustainable Materials Processing and Manufacturing
(SMPM 2019)
Modelling additive manufacturing of superalloys
Lars-Erik Lindgren
a*, Andreas Lundbäck
a, Martin Fisk
b, Joar Draxler
a aLuleå University of Technology, 971 87 Luleå, SwedenbMalmö University, 205 06 Malmö, Sweden
Abstract
There exist several variants of Additive Manufacturing (AM) applicable for metals and alloys. The two main groups are Directed Energy Deposition (DED) and Powder Bed Fusion (PBF). AM has advantages and disadvantages when compared to more traditional manufacturing methods. The best candidate products are those with complex shape and small series and particularly individualized product. Repair welding is often individualized as defects may occur at various instances in a component. This method was used before it became categorized as AM and in most cases, it is a DED process. PBF processes are more useful for smaller items and can give a finer surface. Both DED and PBF products require subsequent surface finishing for high performance components and sometimes there is also a need for post heat treatment. Modelling of AM as well as eventual post-processes can be of use in order to improve product quality, reducing costs and material waste. The paper describes the use of the finite element method to simulate these processes with focus on superalloys.
© 2019 The Authors. Published by Elsevier B.V.
Peer-review under responsibility of the organizing committee of SMPM 2019.
Keywords: Additive manufacturing; Simulation; Superalloys; Quality
* Corresponding author. Tel.: +46(0)920-491-306.
E-mail address: lars-erik.lindgren@ltu.se
Available online at www.sciencedirect.com
ScienceDirect
Procedia Manufacturing 00 (2019) 000–000
www.elsevier.com/locate/procedia
2351-9789 © 2016 The Authors. Published by Elsevier B.V.
Peer-review under responsibility of the organizing committee of SMPM 2019.
2nd International Conference on Sustainable Materials Processing and Manufacturing
(SMPM 2019)
Modelling additive manufacturing of superalloys
Lars-Erik Lindgren
a*, Andreas Lundbäck
a, Martin Fisk
b, Joar Draxler
a aLuleå University of Technology, 971 87 Luleå, SwedenbMalmö University, 205 06 Malmö, Sweden
Abstract
There exist several variants of Additive Manufacturing (AM) applicable for metals and alloys. The two main groups are Directed Energy Deposition (DED) and Powder Bed Fusion (PBF). AM has advantages and disadvantages when compared to more traditional manufacturing methods. The best candidate products are those with complex shape and small series and particularly individualized product. Repair welding is often individualized as defects may occur at various instances in a component. This method was used before it became categorized as AM and in most cases, it is a DED process. PBF processes are more useful for smaller items and can give a finer surface. Both DED and PBF products require subsequent surface finishing for high performance components and sometimes there is also a need for post heat treatment. Modelling of AM as well as eventual post-processes can be of use in order to improve product quality, reducing costs and material waste. The paper describes the use of the finite element method to simulate these processes with focus on superalloys.
© 2019 The Authors. Published by Elsevier B.V.
Peer-review under responsibility of the organizing committee of SMPM 2019.
Keywords: Additive manufacturing; Simulation; Superalloys; Quality
* Corresponding author. Tel.: +46(0)920-491-306.
E-mail address: lars-erik.lindgren@ltu.se
2 Lars-Erik Lindgren et al./ Procedia Manufacturing 00 (2016) 000–000
1. Introduction
There is an intensive development of various modelling approaches for designing AM of metals and alloys for high-performance applications. When applicable, the AM process can reduce costs as well as material waste. However, there are several challenges when applying the process to high-performance components. The quality of these components requires both a shape within tolerances as well as an ascertained life of the component. The basic quality indicators that determine these aspects are deformations, stresses, microstructure and defect structure. There is often a need to post-process after AM in order to achieve better microstructure and/or surface.
The paper illustrates the current state of art with respect to modelling AM where these quality indicators can be determined. The same type of models can also be used to simulate other manufacturing processes. The case of repair welding and post heat treatment is shown for Alloy 718 using a DED method. The simulation includes a model for microstructure evolution, i.e. precipitate growth during ageing. Furthermore, a case of AM of Alloy 625 using the PBF process is simulated focussing on the deflection after cutting the built structure from the support plate. How to predict the defect structure is still beyond state of art and thus there are not much of established models available. Our first developments of a metallurgical based model for hot cracking of Alloy 718 is shown as an example of prediction of defect structure, or rather risk of crack initiation.
Nomenclature
FEM Finite Element Method
AM Additive Manufacturing
DED Directed Energy Deposition
PBF Powder Bed Fusion
GBLF Grain Boundary Liquid Film
2. Simulation of additive manufacturing
2.1. Repair welding of Alloy 718
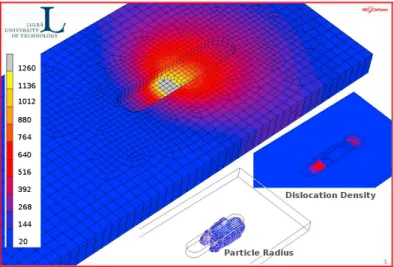
Alloy 718 is a superalloy that has attracted considerable amount of research related to AM. Most published work is experimental leading to increased understanding as well as quantitative information for use in design as well as for modelling. There are some publications of thermal analyses of AM, e.g. [1-3], whereas coupled thermo-mechanical models are not common, see [4-7]. The AM case below also includes a precipitate model coupled to flow stress. The model of the repair welding of Alloy 718 can be seen in Fig. 1. Gas Tungsten Metal Arc Welding (GTAW) was used and the filler material was added by wire. A groove is milled where a defect or crack is found and then this groove is filled using wire as filler material. However, this material is in an annealed state whereas the rest of the material is aged.
Lars-Erik Lindgren et al. / Procedia Manufacturing 35 (2019) 252–258 253
ScienceDirect
Procedia Manufacturing 00 (2019) 000–000
www.elsevier.com/locate/procedia
2351-9789 © 2016 The Authors. Published by Elsevier B.V.
Peer-review under responsibility of the organizing committee of SMPM 2019.
2nd International Conference on Sustainable Materials Processing and Manufacturing
(SMPM 2019)
Modelling additive manufacturing of superalloys
Lars-Erik Lindgren
a*, Andreas Lundbäck
a, Martin Fisk
b, Joar Draxler
a aLuleå University of Technology, 971 87 Luleå, SwedenbMalmö University, 205 06 Malmö, Sweden
Abstract
There exist several variants of Additive Manufacturing (AM) applicable for metals and alloys. The two main groups are Directed Energy Deposition (DED) and Powder Bed Fusion (PBF). AM has advantages and disadvantages when compared to more traditional manufacturing methods. The best candidate products are those with complex shape and small series and particularly individualized product. Repair welding is often individualized as defects may occur at various instances in a component. This method was used before it became categorized as AM and in most cases, it is a DED process. PBF processes are more useful for smaller items and can give a finer surface. Both DED and PBF products require subsequent surface finishing for high performance components and sometimes there is also a need for post heat treatment. Modelling of AM as well as eventual post-processes can be of use in order to improve product quality, reducing costs and material waste. The paper describes the use of the finite element method to simulate these processes with focus on superalloys.
© 2019 The Authors. Published by Elsevier B.V.
Peer-review under responsibility of the organizing committee of SMPM 2019.
Keywords: Additive manufacturing; Simulation; Superalloys; Quality
* Corresponding author. Tel.: +46(0)920-491-306.
E-mail address: lars-erik.lindgren@ltu.se
Available online at www.sciencedirect.com
ScienceDirect
Procedia Manufacturing 00 (2019) 000–000
www.elsevier.com/locate/procedia
2351-9789 © 2016 The Authors. Published by Elsevier B.V.
Peer-review under responsibility of the organizing committee of SMPM 2019.
2nd International Conference on Sustainable Materials Processing and Manufacturing
(SMPM 2019)
Modelling additive manufacturing of superalloys
Lars-Erik Lindgren
a*, Andreas Lundbäck
a, Martin Fisk
b, Joar Draxler
a aLuleå University of Technology, 971 87 Luleå, SwedenbMalmö University, 205 06 Malmö, Sweden
Abstract
There exist several variants of Additive Manufacturing (AM) applicable for metals and alloys. The two main groups are Directed Energy Deposition (DED) and Powder Bed Fusion (PBF). AM has advantages and disadvantages when compared to more traditional manufacturing methods. The best candidate products are those with complex shape and small series and particularly individualized product. Repair welding is often individualized as defects may occur at various instances in a component. This method was used before it became categorized as AM and in most cases, it is a DED process. PBF processes are more useful for smaller items and can give a finer surface. Both DED and PBF products require subsequent surface finishing for high performance components and sometimes there is also a need for post heat treatment. Modelling of AM as well as eventual post-processes can be of use in order to improve product quality, reducing costs and material waste. The paper describes the use of the finite element method to simulate these processes with focus on superalloys.
© 2019 The Authors. Published by Elsevier B.V.
Peer-review under responsibility of the organizing committee of SMPM 2019.
Keywords: Additive manufacturing; Simulation; Superalloys; Quality
* Corresponding author. Tel.: +46(0)920-491-306.
E-mail address: lars-erik.lindgren@ltu.se
2 Lars-Erik Lindgren et al./ Procedia Manufacturing 00 (2016) 000–000
1. Introduction
There is an intensive development of various modelling approaches for designing AM of metals and alloys for high-performance applications. When applicable, the AM process can reduce costs as well as material waste. However, there are several challenges when applying the process to high-performance components. The quality of these components requires both a shape within tolerances as well as an ascertained life of the component. The basic quality indicators that determine these aspects are deformations, stresses, microstructure and defect structure. There is often a need to post-process after AM in order to achieve better microstructure and/or surface.
The paper illustrates the current state of art with respect to modelling AM where these quality indicators can be determined. The same type of models can also be used to simulate other manufacturing processes. The case of repair welding and post heat treatment is shown for Alloy 718 using a DED method. The simulation includes a model for microstructure evolution, i.e. precipitate growth during ageing. Furthermore, a case of AM of Alloy 625 using the PBF process is simulated focussing on the deflection after cutting the built structure from the support plate. How to predict the defect structure is still beyond state of art and thus there are not much of established models available. Our first developments of a metallurgical based model for hot cracking of Alloy 718 is shown as an example of prediction of defect structure, or rather risk of crack initiation.
Nomenclature
FEM Finite Element Method
AM Additive Manufacturing
DED Directed Energy Deposition
PBF Powder Bed Fusion
GBLF Grain Boundary Liquid Film
2. Simulation of additive manufacturing
2.1. Repair welding of Alloy 718
Alloy 718 is a superalloy that has attracted considerable amount of research related to AM. Most published work is experimental leading to increased understanding as well as quantitative information for use in design as well as for modelling. There are some publications of thermal analyses of AM, e.g. [1-3], whereas coupled thermo-mechanical models are not common, see [4-7]. The AM case below also includes a precipitate model coupled to flow stress. The model of the repair welding of Alloy 718 can be seen in Fig. 1. Gas Tungsten Metal Arc Welding (GTAW) was used and the filler material was added by wire. A groove is milled where a defect or crack is found and then this groove is filled using wire as filler material. However, this material is in an annealed state whereas the rest of the material is aged.
254 Lars-Erik Lindgren et al. / Procedia Manufacturing 35 (2019) 252–258
Lars-Erik Lindgren et al./ Procedia Manufacturing 00 (2016) 000–000 3
Fig. 1. State during repair welding of Alloy 718 showing von Mises effective stress, dislocation density and precipitate size.
Thus a local heat treatment using induction heating, see Fig. 2, is used to perform the ageing of the added material. The coil with flux concentrators is sketched to left in Fig. 2. The coil is further away from the plate nearer its lower edge in order to achieve a more uniform temperature field. The obtained peak temperature distribution is shown. The current through the coil is controlled in order to give a wanted temperature history for about 12 hours in the weld region. The material modelling includes a microstructure model for the evolution of precipitates coupled to a flow stress model. The material has a low yield strength and creep resistance at start of ageing and it becomes more creep resistant during the process when the precipitates grow, see [8-10] for details. The model provides deformations, stresses and microstructure (i.e. precipitate sizes) after AM and also after ageing. The computed final stress state after local heat treatment, shown here, as well as a global heat treatment in a furnace were compared and it was found that the local approach worked equal well [11]. This would make the repair approach much cheaper when repair welding has to be made on a large aeroengine component.
Fig. 2. (a) Set up of induction heating for ageing; (b) State during induction heating for ageing of Alloy 718 showing temperature field when the current maximum temperature is about 450°C.
2.2. Powder bed fusion of Alloy 625
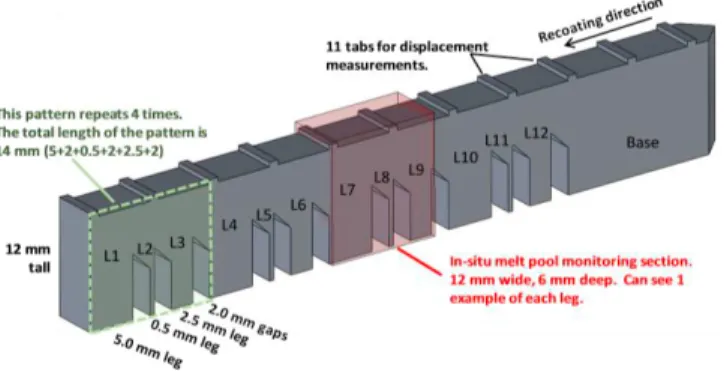
A case of AM of Alloy 625 was simulated by Denlinger et al. [12]. Alloy 625 was also included in the AM-bench tests set up by National Institute of Standards (US) (www.nist.gov/ambench/challenges-and-descriptions) lead by Dr Levine. The bridge-like structure shown in Fig. 3 is one of the AM-bench tests. It is built using a laser PBF machine and consists of 600 layers. The mean powder size is about 30 m and the effective thickness of each layer is about 20 m. The deformation of the bridge due to cutting the structure from the build plate has been measured and
4 Lars-Erik Lindgren et al./ Procedia Manufacturing 00 (2016) 000–000
computed. The measured and computed deflections are shown in the diagram in Fig. 4. The enormous amount of layers requires a simplification in the simulation. They were merged into 25 layers and each layer was heated instantaneously. This is one of the reasons why the computed deformations are larger than the measured. Each layer in the model will be stronger relative to the structure and cause larger residual stresses released when cutting the bridge from the build plate.
Fig. 3. Geometry of the AMB2018-01 bridge structure.
0 10 20 30 40 50 60 70 80 X [mm] 0 0.2 0.4 0.6 0.8 1 1.2 1.4 1.6 1.8 2 U pw ar d de fle ct io n [m m ] AMB2018-01-PD Measurement Simulation - 25 layers
Fig. 4. Computed and measured deflections after cutting bridge.
3. Hot cracking of Alloy 718
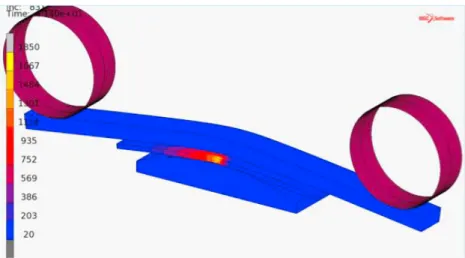
Draxler et al. [13] developed a hot crack initiation criterion based on frozen in pores in the liquid film between grain boundaries during solidification. The model post-processes results from FE simulations of welding in order to estimate the risk for defect initiation. Varestraint tests, see Fig. 5, are used to calibrate as well as validate the model. A plate is placed on a support roll with a given radius and held in place with another plate along its outer edges. A roll in each end loads this plate. These rolls are pushed down at a given rate when the weld reaches middle of the plate, which is at the top of the support roll. Fig. 5 shows the instant when this loading starts. Then there will be an additional straining in the weld region. The plate is thereafter investigated with respect to cracks. Their locations and sizes are recorded. Several measurements are performed with varying radius giving an increasing deformation of the weld region. The model has two calibration parameters that are determined from the loading case for which no crack appears and then the cases with larger deformations are used for validation.
Fig. 1. State during repair welding of Alloy 718 showing von Mises effective stress, dislocation density and precipitate size.
Thus a local heat treatment using induction heating, see Fig. 2, is used to perform the ageing of the added material. The coil with flux concentrators is sketched to left in Fig. 2. The coil is further away from the plate nearer its lower edge in order to achieve a more uniform temperature field. The obtained peak temperature distribution is shown. The current through the coil is controlled in order to give a wanted temperature history for about 12 hours in the weld region. The material modelling includes a microstructure model for the evolution of precipitates coupled to a flow stress model. The material has a low yield strength and creep resistance at start of ageing and it becomes more creep resistant during the process when the precipitates grow, see [8-10] for details. The model provides deformations, stresses and microstructure (i.e. precipitate sizes) after AM and also after ageing. The computed final stress state after local heat treatment, shown here, as well as a global heat treatment in a furnace were compared and it was found that the local approach worked equal well [11]. This would make the repair approach much cheaper when repair welding has to be made on a large aeroengine component.
Fig. 2. (a) Set up of induction heating for ageing; (b) State during induction heating for ageing of Alloy 718 showing temperature field when the current maximum temperature is about 450°C.
2.2. Powder bed fusion of Alloy 625
A case of AM of Alloy 625 was simulated by Denlinger et al. [12]. Alloy 625 was also included in the AM-bench tests set up by National Institute of Standards (US) (www.nist.gov/ambench/challenges-and-descriptions) lead by Dr Levine. The bridge-like structure shown in Fig. 3 is one of the AM-bench tests. It is built using a laser PBF machine and consists of 600 layers. The mean powder size is about 30 m and the effective thickness of each layer is about 20 m. The deformation of the bridge due to cutting the structure from the build plate has been measured and
computed. The measured and computed deflections are shown in the diagram in Fig. 4. The enormous amount of layers requires a simplification in the simulation. They were merged into 25 layers and each layer was heated instantaneously. This is one of the reasons why the computed deformations are larger than the measured. Each layer in the model will be stronger relative to the structure and cause larger residual stresses released when cutting the bridge from the build plate.
Fig. 3. Geometry of the AMB2018-01 bridge structure.
0 10 20 30 40 50 60 70 80 X [mm] 0 0.2 0.4 0.6 0.8 1 1.2 1.4 1.6 1.8 2 U pw ar d de fle ct io n [m m ] AMB2018-01-PD Measurement Simulation - 25 layers
Fig. 4. Computed and measured deflections after cutting bridge.
3. Hot cracking of Alloy 718
Draxler et al. [13] developed a hot crack initiation criterion based on frozen in pores in the liquid film between grain boundaries during solidification. The model post-processes results from FE simulations of welding in order to estimate the risk for defect initiation. Varestraint tests, see Fig. 5, are used to calibrate as well as validate the model. A plate is placed on a support roll with a given radius and held in place with another plate along its outer edges. A roll in each end loads this plate. These rolls are pushed down at a given rate when the weld reaches middle of the plate, which is at the top of the support roll. Fig. 5 shows the instant when this loading starts. Then there will be an additional straining in the weld region. The plate is thereafter investigated with respect to cracks. Their locations and sizes are recorded. Several measurements are performed with varying radius giving an increasing deformation of the weld region. The model has two calibration parameters that are determined from the loading case for which no crack appears and then the cases with larger deformations are used for validation.
256 Lars-Erik Lindgren et al. / Procedia Manufacturing 35 (2019) 252–258
Lars-Erik Lindgren et al./ Procedia Manufacturing 00 (2016) 000–000 5
Fig. 5. Varestraint test. Only half of the test need be modelled due to symmetry across the weld line. The colour fringes show computed temperatures at the instant when bending starts.
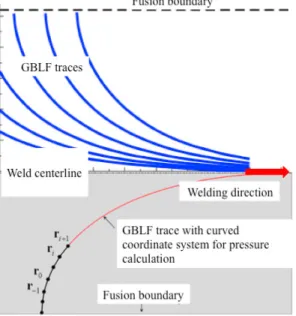
The computed temperatures and strains are extracted from the FE-model in Fig. 5 and post-processed. The gradient of the temperature field is assumed to give the growth direction of grains during solidification. This then traces out the GBLF between the dendrites of the growing grains in the solidification range of the material, see lower part of Fig. 6. A point r0 within the material that has been molten during the passage of the heat source. The computed temperature from the FE model is computed to trace out its normal gradient both towards the centreline and the fusion boundary giving where will be a liquid film between the growing grains during solidification. A one-dimensional pressure equation is solved along this coordinate system. The starting pressure is atmospheric at the weld pool. The back fill and thereby the pressure along it depends on temperature, i.e. amount of solidification, as well as strain obtained from the FE model. The model includes submodels for primary dendrite arm spacing, film thickness due to solidification, a length scale distribution mechanical strain from FE model to liquid film. There is a critical underpressure that gives ‘unlimited’ pore growth. The critical underpressure depends on the surface energy of gas-liquid interface and the thickness of the liquid film. If this pressure remains when the location solidifies, then it is assumed that a defect is initiated at this location. Crack Initiation Length (CIL) is how long distance with critical underpressure is ‘frozen in’. Two cases evaluated for validation of model are shown in Fig. 7.
6 Lars-Erik Lindgren et al./ Procedia Manufacturing 00 (2016) 000–000
Fig. 6. Lower part shows the tracing the GLBF during solidification. The upper part shows a number of liquid films used for computing risk for crack initiation.
Fig. 7. Shows the computed Crack Initiation Length, which is a measure for risk of crack initiation, together with measured crack positions. The latter are indicated by black lines that show their location and length. The test has an applied augmented strain of 1.1%.
4. Concluding remarks
Approaches from computational welding mechanics [14] can be used to give several quality indicators useful when designing AM and its post-processes for high quality products. They require sufficient accurate constitutive models, calibrated heat source models as well as logics for deactivation/activation of elements and applying the heat source in order to imitate the addition of new material. Furthermore, if phase transformations occur, then corresponding microstructure models need be implemented and coupled to property models, particularly the flow stress model [15]. However, defect models are not sufficiently developed yet to provide life estimates.
Fig. 5. Varestraint test. Only half of the test need be modelled due to symmetry across the weld line. The colour fringes show computed temperatures at the instant when bending starts.
The computed temperatures and strains are extracted from the FE-model in Fig. 5 and post-processed. The gradient of the temperature field is assumed to give the growth direction of grains during solidification. This then traces out the GBLF between the dendrites of the growing grains in the solidification range of the material, see lower part of Fig. 6. A point r0 within the material that has been molten during the passage of the heat source. The computed temperature from the FE model is computed to trace out its normal gradient both towards the centreline and the fusion boundary giving where will be a liquid film between the growing grains during solidification. A one-dimensional pressure equation is solved along this coordinate system. The starting pressure is atmospheric at the weld pool. The back fill and thereby the pressure along it depends on temperature, i.e. amount of solidification, as well as strain obtained from the FE model. The model includes submodels for primary dendrite arm spacing, film thickness due to solidification, a length scale distribution mechanical strain from FE model to liquid film. There is a critical underpressure that gives ‘unlimited’ pore growth. The critical underpressure depends on the surface energy of gas-liquid interface and the thickness of the liquid film. If this pressure remains when the location solidifies, then it is assumed that a defect is initiated at this location. Crack Initiation Length (CIL) is how long distance with critical underpressure is ‘frozen in’. Two cases evaluated for validation of model are shown in Fig. 7.
Fig. 6. Lower part shows the tracing the GLBF during solidification. The upper part shows a number of liquid films used for computing risk for crack initiation.
Fig. 7. Shows the computed Crack Initiation Length, which is a measure for risk of crack initiation, together with measured crack positions. The latter are indicated by black lines that show their location and length. The test has an applied augmented strain of 1.1%.
4. Concluding remarks
Approaches from computational welding mechanics [14] can be used to give several quality indicators useful when designing AM and its post-processes for high quality products. They require sufficient accurate constitutive models, calibrated heat source models as well as logics for deactivation/activation of elements and applying the heat source in order to imitate the addition of new material. Furthermore, if phase transformations occur, then corresponding microstructure models need be implemented and coupled to property models, particularly the flow stress model [15]. However, defect models are not sufficiently developed yet to provide life estimates.
258 Lars-Erik Lindgren et al./ Procedia Manufacturing 00 (2016) 000–000 Lars-Erik Lindgren et al. / Procedia Manufacturing 35 (2019) 252–258 7
Acknowledgements
This research was supported by the Swedish Foundation for Strategic Research project ‘Development of Process and Material in Additive Manufacturing’, Reference number GMT14-0048
References
[1] R. Andreotta, L. Ladani, W. Brindley, Finite Elements in Analysis and Design, 135 (2017) 36-43.
[2] E.R. Denlinger, V. Jagdale, G.V. Srinivasan, T. El-Wardany, P. Michaleris, Additive Manufacturing, 11 (2016) 7-15.
[3] J. Romano, L. Ladani, M. Sadowski, JOM, 68 (2016) 967-977.
[4] M. Chiumenti, M. Cervera, A. Salmi, C. Agelet de Saracibar, N. Dialami, K. Matsui, Computer Methods in Applied Mechanics and Engineering, 199 (2010) 2343-2359.
[5] E.R. Denlinger, M. Gouge, J. Irwin, P. Michaleris, Additive Manufacturing, 16 (2017) 73-80.
[6] A.J. Dunbar, E.R. Denlinger, M.F. Gouge, T.W. Simpson, P. Michaleris, Additive Manufacturing, 15 (2017) 57-65.
[7] A.J. Dunbar, E.R. Denlinger, M.F. Gouge, P. Michaleris, Additive Manufacturing, 12 (2016) 108-120. [8] M. Fisk, A. Lundbäck, J. Edberg, J.M. Zhou, Finite Elements in Analysis and Design, 120 (2016) 92-101. [9] M. Fisk, A. Lundbäck, J. Andersson, L.-E. Lindgren, Finite element analysis using a dislocation density based flow stress model coupled with model for precipitate evolution, in: E. Ott, A. Banik, J. Andersson, I. Dempster, T. Gabb, J. Groh, K. Heck, R. Helmink, X. Liu, A. Wusatowska-Sarnek (Eds.) 8th International Symposium on Superalloy 718 and Derivatives, J Wiley, Hoboken, USA, pp. 155-168.
[10] M. Fisk, J.C. Ion, L.E. Lindgren, Computational Materials Science, 82 (2014) 531-539. [11] M. Fisk, A. Lundbäck, Finite Elements in Analysis and Design, 58 (2012) 66-73.
[12] E.R. Denlinger, J.C. Heigel, P. Michaleris, T.A. Palmer, Journal of Materials Processing Technology, 215 (2015) 123-131.
[13] J. Draxler, J. Edberg, L.-E. Lindgen, J. Andersson, Simulation of weld solidfication craking in Varestraint tests of Alloy 718, in: 12th International Seminar on Numerical Analysis of Weldability", Graz, Castel Seggau, Austria, To be published.
[14] L.-E. Lindgren, A. Lundbäck, Comptes Rendus Mécanique, (2018).