Biomedical Laboratory Science and Technology Faculty of Health and Society
Malmö University SE- 205 05 Malmö Sweden
Master program in Biomedical Methods and Technology www.edu.mah.se/VABME
EXPRESSION OF THE THREE PROTO-ONCOGENES, EGFR, MEK AND B-RAF AFTER TRANSFECTION INTO HUMAN CELLS AND THEIR DETECTION BY
MASS SPECTROMETRY
STUDENT: JIMMY OLUM
THIS DIPLOMA THESIS IS BEING SUBMITTED IN PARTIAL FULFILLMENT FOR THE REQUIREMENT OF THE DIPLOMA IN
BIOMEDICAL METHODS AND TECHNOLOGY. BM 741E
DEGREE PROJECT, 30 ECTS.
SUPERVISORS:
JOSHUA LABAER, MD. PhD, THE INSTITUTE OF BIODESIGN, ARIZONA STATE UNIVERSITY.
Prof. GYÖRGY MARKO-VARGA, PhD, LUND UNIVERSITET.
OPPONENT:
Prof. HÅKAN ERIKSSON, PhD MALMÖ UNIVERSITY
1 | P a g e Abstract
When activated by growth factors and mitogens, cellular receptors like EGFR become activated and transmit signals from the cell surface through the MAPK pathway into the nucleus of the cell, in order to elicit a cellular response like growth, apoptosis, proliferation, and survival. Over activation of EGFR even without receptor binding and members of the MAPK pathways like BRAF and MEK1 have been reported in tumorigenesis. We used Gateway Technology to study the recombinant protein expressions from these 3 genes in HEK293T and HeLa cell lines, using pLenti 6.3/V5 as the expression system. BRAF was neither detected in the HeLa nor the HEK 293T cell lines, by mass spectrometry after transfection. Only in the HeLa cell line was EGFR identified meanwhile MEK1 was identified both in HEK293T and HeLa cell lines. However, the results showed that the proteins identified were endogenous to these cell lines and therefore, no recombinant proteins were expressed using the pLenti 6.3/V5, as the expression system.
Key words: EGFR; MEK1; BRAF; Mass spectrometry; Gateway Technology, pLenti 6.3/V5.
2 | P a g e
Table of Contents
1. INTRODUCTION...4
2. MATERIALS AND METHODS...9
3. RESULTS AND DISCUSSIONS...14
4. CONCLUSION...29
6. APPRECIATION...30
5. REFERENCES...31
3 | P a g e
List of Abbreviations
Abs.………....…. Absorbance
AmBic………. Ammonium Bicarbonate Amp………...…...Ampicillin
bp………. Base Pair
DNA……….... Deoxyribonucleic acid
ERK………. Extracellular Signal-regulated Kinase FASP………. Filter aided sample preparation HEK………...….... Human embryonic kidney cell
HeLa……… ………A type of cell in an immortal cell line used in Biomedical research and derived from cervical cancer cell sample of a patient named Henrietta Lacks.
INT……… …Integrase
IHF………...Integrase Host Factor Kan………...Kanamycin
LC-MS/MS………...Liquid chromatography coupled with mass spectrometry.
LTR………. Long terminal repeat LV...………. Lentiviral Vectors
MAPK……….…… Mitogen-activated protein kinase MeOH………. Methanol
RT……….…Room temperature
PCR...Polymerase Chain Reaction
PNRC……….…….……. Perinuclear recycling compartment PPARG ………...…. Peroxisome proliferator-activated receptor gamma
RNA……….……….... Ribonucleic acid
SDS-PAGE……….………. Sodium dodecyl polyacrylamide gel electrophoresis
4 | P a g e
INTRODUCTION
EGFR and MAPK signalling cascade.
The role of cellular receptors has been observed in translating cell signals from the outside of the cell through the cytoplasm into the nucleus of the cell, in order to elicit a cellular response like growth, apoptosis, proliferation, and survival, when activated, however, receptor activation is tightly regulated in normal functioning cells[1].
The Human epidermal growth factor receptor (HER) family includes 4 similarly and structurally related cellular receptors, like HER1 (EGFR), HER2, HER3, and HER4 which interact in numerous ways [2]. Meanwhile HER1 or EGFR, HER3, and HER4 have been shown to be associated with one or more specific ligands, HER2 has no known ligands that bind to it [3,4]. Furthermore, HER2 is the most common dimerization partner for all members of the HER family since it exists in an open conformation and is continually available for dimerization. All the 4 members of the HER family of receptors are able to homodimerize or to heterodimerize with other members of the family, multiple receptor combinations are possible since receptor activation is involving multiple processes [1,4 and 5].
Upon ligand binding, epidermal growth factor receptor, EGFR is activated through a conformational change in its extracellular domain, thereby causing its dimerization or formation of pairs, and the active EGFR dimer autophosphorylates its tyrosine residues by the cytoplasmic tail [4,6]. The aftermath is that phosphotyrosine- binding proteins are initiated to activate multiple downstream signal transduction pathways like the MAPK pathways, Akt prosurvival pathway and PI3K pathway [4,6]. Src kinase is responsible for phosphorylating receptor tyrosine kinase (RTK) EGFR, which in turn phosphorylates Erk/MAPK signalling pathway, hence regulating cell proliferation [7]. EFGR signalling pathways are among the frequently discussed receptors in human carcinoma and studies in breast cancers have implicated overexpression of Src intertwined with high levels of EGFR [8] and at large, HER family receptors represent an ongoing area of cancer research because their activation and signalling is involved in tumorigenesis. [1,9].
The mitogen-activated protein kinase (MAPK) pathway includes the signalling molecules Ras, Raf, MEK, and ERK. The signalling of this pathway begins when the upstream extracellular growth factors or mitogen bind to growth factor receptor tyrosine kinases causing receptor activation. Activated receptor tyrosine kinases then activates the protein Ras which in turn causes membrane recruitment and activation of Raf proteins, BRAF or RAF1 a proto-oncogene subsequently activates MAP2K1/MEK1 and MAP2K2/MEK2 to catalyse the phosphorylation of a threonine and a tyrosine residue in a Thr-Glu-Tyr sequence, found in the extracellular signal-regulated kinases, MAPK3/ERK1 and MAPK1/ERK2, hence enacting their activation. ERK1/2 signalling pathway in the cell nucleus directly or indirectly affect cellular functions involving metabolism, cytoskeletal rearrangements and regulation of transcription. The overall effect on the cell includes cell growth, proliferation, survival and differentiation, and adhesion [10 -13].
5 | P a g e
Research into the MAPK pathway has shown it to be important in some cancers like colorectal tumours, melanoma tumours, ovarian tumours and papillary thyroid tumours, due to abnormal or dysregulated MAPK signalling which significantly leads to increased or uncontrolled cell proliferation, resistance to apoptosis or programmed cell death, resistance to chemotherapy, radiotherapy, and targeted therapies [14 -17]. Common mutations in this pathway involves the mutations in the BRAF protein, the V600E point mutation, which enables BRAF to signal independently even without the activation of EGFR, resulting into an overactive downstream signalling via MEK and ERK [18 -20].
The MAPK signalling cascade has been further illustrated in figure 1, below (adapted from Cell Signalling Technology [21]
Fig.1. Showing the EGFR and the MAPK signalling cascade.
Recent studies have shown that one of the targets of the MAPK/ERK cascade is peroxisome proliferator-activated receptor gamma (PPARG), a nuclear receptor that directly promotes cell differentiation and apoptosis. The MAPK/ERK cascade has not only been shown to be involved in the fragmentation of the Golgi apparatus in mitosis but also in the regulation of endosomal dynamics, like endosome cycling via the perinuclear recycling compartment (PNRC) and like lysosome processing as well as exporting PPARG from the nucleus [22]
Biology of Lentivirus
Most of the viral vector systems that have been constructed for use in gene therapy, do not integrate in the genome of cells, thereby limiting transgenesis. However, viral vectors of the Retroviridae family especially; oncoretroviruses (γ-retroviruses) and lentiviruses, have been very well studied and best characterized by their demonstrated intrinsic ability to retrotranscribe their RNA into complimentary copies of DNA and then stably integrate the cDNA into a cell’s genome with high efficiency [23].
6 | P a g e
Though oncoretroviral vectors only integrate in competently replicating cells, lentiviral vectors like HIV-1 derived vectors overcome limitations by showing the ability to transduce non-dividing cells and provide a more efficient long-term transgene expression [23, 24]. The most likely reason for LV vectors being superior to other vector types could be due to the stability of viral transcripts obtained from the lentiviral provirus when the strong 3’ poly(A) signal causes an increased cytoplasmic accumulation of the RNA of the transgene [25] Structurally, lentiviral vectors possess a diploid genome containing two copies of positive stranded single RNA, viral enzyme, protease derived from the pro gene, a nucleocapsid made up of proteins translated from the gag gene, integrase, RNase H, reverse transcriptase derived from the pol gene located within the internal core of the virus [26,27]. The gag gene encodes a polyprotein that is translated from an unspliced mRNA which is then cleaved by the viral protease enzyme into the matrix, capsid, and nucleocapsid proteins. The env gene also encodes a polyprotein precursor which is cleaved into the surface envelope glycoprotein, gp120 and the transmembrane glycoprotein, gp41. The pol gene encodes the 3 enzymatic proteins reverse transcriptase, integrase and protease within the virion in the viral genome, as illustrated in fig.2 below.
Fi gure 2, structure of a com plete lentivi rus [29].
Accessory proteins like Vpu, Vif, Vpr, and Nef are needed for RNA transport, regulation of transcription, gene assembly and expression. Specifically, Vif protein downregulates the host’s ability to signal an immune response, meanwhile Nef protein blocks activation of T- Cells, Vpu protein aides in viral release form the cell surface into the cytoplasm, and Vpr [27, 28]
7 | P a g e
Figure 3. The non-segmented, linearized, single-stranded RNA of a lentivirus’ integrated provirus genome structure that encodes for the genes pol, gag and env.
Upon entry of the virus into the cell host, its reverse transcribed produce a double stranded viral DNA which then enters in the nucleus and integrates permanently by chance in the host genome, resulting into an integrated provirus, having a genome flanked by the long terminal repeats (LTR), having the U5, R and the U3 regions; the U5 region carries a tRNA primer-binding site which is necessary for is reverse transcription, the R region is where transcription begins and the U3 region, as a promoter and contains transcriptional enhancer elements and a TATA box. The 5’ LTR functions as the RNA pol II promoter and the 3’ LTR functions to terminate transcription meanwhile promoting polyadenylation. The LTR recognises sequences needed for integration of the viral DNA into the genome of the host. The positive signal, psi (ψ) sequence functions as the packaging signal for the RNA genome and the Tat accessory protein activates the 5’ LTR promoter, and also an RNA- binding protein that functions to enhance transcription, whereas Rev, an RNA-binding protein controls the amount of RNA splicing alongside mRNA export into the cytoplasm, thereby promoting a late phase of the gene expression. Upon completion of cycle infection, viral genomes are packaged, enveloped and released from the cells [27, 29-31]
In the practical laboratory setting, the lentiviral vectors that are used to mediate transient transfection of the genes of interests into both dividing and non-dividing mammalian cells, after modification in their genome [23, 24]. One of the common commercially available lentiviral vectors used in the lab is the HiPerform™ pLenti6.3/V5–DEST vector, from Thermo Fischer Scientific (vector structure in appendix III). This vector has been designed with the following key elements: The Rous Sarcoma Virus (RSV) enhancer/promoter for Tat-independent production of viral mRNA in the producer cell line [32]. The 5′ and 3′ Long Terminal Repeats (LTR) from the modified HIV-1 has been added to aid in viral packaging and reverse transcription of the viral mRNA [32, 33]. The U3 region of the 3′ LTR has been deleted (ΔU3) in order to facilitate self-inactivation of the 5′ LTR after transduction to enhance the biosafety of the vector [32]. The added HIV-1 psi (Ψ) packaging sequence aides in viral packaging [33] [2]. HIV Rev response element (RRE) for Rev-dependent nuclear export of unspliced viral mRNA [34, 35]. The two Human CMV promoter for constitutive expression of the gene of interest and the SV40 promoter driving expression of Blasticidin, which is a resistance gene used for selection in E. coli and mammalian cells [36]. The two recombination sites, attR1 and attR2, downstream of the CMV promoter is designed for recombinational cloning of the gene of interest from an entry clone.
8 | P a g e
Chloramphenicol resistance gene (CmR) located between the two attR sites is meant for counter-screening. The ccdB gene (death cassette) located between the attR sites is intended for negative selection.
The C-terminal V5 epitope for detection of the recombinant protein of interest. The Ampicillin resistance gene for selection in E. coli and the pUC origin for high-copy replication of the plasmid in E. coli. The pLenti6.3/V5–DEST vector has been chosen for this research work because it has 2 extra advantageous element added to it namely; the Woodchuck Posttranscriptional Regulatory Element (WPRE) from the woodchuck hepatitis virus, which is placed directly downstream of the gene of interest, increases transgene expression, so that the genes of interest are expressed in the mammalian cells used [37], and the cPPT (the central Polypurine Tract) element from the HIV-1 integrase gene, which increases the copy number of lentivirus integrating into the host genome [38] so that all together, a two-fold increase in viral titer is achieved. The combinational use of the WPRE and cPPT together, produce at least a four-fold increase in protein expression.
Since the last decade, lentiviral vectors have increasingly become an important tool for the delivery of genetic materials to many cell types in vast experimental systems because of their ability to stably integrate the desired heritable DNA sequences into the genome of cells. In theory, lentiviral and retroviral vectors could be used to permanently express desired gene constructs, like a protein coding sequence, in cell populations [39 - 41] Of recent, the use of lentiviral vectors, especially HIV-1, has superseded laboratory settings in tissue culture and animal studies, such that they are being used in clinical trials with the hope of combatting genetic diseases; gene therapy is one such application [42,43]
Aim:
The aim of this work was to create cDNA vector constructs containing the 3 genes; EGFR, MEK1 and BRAF and then transfer them in pLenti 6.3/V5 expression system, so as to obtain expressions as recombinant proteins in HeLa and HEK293T cell lines, after transfection by the Gateway Technology [44]. The expressed recombinant proteins were to be detected and identified by mass spectrometry [45].
9 | P a g e
MATERIALS AND METHODS:
Genes of interest:
The 3 genes of interest; epidermal growth factor receptor (EGFR), BRAF and MEK were used in the experiment; EGFR and MEK1 were in pDONR221plasmid vectors having kanamycin resistance genes, while BRAF was in pDNR-DUAL vector with ampicillin resistance; these genes, stored in phage resistant DH5 α bacterial cells at -80O C were purchased as frozen glycerol stock from DNASU plasmid repository, at the Biodesign Institute (Tempe, USA) [46]. To verify whether the genes of interest were present in these plasmid vectors and in the right sizes, samples were taken from all the three glycerol stocks and grown overnight in 5ml LB agar broth with 1mg/ml of Kanamycin antibiotics for the pDONR221 plasmids and 1mg/ml of ampicillin for pDNR-DUAL (appendix I, II). A miniprep kit from New England Biolabs (MA, USA) was used to purify the plasmids. Restriction digests were done for all of them. Two restriction endonucleases, ECoRV and NotI, New England Biolabs (MA, USA) were used to digest BRAF in pDNR-DUAL. The other two genes, MEK1 and EGFR in pDONR221 221 vectors, were digested by BSrGI (New England Biolabs, MA, USA) for 2hrs at 37oC, and resolved on 1% agarose gel then viewed using alpha view system software.
PCR Cloning reaction of BRAF Gene in pDNR-DUAL:
Since the BRAF gene was in pDNR-DUAL plasmid vector design that was incompatible with Gateway Cloning Technology, i.e. Creator system, we decided to clone it into the pDONRTM 221plasmid vector to achieve a BRAF donor clone, as described below.
BRAF Primer Design:
The Forward Primer flanking sequence- AttB1- BRAF- F displayed as 5’- GCG CAC AAG TTT GTA CAA AAA AGC CTC CAT GGC GCT GAG CGG T – 3’ and the Reverse Primer flanking sequence- AttB2- BRAF- R displayed as 5’- GCG CAC CACC TTT GTA CAA GAA AGC TGG GTC CAA GTG GAC AGG AAA CGC ACC – 3’ were designed using the Primer3Plus Bioinformatics software and Thermo Fischer Scientific OligoPerfectTM Designer. The Forward and Reverse primer sequences were then purchased from Integrated DNA Technologies (Iowa, USA). Gateway attachment sites, AttB1 and AttB2 flanking sequences were attached to the BRAF gene template in a PCR thermo cycler reaction. The attB flanked PCR product was resolved and verified in 1% agarose gel on an Alpha View system, fig 5. The attB flanked PCR product was then purified using Monarch PCR and DNA clean up kit, New England Biolabs (MA, USA) to remove any excess attB primers and attB primer- dimers, which are capable of recombining with the pDONRTM vector when a BP recombination reaction is performed. The purified attB PCR product was then quantified in the NanoDrop 800 Spectrophotometer, Thermo Fischer Scientific (DE, USA), in order to determine the DNA concentration that would be used in the BP reaction.
10 | P a g e
Gateway BP Recombination Reaction:
Next, a 10ul BP recombination reaction containing; 2ul of 5X BP Clonase™ II enzyme, Thermo Fischer Scientific (MA, USA), 2ul of 150ng/ul of pDONR 221 plasmid donor vector (Thermo Fischer Scientific, MA, USA), 2ul of 50ng/ul PCR product, and 4ul of DEPC treated water (GE Life Sciences, Utah, USA), was performed at RT for 1 hr, in the presence of 10 ng of integrase (INT) and 5 ng of integrase Host Factor (IHF). 5ul of Stbl3 one shot commercially competent DH5α E. coli cells (Thermo Fisher Scientific, MA, USA) were then transformed with 20ul of the product of the BP reaction and grown in 250ul of SOC media. 200ul of the commercially transformed competent cells were then plated overnight in LB agar plates having Kanamycin resistance for plasmid growth (fig.6). The next day, 2 colonies were picked from the LB agar plate then grown overnight in 5ml of LB broth with 1mg/ml of Kanamycin or selection in the culture. After, a mini prep was done following Monarch Plasmid Miniprep Kit (New England Biolabs MA, USA); and a glycerol stock was also made from the same broth and stored at -80oC for immediate future use, and then a NanoDrop 800 spectrophotometer (Thermo Fischer Scientific, DE, USA) determined the plasmid DNA concentration for sequencing. Sequencing helped to determine if the gene insert was in the vector and in the correct orientation after the BP reaction. To achieve this, M13 universal forward and reverse primers (Thermo Fisher Scientific, MA, USA) were used to detect the BRAF gene in pDONR 221 vector, using Sanger Sequencing [47-48]. At the same time, MEK1 and EGFR contained in pDONR221 plasmid vectors were also submitted for sequencing (the sequencing results posted in appendix IX and X).
Gateway LR Recombination Reaction:
Now that all the 3 genes of interest were in the Gateway compatible vectors, pDONR221 plasmid vectors, a 10ul LR recombination reaction preceded using a pLenti 6.3 V5 destination vector kit (Thermo Fisher Scientific, MA, USA) for 1h at RT. The reaction volumes included 2ul of LR Clonase™ enzyme, 2ul of 1X LR Reaction Buffer, 1ul of Destination vector (150 ng/ul), 1ul of Entry vector (150 ng/ul), 4ul of DEPC treated water. 10 ng of INT, 5 ng of IHF and 30 ng of the phage protein Xis were added to 10ul of the reaction.
Then 20ul of the pLenti 6.3 V5 expression clones were transformed into 5ul of competent DH5α E. coli cells, (Thermo Fisher Scientific, MA, USA), and grown in 250ul of SOC media before plating in LB agar plates with Amp resistance, overnight. The next day, 2 colonies were selected for proper antibiotic marker then grown in LB having ampicillin resistance overnight at 37oC in an incubator shaker and the plasmids were purified using Monarch Plasmid Miniprep Kit (New England Biolabs, MA, USA); NanoDrop 800 spectrophotometry quantified the plasmids and 50ng of 10ul of the plasmids were sequenced using CMV forward primers and V5 reverse primers selected from DNASU.org. and Thermo Fischer Scientific. Sanger sequencing was the method of choice to ensure that the gene inserts were present and in the correct orientation (appendix IV and V). Finally, the glycerol stock of the pLenti 6.3 V5 destination vector having the genes of interest were plated and grown overnight in Amp resistant plates at 37oC; the next day, 2 colonies were picked and starter cultures of 5ml were grown for 8hrs then after transferred to larger culture flasks of 500ml for overnight growth in LB having ampicillin selection, at 37oC.
11 | P a g e
A Maxiprep was then done using a NucleoBond Xtra Maxi plasmid purification system (PA, USA), to obtain clean plasmid DNAs from any chemical contaminations of proteins and RNA. Cell lines and cell culture:
Human Embryonic 293T Cells line (HEK 293T) from Harvard University (MA, USA) and HeLa cell line from American Type Culture Collection (Manassas, Virginia) were grown in DMEM (Fischer Scientific, USA) supplemented with 10% Fetal Calf Serum (GE Healthcare Life Sciences, Utah, USA) in the presence of 0.5ug/ul penicillin and streptomycin to hinder infection of the cell culture. These two cell lines were plated in four 6 well plates, a day before transfection since they were adherent cells that needed to attain approximately 80% confluency. The pLenti 6.3V 5 expression vectors carrying the 3 gene inserts, along with a GFP gene as a control, were transfected into the cells using Fugene Transfection Reagent, Promega (WI, USA) and placed in the incubator with 5% CO2 at 37oC for 48h. Selective pressures were applied to the transfected cells at 0.5ug/ul Blasticidin up to 2weeks to generate stable transfectants, with subsequent replacement of selective media and passage of the cells. In the second week, the cells in 2 of the four 6 well- plates were trypsinized using 0.25% trypsin (GE Life Sciences, Utah, USA), lysed in RIPA buffer, then the protein concentration determined, and finally collected into appropriate vials to be frozen down at -80oC until shipment to Lund university, Sweden, for a later protein characterization using Mass Spectrometry in Prof. György’s lab.
Western blots:
To determine the required protein concentrations to perform a western blot, the two remaining cell plates, were lysed in lysis buffer then Thermo Scientific™ Pierce™ BCA Protein Assay, (Thermo Scientific, IL, USA) was performed in a 96 well -plate as previously described [49]. The purple-coloured reaction complexes were read at 562nm on a Multilabel Reader (PerkinElmer Envision MA, USA) and results recorded. In order to perform the western blot, 15ug of samples were mixed with 5X Laemmli sample buffer (4% SDS, 10% Beta-mercapto-ethanol, 20%glycerol, 0.004% bromophenol blue, 0.125 M Tris-HCl) then boiled for 5 minutes at 95oC before loading them into the 4-12% polyacrylamide gel wells, so that the set up was run in a BioRad electrophoretic tank with 1X Running Buffer at 120V for 1h.The nitrocellulose membrane was cut to size then activated in MeOH for 30 seconds and immediately transferred to MiliQ water for another 30 seconds before rocking it in 20 ml of transfer buffer. Next, 2 extra-thick blot was cut to size and also soaked in transfer buffer. The gel was removed then transferred to the transfer apparatus having an extra- thick blot on the bottom, the nitrocellulose membrane, the gel then the second blot on top, and run for 1h at 12V/cm2. Next, the membrane was blocked in 20ml of 5% milk powder/PBS-Tween for 1hr, while rocking. The membrane was then washed 3 times in 20 ml of PBS-Tween before incubating with primary antibody, 10ul of primary antibody in 20 ml of 5% milk/PBS-Tween overnight at 4oC. 6 gels and 6 nitrocellulose membranes were used for the detection of EGFR, BRAF, MEK, GAPDH and GFP in pLenti 6.3 and pLenti 4. After incubation with primary antibodies the blots were washed with 20ml of PBS-Tween for 5 minutes 3 times before incubation with 10 ul secondary antibody in 20ml of 5% milk powder/PBS-Tween for 2h.
12 | P a g e
The blots were washed in 20 ml of PBS-Tween for 5 minutes between 3 washes each then dripped-dry in order to add Chemiluminescent Reagent A (luminol) and Reagent B (hydrogen peroxide), (Thermo Fischer Scientific MA, USA). Chemiluminescent Reagent A (luminol) was oxidized by hydrogen peroxide (Reagent B), in the presence of horseradish peroxidase (HRP) conjugated secondary antibodies for 1 minute, then viewed in the Alpha View system under 5 minutes. The mouse monoclonal primary antibodies used were V5-Tag mouse mAb (Invitrogen, Carlsbad, CA, USA), EGF Receptor mouse mAb (Cell Signalling Technologies, Iowa, USA),Anti-GAPDH antibody (Invitrogen, Carlsbad, CA, USA) produced in mouse with their corresponding anti- mouse IgG conjugated to Horse radish peroxidase secondary antibody(Invitrogen, Carlsbad, CA, USA) The rabbit monoclonal antibodies used were produced in rabbit and they included; MEK1 rabbit Ab (Cell Signalling Technologies, Iowa, USA), BRAF rabbit mAb (Cell Signalling Technologies, Iowa, USA) with their corresponding secondary anti-rabbit IgG conjugated to Horse radish peroxidase (Invitrogen, Carlsbad, CA, USA) The monoclonal primary antibodies used were in a dilution of 1:3000 and the secondary antibodies in a dilution of 1:5000.
Sodium Dodecyl Sulphate Polyacrylamide Gel Electrophoresis (SDS-PAGE):
The proteins samples in lysis buffer were pre-concentrated by speed- vacuum evaporation in the Eppendorf concentrator plus (Hamburg, Germany) then the sample pellet re-suspended in 10ul of MiliQ water. NuPAGE LDS sample buffer (Life Technologies, Carlsbad, CA, USA) composing of 2% SDS, 20% glycerol, 20 mM Tris-Cl, pH 6.8, 2 mM ethylene diamine tetra-acetic acid (EDTA), 160 mM dithiothreitol (DTT), were used to denature the proteins at 95o C for 5min, then loaded on the wells of the 4- 12% NuPAGE Bis - Tris Gel (Life Technologies, Carlsbad, CA, USA) alongside the SeeBlue plus 2 prestained standard (Invitrogen, Carlsbad, CA, USA). The samples were run with NuPAGE running buffer (Life Technologies, Carlsbad, CA, USA) at 120V for 1h, then stained with Commassie Brilliant Blue (10% CH3COOH/ 30% EtoH/ 60% H2O) overnight, to be destained the next day in a mixture of 10% CH3COOH/ 30% EtoH/ 60% H2O.
In solution digestion:
Reduction of disulphide bridges and alkylation of cysteines
To 30ug of Protein sample, was added 8 M urea in 50 mM AmBic to constitute a volume of 200 µL. Next, 4 µL of 0.5 M dithiothreitol (final conc 10 mM DTT) was added then the samples were shaken at 600 rpm for 1h at 37 ˚C. Then 8 µL of 0.5 M iodoacetamide (final conc 20 mM IAA) was added and the samples were incubated at RT for 30 min in darkness.
Protein digestion using FASP (Filter aided sample preparation) method.
Protein lysates were processed by the FASP protocol [50-51] using Microcon 30k centrifugal ultrafiltration units (Merck, Darmstadt) operated at 10 000 x g. Protein samples were mixed with 100 μL of 8 M urea in 50 mM Ammonium Bicarbonate(UA), in the ultrafiltration unit and then centrifuged at 20 °C, for 15 min. The eluates were discarded; 200 μL of UA was pipetted into the filtration unit, and the units were centrifuged again.
13 | P a g e
Filters were washed three times with 100 μL of 50 mM Ammonium Bicarbonate (digestion buffer, DB) and proteins were digested in 50 μL of DB at 37 °C for 18 h, using trypsin (Promega, WI, USA) at an enzyme to protein ratio of 1:100. The released peptides were collected by centrifugation at 10 000g for 10 min followed by two washes with 100 μL of DB. The eluates were desalted on C18-microcolumns (The Nest Group Inc., MA, USA), evaporated to dryness in a vacuum of the Eppendorf concentrator plus (Hamburg, Germany), dissolved in 0.1% Formic acid and stored frozen, at −20 °C until mass spectrometric analysis.
LC-MS/MS analysis:
The liquid chromatographic separation was performed in an EASY-nLC 1000 system (Thermo Scientific, San José, CA, USA). The enzymatic digestions (1 µg of each) were first loaded onto a trapping column (150 mm x 20 μm, Thermo Scientific, San José, CA, USA). The samples were then separated using a column (25 cm x 75 μm, C18, 2 μm and 100Å, Thermo Scientific, San José, CA, USA) with a flow rate of 300 nL/min. A non-linear gradient was developed, using solvent A (0.1% formic acid) and solvent B (0.1%formic acid in ACN).
The gradient went from 5% B to 20% B in 60 min, then increased up to 35% B in 15 min, followed by a raise to 80% in 5 min, which was maintained for 10 min. The column was coupled to a Q-Exactive mass spectrometer (Thermo Scientific, San José, CA, USA) via a nano-electrospray source. The samples were analyzed using top15 data-dependent approach. Full MS scans were acquired in the Orbitrap mass analyzer over m/z 400–1600 range with resolution 70,000 (at m/z 200). The target value was 1.00 x 10⁶. The fifteen most intense peaks with charge state ≥ 2 were fragmented in the HCD collision cell with normalized collision energy of 30%, and tandem mass spectra were acquired in the Orbitrap mass analyzer with resolution 17,500 at m/z 200. The target value was 2.00 x 10⁵. The ion selection threshold was 8.30 x 10⁵ counts, and the maximum allowed ion accumulation times were 100 ms for full MS scans and 120 ms for tandem mass spectra. For all the experiments, dynamic exclusion was set to 20 s. Samples were analyzed in triplicates.
Data analysis:
Raw files were analyzed with Proteome Discoverer v 2.1 (Thermo Scientific, San José, CA). Peptides were identified using SEQUEST HT programme against UniProtKB human database integrated into Proteome Discoverer 2.1. The search was performed with the following parameters applied: carbamidomethylation as static modification, oxidation of methionine as dynamic modification, 10ppm precursor tolerance and 0.02 Da fragment tolerance. Up to two missed cleavages for tryptic peptides was allowed. False peptide discovery rates at peptide and protein levels were specified at 0.01.
Relatives protein abundances were estimated by label free quantification (LFQ) based on peptide intensities using Proteome Discoverer 2.1. Further statistical analysis of the data sets was performed using the Minitab 17 software.
14 | P a g e
RESULTS AND DISCUSSIONS:
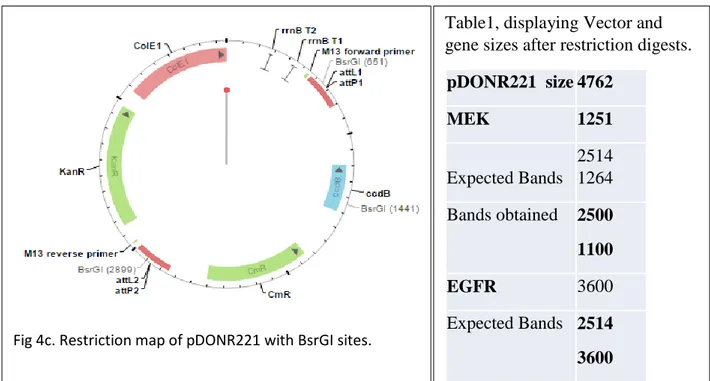
It was important for us to confirm that the genes purchased were really inside the vectors inserts and in the correct orientation, so we prepared LB culture for overnight plasmid growth in Kanamycin for EGFR and MEK, meanwhile BRAF was grown in an LB culture having ampicillin at 370C, 5% CO2. We did a miniprep and quantified the plasmids in the NanoDrop spectrometer, table 1, and sequenced MEK and EGFR (appendix X). Restriction digests were also performed with given restriction endonucleases, on the plasmids having the genes of interest, Fig.1, to confirm their molecular weights of the genes if they corresponded with the values given from the DNASU.org., plasmid repository website. Since many external researchers also post genes in different plasmids, it was a necessary precaution to confirm the accuracy of information given about these 3 genes.
Table 1. Showing the NanoDrop quantification, A260/A280 ratio of 1.7–1.9 and A260/A230 ratio of above 2.0 showing high purity from RNA contamination.
The Miniprep showed that the plasmids average yield after overnight culture was good since an average yield of 100 ng/ul is sufficient. We proceeded to perform a restriction digest of the genes at 37oC for 2h, during which 1% agarose gel was prepared for an electrophoresis run with TAE buffer. The alpha View system was used to view the bands of the DNA samples as indicated in the lanes 1, 2, and 3 in fig. 4 below.
Conc.(ng/ul) 260/280 260/230 BRAF 333,2 1,87 2,22 353,5 1,88 2,23 329,5 1,89 2,26 337,8 1,89 2,25 Average 338,50 1,883 2,240 S.D 10,561 0,010 0,018 Conc.(ng/ul) 260/280 260/230 MEK 297 1,9 2,18 288,3 1,9 2,17 291,6 1,92 2,18 279,3 1,91 2,15 Average 289,05 1,908 2,170 S.D 7,424 0,010 0,014 Conc.(ng/ul) 260/280 260/230 EGFR 261,2 1,92 2,18 294,7 1,9 2,15 289,8 1,93 2,22 280,8 1,93 2,39 Average 281,63 1,92 2,235 S. D 14,783 0,014 0,107
15 | P a g e
Fig.4a displaying the bands of the genes BRAF, EGFR and MEK1 that have migrated in lanes 1, 2 and 3 respectively.
In lane 1, BRAF gene of size 1904 base pairs (bp), which is quite less than he real size of the genes given by DNASU.org. plasmid repository at 2300 bp because of supercoiling of the plasmids. Fig.4b displayed the empty vector construct with the restriction sites of the 2 endonucleases used to cut the pDNR-DUAL plasmid vector. When the BRAF gene is inserted into the vector in fig.4b above, the restriction site for EcoRV (320) between the loxP sites is lost since BRAF gene doesn’t have any palindrome for EcoRV. NotI endonuclease however cuts at vector position (2) and (1050) right just before and after the loxP sites, leaving the gene of interest completely uncut. The vector backbone obtained in the gel was 2500 bp and 1114 bp as predicted by the vector map in fig. 4b.
As for EGFR and MEK1 in lane 2 and 3 respectively, BsrGI restriction endonuclease was used to cut or digest them. In lane 2, showing EGFR, the pDONR221 vector backbone size appeared at about 2500 bp size and the gene size was 1057 bp Lane 3 was for MEK1, the same vector backbone pDONR221 size showed at band size 2500 bp, meanwhile the gene appeared at 1100 bp, which is the quite close to the size of MEK1, as indicted in DNASU.org. Since the genes are supercoiled, they tend to migrate faster under an electric field hence their bands positions reveal that they have somewhat smaller molecular weights than their matriculated molecular weights obtained from their nucleotide sequences [52]. The empty pDONR 221 vector in Fig.4c, further reveals how the band sizes EFGR and MEK comes about.
M E K c u t B R A F c u t E G F R c u t
Fig.4b. is the empty pDNR-DUAL vector, size 4938 kb
16 | P a g e
Fig.4c, showing that BsrGI cut the pDONR 221 empty vector at palindromic sites 2899bp, 651bp and 1441 bp.
When EGFR and MEK sit in between the recombination attP sites, position 1441bp is lost due to homologous recombination of the genes between the two recombination sites. EGFR and MEK1 also do not have palindromes in them hence the restriction endonuclease doesn’t cut anywhere in them. With the digest result, EGFR was not 3600 bp as otherwise indicated from DNASU.org. site, in fact on reviewing EGFR in different vector systems, we found that the size of EGFR was rather 1200 bp [46]
To confirm our doubts about the 2 genes in pDONR221 plasmids, that they were of interest, the sanger sequencing results revealing the nucleotide sequences obtained were blasted into the Nation Center for Biotechnology Information (NCBI) blast tool and the results suggested that the sequences corresponded to EGRF and MEK1(appendix IX and X).
As pertaining to BRAF, the PCR product with the AttB flanking sequences showed a clear very distinctive band at the expected size of BRAF gene of 2500bp corresponding to the molecular weight of BRAF gene in DNASU.org. plasmid repository [46]. We felt the need to eliminate sanger sequencing since the gene size was perfect and the same time saving on sequencing costs.
Fig 4c. Restriction map of pDONR221 with BsrGI sites.
Table1, displaying Vector and gene sizes after restriction digests.
pDONR221 size 4762 MEK 1251 Expected Bands 2514 1264 Bands obtained 2500 1100 EGFR 3600 Expected Bands 2514 3600 Bands obtained 2500 1057
17 | P a g e
Fig.5. The PCR product appeared at the expected size in the 1% agarose gel. The reference ladder used was HyperLadder™ 1kb.
Having purified the BRAF PCR product, and performing the Gateway BP recombination reaction, BP Clonase playing an important part in this, the Stbl3 one shot chemically competent cells were transformed and plated overnight in LB agar plate, in an incubator at 37oC.
Fig. 6 showed that the colonies grew in kanamycin and there was a high chance the BP reaction was successful.
Next, we proceeded to perform the LR reaction to move all the genes in pDONR221 vectors to pLenti 6.3 V5 expression vectors. LR Clonase enzyme was used at RT for 1 and the LR reaction mixtures having the 3 genes were transformed into Stbl3 one shot chemically competent E.Coli cells. After the competent cells were plated overnight in ampicillin LB agar plates.
18 | P a g e
Fig.7. Small round colonies were obtained the next day. Low salt agar plates were used and 300C was preferred.
We went ahead to grow 2 colonies from each plate overnight in 5ml LB broth in the presence of ampicillin and performed a miniprep the next day to enable plasmid quantification in the NanoDrop spectrophotometer and the results tabulated in table 2 below, revealed good yield of plasmids with very minimal contamination was obtained as seen from the ratio of (A260/280) quantification.
Table 2. A miniprep performed to quantify plasmid yields in pLenti6.3 V5 DEST vectors; A260/A280 ratio of 1.7–1.9 and A260/A230 ratio of above 2.0 shows high plasmid purity from RNA, salt or protein contaminations.
BRAF Conc.(ng/ul) A260/280 A260/230
134,3 1,92 2,12 121,9 1,92 2,19 126,8 1,92 2,13 139,2 1,91 2,22 Average 130,55 1,92 2,17 S.D 7,7 0,005 0,005 MEK Conc.(ng/ul) 260/280 260/230 249,3 1,88 2,05 241,4 1,88 2,07 240 1,9 2,00 202,2 1,89 2,05 Average 230,97 1,88 2,06 S.D 25,22 0,006 0,012 EGFR Conc.(ng/ul) 260/280 260/230 200,2 1,92 2,01 197,7 1,91 2 200,8 1,89 2,02 206,5 1,9 2 average 201,3 1,905 2,01 S.D 3,72 0,013 0,01
19 | P a g e
Next, we proceeded to perform a restriction digest of each of the genes in pLenti 6.3 V5 vectors, using restriction endonucleases, XhoI and HpaI restriction enzymes. The digestion preceded at 37O C for 2h while in an incubator shaker.
Fig.8.Restriction digest of the inserted genes in pLenti 6.3 V5.
The pLenti 6.3 V5 uncut which is the control appeared at band size 5375bp and not at the matriculated size of 9378 bp due to supercoiling of DNA. The size of pLenti 6.3V5 cut was revealed at 6000 bp and the “death cassette” or negative selection gene at 2214 bp. In the BRAF lane, only the vector backbone was seen. In the EGFR lane, the vector backbone was 5525bp and the gene at 2700bp and in the MEK1 lane, the vector backbone was 5500bp and the gene at 2600 bp. The sizes of MEK and EGFR seem exaggerated because extra nucleotide sequences from vector position HpaI 1800bp has been cut and added to the genes, however the second endonuclease, XhoI, cut at position 4297bp right at attR2 (appendix III). Since the plasmid adopt a phenomenon of supercoiling, they have a tendency of migrating faster in the gel matrix [52].
Next, we submitted the samples for sanger sequencing and the primers used were CMV forward primer and V5 reverse primers. The Phred quality scores obtained were quite good (appendix IV). The sequences were then blasted using the nucleotide BLAST tool of the National Center for Biotechnology Information to match them to the genes of interest, as displayed below.
p Len ti 6.3 u n cu t PLe n ti 6.3 c u t B RAF cu t EGF R cu t M EK 1 c u t
20 | P a g e
Table3. Blast search of EGFR with 98-99% confidence that the DNA sequences are really the genes.
The Blast search results indicated with 98% homology to that of the EGFR, even though some were only a variant protein and it could not be concluded that any open reading frames were seen.
The Blast search tool did not detect any BRAF gene, no BRAF homology was obtained but only homologies against the vector constituents were obtained. This result supplements the earlier result of the restriction map of BRAF in in pLenti 6.3 V5, which showed only the vector backbone in the gel in fig.8.
MEK1 search showed a successful LR reaction according to the sequence homology coverage as shown in table 4 below.
EGFR-Rev-V5 Identity
Synthetic construct Homo sapiens clone FLH158487.01L epidermal growth factor receptor (EGFR) mRNA, partial cds 98% Homo sapiens epidermal growth factor receptor (EGFR), RefSeqGene
(LRG_304) on chromosome 7 98%
Homo sapiens FOSMID clone ABC11-49527800N19 from chromosome
7, complete sequence 98%
Homo sapiens cDNA FLJ55514 complete cds, highly similar to Epidermal growth factor receptor precursor (EC 2.7.10.1) 98% Homo sapiens cell proliferation-inducing protein 61 mRNA, complete
cds 98%
Homo sapiens mRNA for epidermal growth factor receptor isoform a
variant, clone: HRC11519 98%
Homo sapiens epidermal growth factor receptor (EGFR) gene, complete cds, alternatively spliced; and 5S ribosomal RNA gene, complete sequence
98% Homo sapiens epidermal growth factor receptor (EGFR), transcript
variant 1, mRNA 98%
Homo sapiens epidermal growth factor receptor (erythroblastic leukemia viral (v-erb-b) oncogene homolog, avian) (EGFR) gene, complete cds 98% Homo sapiens BAC clone RP11-339F13 from 7, complete sequence 98% Homo sapiens cDNA clone IMAGE:30346915, containing frame-shift
errors 98%
Homo sapiens mRNA for epidermal growth factor receptor isoform a
21 | P a g e
Table 4. MEK1 blast search results using NCBI programme revealed homology with MEK1.
MEK - V5 Rev- Primer Ident
Synthetic construct Homo sapiens mitogen-activated protein kinase kinase 1 mRNA, partial cds99%
PREDICTED: Nomascus leucogenys mitogen-activated protein kinase kinase 1 (MAP2K1), mRNA99%
PREDICTED: Homo sapiens mitogen-activated protein kinase kinase 1 (MAP2K1), transcript variant X1, mRNA99%
PREDICTED: Pan paniscus mitogen-activated protein kinase kinase 1 (MAP2K1), mRNA99%
Homo sapiens cDNA FLJ58770 complete cds, highly similar to Dual specificity mitogen-activated protein kinase kinase 1 (EC 2.7.12.2)99%
Homo sapiens mitogen-activated protein kinase kinase 1, mRNA (cDNA clone MGC:169082 IMAGE:9021459), complete cds99%
Homo sapiens mitogen-activated protein kinase kinase 1 (MAP2K1), mRNA 99%
MEK -CMV For- Primer Ident
Synthetic construct DNA, clone: pF1KE0668, Homo sapiens MAP2K1 gene for mitogen-activated protein kinase kinase 1, without stop codon, in Flexi system97%
PREDICTED: Nomascus leucogenys mitogen-activated protein kinase kinase 1 (MAP2K1), mRNA94%
PREDICTED: Pan paniscus mitogen-activated protein kinase kinase 1 (MAP2K1), mRNA94%
PREDICTED: Gorilla gorilla gorilla mitogen-activated protein kinase kinase 1 (MAP2K1), mRNA94%
Homo sapiens mitogen-activated protein kinase kinase 1, mRNA (cDNA clone MGC:169082 IMAGE:9021459), complete cds94%
Homo sapiens mitogen-activated protein kinase kinase 1 (MAP2K1), mRNA 94%
With these results, we next grew up the glycerol stocks for the 3 genes, each in 5ml starter culture having ampicillin for 8h. After 8h, the starter cultures having the genes were transferred into three larger 500ml flasks for overnight growth in Amp, for a MAXI prep, to obtained the highest possible propagation of the plasmids.
The next day, the cells were spanned downed and plasmid DNA extracted from the bacterial cells used to propagate them. The pure plasmids bound unto the NucleoBond® Xtra silica resin, only to be eluted with an elution buffer, then precipitated with isopropanol before reconstitution in TRIS buffer. Plasmids were quantified using NanoDrop 800 Spectrophotomer.
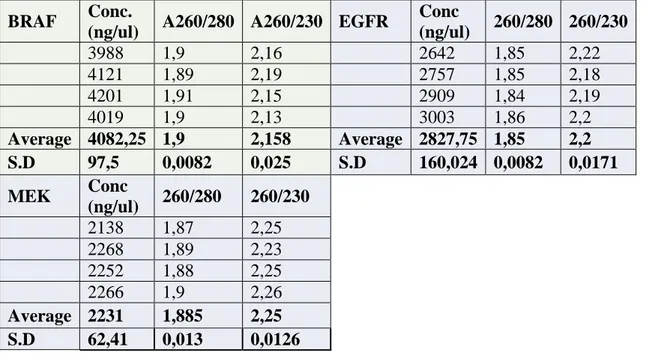
Table 5. Maxiprep performed yielded much plasmids required for chemical transfection into HEK293T and HeLa cell lines. NanoDrop quantification was used.
BRAF Conc.
(ng/ul) A260/280 A260/230 EGFR
Conc (ng/ul) 260/280 260/230 3988 1,9 2,16 2642 1,85 2,22 4121 1,89 2,19 2757 1,85 2,18 4201 1,91 2,15 2909 1,84 2,19 4019 1,9 2,13 3003 1,86 2,2 Average 4082,25 1,9 2,158 Average 2827,75 1,85 2,2 S.D 97,5 0,0082 0,025 S.D 160,024 0,0082 0,0171 MEK Conc (ng/ul) 260/280 260/230 2138 1,87 2,25 2268 1,89 2,23 2252 1,88 2,25 2266 1,9 2,26 Average 2231 1,885 2,25 S.D 62,41 0,013 0,0126
22 | P a g e
Having cultured the cell lines to attain an 80% confluency, transfection of HEK293T and HeLa was done using Fugene HD reagent. 500000 cells per well in a 6 well-Plate in a total volume of 2ml per well with a goal of propagating individual clones containing transfected DNA. Non-transfected cells were distinguished from those that took up the exogenous DNA by drug selection screening of Blasticidin. The control vectors containing the GFP gene in pLenti6.3 V 5 DEST vectors did not show any fluorescence but the GFP in pLenti4 showed fluorescence as shown in fig.9.
Fig.9. HEK293T cells transfected with the GFP in ppLenti4.
After 48h, the cell lines were lysed in RIPA Buffer to collect proteins for western blot. The Thermo Scientific Pierce BCA protein assay kit was used to assay the cell lysates and the absorbance measured in Perkins Elmer’s envision instrument at 562nm. In the thermo Scientific Pierce BCA protein assay method based on bicinchoninic acid (BCA) for the colorimetric detection and quantitation of total protein, Cu+2 is reduced to Cu+1 by protein in an alkaline medium (the biuret reaction) forming a purple-coloured reaction product, as a result of the chelation of two molecules of BCA with one cuprous ion, exhibiting a strong absorbance at 562nm [49]. From the absorbance values shown in table 6, the average absorbance of BSA1 and 2 were utilised to calibrate a standard curve to aid in computing for values of the protein concentrations in the Control, BRAF, EGFR and MEK1 samples as illustrated in table 7, furthermore, the protein concentrations were compared between HeLa and HEK293T cells. Table 6. Absorbance values from BRAF, MEK1, EGFR and Control obtained from HEK293T and HeLa cell lines.
BSA (Average Abs.)
Control GFP BRAF EGFR MEK1 Cell Line A 0,451 0,342 0,273 0,295 0,317 0,272 HEK B 0,393 0,369 0,286 0,335 0,33 0,285 HEK C 0,301 0,382 0,267 0,312 0,302 0,295 HEK D 0,271 0,482 0,354 0,503 0,486 0,466 HeLa E 0,219 0,579 0,351 0,537 0,538 0,528 HeLa F 0,173 0,522 0,362 0,547 0,514 0,496 HeLa G 0,148 H 0,093
23 | P a g e
The average absorbance (unitless) of BSA1 and BSA 2 (BSA average Abs.) were used as the standards for the calibration curve in fig. 10 to determine the concentrations of the proteins in table 7.
Fig.10.Using the standard curve above, the BSA protein concentrations (mg/ml) were determined and the volume required to perform western blots computed for.
The absorbance values were translated into protein concentrations using the calibration curve shown above. In table 7 below, the protein concentration in mg/ml were then determined and even compared between HEK293T and HeLa.
Table 7. Comparisons were made using the 2 cell lines; HeLa lysate harvest yielded more proteins (mg/ml) than HEK 293T.
HeLa cell lines had more protein concentration in mg/ml when compared to HEK293T cell lines.
Next, we ran western blots starting with GAPDH using anti-GAPDH antibody produced in mouse with its corresponding anti- mouse IgG conjugated to Horse radish peroxidase secondary antibody to view the bands in UV light as a 37 KDa protein under chemiluminescence reaction for 5 minutes.
y = 0.3255x + 0.1025 R² = 0.9891 0 0.05 0.1 0.15 0.2 0.25 0.3 0.35 0.4 0.45 0.5 0 0.2 0.4 0.6 0.8 1 1.2 A b sor b an ce (n m ) Protein Conc. (mg/ml)
Standard graph of BSA showing absorbance Vs. Concentration Cell Line Type Control (mg/ml) GFP (mg/ml) BRAF (mg/ml) EGFR (mg/ml) MEK1 (mg/ml) HEK 293T 0,704 0,446 0,558 0,565 0,471 HeLa 1,179 0,679 1,183 1,135 1,089
24 | P a g e
Fig.10, chemiluminescence at 37KDa was seen for GAPDH in all the protein lysate samples. As for the V5- tag, it was further investigated using the V5-Tag mouse mAb produced in mouse with its corresponding anti- mouse IgG conjugated to Horse radish peroxidase secondary antibody so that the blot appeared as shown below. The V5 was supposed to be seen at protein band positions corresponding to the molecular weight of the expressed proteins, the control samples were not supposed to have bands, but our findings showed otherwise. This erroneous result could have been due the secondary antibody; however, no control was run with it only.
Fig.11. The V5 tag showed up at about 27 kDa for both HeLa and HEK293T.
Meanwhile, using MEK1 rabbit Ab with its corresponding secondary anti-rabbit IgG conjugated to Horse radish peroxidase, MEK1 was correctly revealed at about 46 kDa on the immunoblot. However, the anti-MEK antibody also detected MEK1 in the lanes of EGFR and BRAF.
Theoretically, the lanes corresponding to BRAF and EGFR should show no MEK1, however, it could be that MEK1, being an abundant protein and endogenous to all these cell lines, it was detected in all of the transfected cells and cell lines (Fig.12).
250 kDa 150 kDa 100 kDa 75 kDa 50 kDa 37 kDa 25 kDa 20 kDa 15 kDa 10 kDa C o n t r o l G F P B R A F E G F R M E K HeLa HEK293T
25 | P a g e
Fig.12. MEK1 was equally expressed in all of the cell lines and transfectants at 46 kDa; only HEK293T blot has been represented.
Next, the protein samples both in HEK293T and HeLa were analysed by SDS – PAGE, albeit no overexpression was observed.
Fig.13a. SDS- PAGE of HEK 293T. Fig.13b. SDS- PAGE of HeLa Since western blot analyses and SDS-PAGE showed no visual evidences of the recombinant expression by the transfected clones, we further aimed to interrogate the different cell lysates by mass spectrometry analysis.
The idea was first to identify the proteins of interests and secondly to probe whether BRAF, EGFR and MEK proteins increased their expression levels in their respective cells lines, when compared with the expression of the control cells. The workflow was designed in fig.14 below.
198 KDa 98 KDa 62 KDa 49 KDa 38 KDa 28 KDa 17 KDa 6 KDa St an d ar d Con tr ol BR A F EG FR M EK 1
26 | P a g e
Fig.14. Workflow chart observed in performing mass spectrometry.
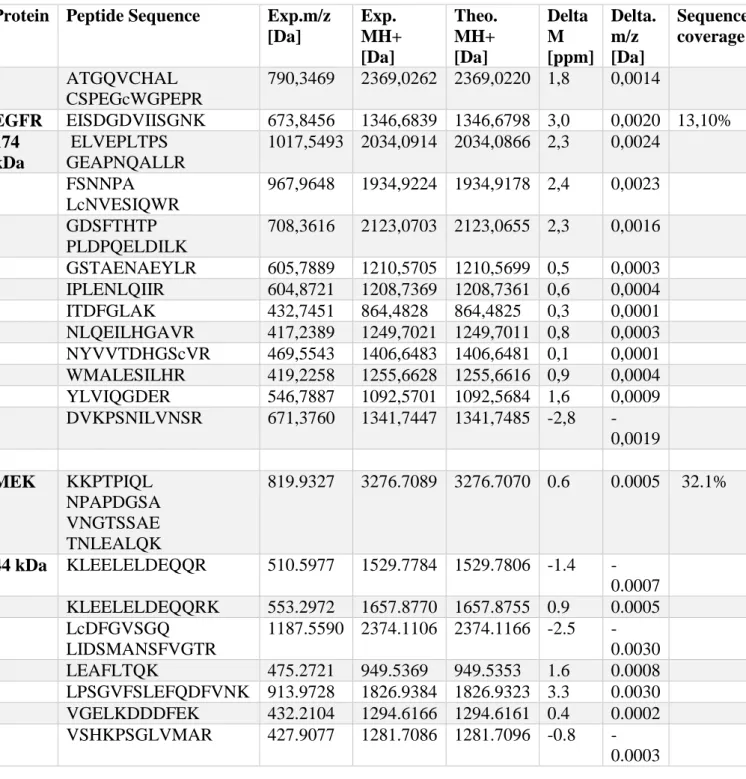
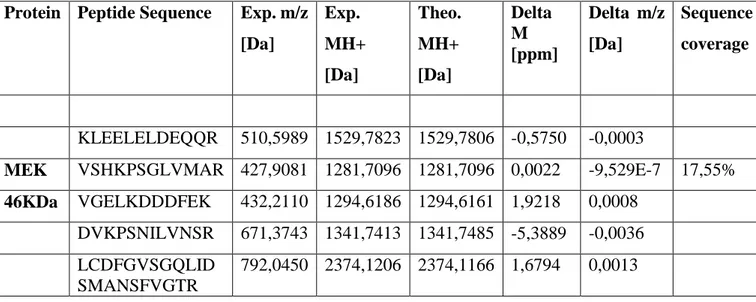
Proteins from cell lysates were denatured and digested with trypsin via the FASP protocol. After a desalting step, the enzymatic digestions were analysed by LC-MS/MS in triplicates and raw data were imported into Proteome Discoverer software for protein identification and relative quantitation. The latter was performed using Top 3 label-free quantification method [53-54]. In this approach, the summed intensity (peak area) of the three best ionising peptides i.e. those with the highest signal intensities for a protein was used as a proxy for its quantity. In the present case, ratios of areas of individual proteins in the transformed cells and in the control provided a measure of the differential protein expression between both samples. Depending on the sample, a range of 2700 to 3000 proteins were identified with high confidence and quantified. BRAF was neither detected in HeLa nor HEK 293T lysates with respect to their respective controls, pointing to a level of low expression for this protein. EGFR was also not detected in HEK293T lysate but it was identified in HeLa lysate with an amino acid sequence coverage of 13.1%. On the other hand, MEK protein was detected both in HeLa and HEK293T lysates with an amino acid sequence coverage of 32.1% and 17.6%, respectively (table 8 and 9).
Moreover, MEK1 protein was also identified in all samples (data not shown) which confirmed and complemented the result obtained by the Western-blot for this protein when anti-MEK antibodies were added in all the cell lysates in fig.12.
By assuming that differential protein expression between the 2 cell lines and their respective control cells followed a normal distribution, defined with 95% confidence (α = 0.05), that 95% of the proteins changed their expression levels within lower and upper limits of tolerance (tolerance interval), the analysis of normalized area ratios showed that, no significant changes occurred in the expression levels of Recombinant MEK1 and EGFR ,in the 2 cell lines compared with their expression in their respective controls (appendix VI, VII and VIII).
Cell lysate
B RAF, EGFR and MEK Cell lysate Control
Reduction of disulfide bridge and cysteine
alkylation
Trypsin digestion (FASP)
RP - C18 Desalting LC - MS/MS
analysis Proteome Discoverer Protein identification and
relative quantitation
27 | P a g e
Table 8. Peptides identified by LC-MS/MS analysis for the proteins EGFR and MEK in HeLa transformed cells.
Protein Peptide Sequence Exp.m/z [Da] Exp. MH+ [Da] Theo. MH+ [Da] Delta M [ppm] Delta. m/z [Da] Sequence coverage ATGQVCHAL CSPEGcWGPEPR 790,3469 2369,0262 2369,0220 1,8 0,0014 EGFR EISDGDVIISGNK 673,8456 1346,6839 1346,6798 3,0 0,0020 13,10% 174 kDa ELVEPLTPS GEAPNQALLR 1017,5493 2034,0914 2034,0866 2,3 0,0024 FSNNPA LcNVESIQWR 967,9648 1934,9224 1934,9178 2,4 0,0023 GDSFTHTP PLDPQELDILK 708,3616 2123,0703 2123,0655 2,3 0,0016 GSTAENAEYLR 605,7889 1210,5705 1210,5699 0,5 0,0003 IPLENLQIIR 604,8721 1208,7369 1208,7361 0,6 0,0004 ITDFGLAK 432,7451 864,4828 864,4825 0,3 0,0001 NLQEILHGAVR 417,2389 1249,7021 1249,7011 0,8 0,0003 NYVVTDHGScVR 469,5543 1406,6483 1406,6481 0,1 0,0001 WMALESILHR 419,2258 1255,6628 1255,6616 0,9 0,0004 YLVIQGDER 546,7887 1092,5701 1092,5684 1,6 0,0009 DVKPSNILVNSR 671,3760 1341,7447 1341,7485 -2,8 -0,0019 MEK KKPTPIQL NPAPDGSA VNGTSSAE TNLEALQK 819.9327 3276.7089 3276.7070 0.6 0.0005 32.1% 44 kDa KLEELELDEQQR 510.5977 1529.7784 1529.7806 -1.4 -0.0007 KLEELELDEQQRK 553.2972 1657.8770 1657.8755 0.9 0.0005 LcDFGVSGQ LIDSMANSFVGTR 1187.5590 2374.1106 2374.1166 -2.5 -0.0030 LEAFLTQK 475.2721 949.5369 949.5353 1.6 0.0008 LPSGVFSLEFQDFVNK 913.9728 1826.9384 1826.9323 3.3 0.0030 VGELKDDDFEK 432.2104 1294.6166 1294.6161 0.4 0.0002 VSHKPSGLVMAR 427.9077 1281.7086 1281.7096 -0.8 -0.0003
28 | P a g e
Table 9. Peptides identified by LC-MS/MS analysis for the proteins MEK in HEK293T transformed cells.
Protein Peptide Sequence Exp. m/z [Da] Exp. MH+ [Da] Theo. MH+ [Da] Delta M [ppm] Delta m/z [Da] Sequence coverage KLEELELDEQQR 510,5989 1529,7823 1529,7806 -0,5750 -0,0003
MEK VSHKPSGLVMAR 427,9081 1281,7096 1281,7096 0,0022 -9,529E-7 17,55%
46KDa VGELKDDDFEK 432,2110 1294,6186 1294,6161 1,9218 0,0008 DVKPSNILVNSR 671,3743 1341,7413 1341,7485 -5,3889 -0,0036 LCDFGVSGQLID
SMANSFVGTR
792,0450 2374,1206 2374,1166 1,6794 0,0013
Furthermore, GFP was not expressed in the pLenti 6.3V5 vector but in pLenti 4 vector system instead thereof, suggesting that this vector system could be troublesome. Indeed, some scientist have shown that in retroviruses, especially lentiviruses, homologous recombination often occurs between the 5’- LTR and 3’- LTR regions causing excision of genes [55-57], making cloning of genes difficult into standard Escherichia coli hosts, we therefore, think that this mishap occurred in the case of BRAF, hence only the vector backbone observed in the restriction digest in fig.8.
We thought that pLenti6.3V5 needed a different experimental condition to grow, so we used low salt LB agar plates and also adjusted the temperature from 37oC to 30oC to try to curb the problematic LTR homologous recombination, but it yielded no fruitful outcome in the E. coli hosts. Other groups that used vector systems having a reduced genome and got tremendous results compared to ours [58].
29 | P a g e
CONCLUSION:
In this project, we made progress; we were able to verify the correct sequence of the gene inserts BRAF, MEK1 and EGFR in the pDNR-DUAL and pDONR221 plasmid vectors. We went further to transfer and verify the cDNA sequences of EGFR and MEK1 successfully into the Gateway compatible pLenti 6.3V5 DEST vectors, however, their transfection into the mammalian cells using the pLenti6.3 V5 DEST yielded futile results, since no overexpression of the EGFR and MEK1proteins was observed.
LC-MS/MS results suggested that the recombinant expressions of either BRAF, EGFR or MEK1 were not successfully obtained in the two mammalian cells lines; HEK293T and HeLa, since their level of expressions were insignificant compared to the expression of their respective endogenous proteins in the controls.
The problem of LTR homologous recombination could have occurred between the 5’- LTR and 3’- LTR regions of the pLenti 6.3 V5 causing excision of genes, especially for BRAF gene. This phenomenon challenged the LR reaction step making restriction digests and sequencing of the genes yield negative results. We tried to combat this challenge of homologous recombination between the 5’- LTR and 3’-LTR, by using low salt agar plates and lowering temperature to 300C, but it also yielded futile results. However, to guarantee successful future uses of lentivirus in gene therapy and recombinant protein expression, other researchers have used tried to use lentiviruses having a reduced size genome and surprisingly, they got positive results. We thought of trying out using lentivirus with a reduced genome, nevertheless, we were constrained by time
This project can be continued either by transfecting new mammalian cells or transferring the 2 gene sequences, EGFR and MEK1, into other forms of pLenti expression vector systems.
30 | P a g e
ACKNOWLEDGEMENT:
I am so grateful to Prof. György Marko-Vaga of Biomedical Center at Lund university and Prof. Joshua LaBaer of the institute of Biodesign at Arizona state university, for coordinating this project. They gladly welcomed me into their labs to carry out all the experimental work needed to accomplish this project.
The Swedish Institute, a government agency that promotes Sweden around the world, has provided me with the scholarship necessary to conduct my Education, a thousand thanks to them!
Lazaro Betancourt, you are appreciated for working faithfully with me at the mass-spec core at the centre of excellence for Biomedical mass spectrometry at Lund University.
Seron Eaton, you are treasured for all the help you gave me while working at the Centre for Personalized Diagnostics at the Institute of Biodesign, Arizona State University.
Justin Saul, Femina Rauf, the members of the sequencing and production team are remembered for the generous help they offered me during the lab work at Biodesign.
I also thank my amazing family for bringing me up in the way that will make society a better place for humankind.
I finally thank my Lord, Jesus Christ who has been there for me to guide, protect and help in times of distress and need, glory.
31 | P a g e
REFERENCES:
[1]. Sliwkowski MX. In: Harris JR, Lippman ME, Morrow M, Osborne CK, eds. (2004) Diseases of the Breast. 3rd ed. Philadelphia, PA: Lippincott Williams & Wilkins. pp415-426.
[2]. Burgess AW, Cho HS, Elgenbrot C, et al. (2003). An open-and-shut case? Recent insights into the activation of EGF/ErbB receptors. Mol Cell.12:541-542.
[3]. Olayioye MA, Neve RM, Lane HA, Hynes NE. (2000) The ErbB signaling network: receptor heterodimerization in development and cancer. EMBO J. 19:3159-3167.
[4]. Ménard S, Tagliabue E, Campiglio M, Pupa SM. (2000). Role of HER2 gene overexpression in breast carcinoma. J Cell Physiol. 281:150-162.
[5]. Graus-Porta D, Beerli RR, Daly JM, Hynes NE. (1997). ErbB-2, the preferred heterodimerization partner of all ErbB receptors, is a mediator of lateral signaling. EMBO J. 16:1647-1655.
[6]. Tomas A. et al. (2014) EGF receptor trafficking: consequences for signaling and cancer. Rev. Trends in Cell Biology; 24 (1): 26 – 34
[7]. Kim L.C. et al. (2009). Src Kinases as therapeutic targets for cancer. Nat.Rev. Clin.Oncol. 6, 587 – 595
[8]. Irby R.B. and Yeatman T.J. (2000). Role of Src expression and activation in human cancer. Oncogene 19, 5636 – 5642.
[9]. Ménard S, Tagliabue E, Campiglio M, Pupa SM. (2000). Role of HER2 gene overexpression in breast carcinoma. J Cell Physiol. 281:150-162.
[10]. Knight T, Irving JA. (2014) Ras/Raf/MEK/ERK pathway activation in childhood acute lymphoblastic leukemia and its therapeutic targeting. Front Oncol. 4:160
[11]. Santarpia L, Lippman SL, El-Naggar AK. (2012). Targeting the mitogen-activated protein kinase RAS-RAF signaling pathway in cancer therapy. Expert Opin Ther Targets.16:103-119 [12]. Cseh B, Doma E, Baccarini M. (2014). “RAF” neighborhood: protein-protein interaction in the Raf/Mek/Erk pathway. FEBS Lett.588:2398-2406.
[13]. Rauen KA. (2013). The RASopathies. Annu Rev Genomics Hum Genet. 14:355-369. [14]. Chappell WH, Steelman LS, Long JM, et al. (2011). Ras/Raf/MEK/ERK and PI3K/PTEN/Akt/mTOR inhibitors: rationale and importance to inhibiting these pathways in human health. Oncotarget.2:135-164.
[15]. Urick ME, Chung EJ, Shield WP III, et al. (2011) Enhancement of 5-fluorouracil-induced in vitro and in vivo radiosensitization with MEK inhibition. Clin Cancer Res.17:5038-5047. [16]. Ott PA, Bhardwaj N. (2013) Impact of MAPK pathway activation in BRAFV600 melanoma on T cell and dendritic cell function. Front Immunol.4:346.
[17]. Burrows N, Babur M, Resch J, Williams KJ, Brabant G. (2011). Hypoxia-inducible factor in thyroid carcinoma. J Thyroid Res.2011:762905.
[18]. Cantwell-Dorris ER, O’Leary JJ, Sheils OM. (2011). BRAFV600E: implications for carcinogenesis and molecular therapy. Mol Cancer Ther.10:385-394.
[19]. Wang AX, Qi XY. (2013). Targeting RAS/RAF/MEK/ERK signalling in metastatic melanoma. IUBMB Life. 65:748-758.
32 | P a g e
[20]. Ascierto PA, Kirkwood JM, Gob JJ, et all. (2012). The role of BRAF V600 mutation in melanoma. J Transl Med. 10:85.
[21] Kim EK, Choi EJ (2010) Pathological roles of MAPK signaling pathways in human diseases. Biochim. Biophys. Acta 1802(4), 396–405
[22]. Burgermeister E, Chuderland D, Hanoch T, Meyer M, Liscovitch M, Seger R. (2007). Interaction with MEK causes nuclear export and downregulation of peroxisome proliferator- activated receptor gamma. Mol. Cell. Biol. 27: 803- 817.
[23].Naldini, L.; Blomer, U.; Gage, F.H.; Trono, D.; Verma, I.M. ( 1996). Efficient transfer, integration, and sustained long-term expression of the transgene in adult rat brains injected with a lentiviral vector. Proc. Natl. Acad. Sci. USA. 93:11382-11388.
[24]. Naldini L, Blomer U, Gallay P, Ory D, Mulligan R, Gage FH, Verma IM, Trono D. (1996). In vivo gene delivery and stable transduction of nondividing cells by a lentiviral vector. Science. 272:263-267
[25]. Zaiss, AK, Son S, Chang LJ. (2002). RNA 3' read through of oncoretrovirus and lentivirus: implications for vector safety and efficacy. J. Virol. 76: 7209-7219.
[26]. Escors D, Breckpot K, Arce F, Kochan G, Stephenson H. (2012). Lentiviral Vectors and Gene Therapy. New York: Springer; Chapter 2, Development of Retroviral and Lentiviral Vectors; p.11-28.
[27]. Warnock J, Daigre C, Al-Rubeai M. (2011). Introduction to viral vectors. Methods Mol Biol. 737:1-25
[28]. Zhou X, Evans S, Han X, Liu Y, Yu X. (2012). Characterization of the interaction of full-length HIV-1 Vif protein with its key regulator CBFβ and CRL5 E3 ubiquitin ligase components. PLoS ONE. 7: e33495.
[29]. Freed E. (2001) HIV-1 replication. Somat Cell Mol Genet. 26:13-33
[30]. Fanales-Belasio E, Raimondo M, Suligoi B, Butto S. (2010). HIV virology and pathogenetic mechanisms of infection: a brief overview. Ann Ist Super Sanita.46:5-14
[31]. Barker E, Planelles V. (2003). Vectors derived from the human immunodeficiency virus, HIV-1. Front Biosci.8: d491-510
[32]. Dull, T., Zufferey, R., Kelly, M., Mandel, R. J., Nguyen, M., Trono, D., and Naldini, L. (1998) A Third-Generation Lentivirus Vector with a Conditional Packaging System. J. Virol. 72, 8463-8471
[33]. Luciw, P. A. (1996) in Fields Virology (Fields, B. N., Knipe, D. M., Howley, P. M., Chanock, R. M., Melnick, J. L., Monath, T. P., Roizman, B., and Straus, S. E., eds), 3rd Ed., pp. 1881-1975, Lippincott-Raven Publishers, Philadelphia, PA
[34]. Kjems, J., Brown, M., Chang, D. D., and Sharp, P. A. (1991) Structural Analysis of the Interaction Between the Human Immunodeficiency Virus Rev Protein and the Rev Response Element. Proc. Natl. Acad. Sci. USA 88, 683-687
[35]. Malim, M. H., Hauber, J., Le, S. Y., Maizel, J. V., and Cullen, B. R. (1989) The HIV-1 Rev Trans-activator Acts Through a Structured Target Sequence to Activate Nuclear Export of Unspliced Viral mRNA. Nature 338, 254-257
[36]. Izumi, M., Miyazawa, H., Kamakura, T., Yamaguchi, I., Endo, T., and Hanaoka, F. (1991) Blasticidin S Resistance Gene (bsr): A Novel Selectable Marker for Mammalian Cells. Exp. Cell Res. 197, 229- 233