VTI rapport 595A Published 2007
www.vti.se/publications
Tilting trains
Description and analysis of the present situation
Literature study
Publisher: Publication:
VTI rapport 595A
Published: 2007 Project code: 40594 Dnr: 2004/0461-26
SE-581 95 Linköping Sweden Project:
Tilting trains
Author: Sponsor:
Rickard Persson Banverket (Swedish rail administration) and Swedish Governmental Agency for
Innovation Systems (Vinnova)
Title:
Tilting trains – Description and analysis of the present situation. A literature study
Abstract (background, aim, method, result) max 200 words:
Growing competition from other modes of transportation has forced railway companies throughout the world to search for increased performance. Travelling time is the most obvious performance indicator that may be improved by introducing high-speed trains. Trains with capability to tilt the bodies inwards the curve is a less costly alternative than building new lines with large curve radii, which is needed for the non-tilted high-speed trains.
Today, tilting has become a mature technology accepted by most operators, but not favoured by many. Research has been conducted on areas with potential to improve the competitiveness of tilting trains. Track shift force may be critical for a high-speed tilting train and improved levels of track irregularities must be considered. The risk of overturning may give restriction on cant deficiency at high speeds. Motion sickness in both non-tilting and tilting trains is still being reported. The sensory conflict is the most common explanation of motion sickness.
The running times improve with increased cant deficiency, top speed and tractive performance; however the benefit of increased top speed and tractive performance is small above a certain level.
Guidelines for installation of cant are given that optimize the counteracting requirements on good comfort in non-tilting trains and low risk of motion sickness in tilting trains.
Keywords:
Utgivare: Publikation:
VTI rapport 595A
Utgivningsår: 2007 Projektnummer: 40594 Dnr: 2004/0461-26 581 95 Linköping Projektnamn: Korglutning Författare: Uppdragsgivare:
Rickard Persson Banverket (Gröna Tåget) och Vinnova
Titel:
Korglutade tåg – beskrivning och analys av dagsläget. En litteraturstudie
Referat (bakgrund, syfte, metod, resultat) max 200 ord:
Ökande konkurrens från andra transportmedel tvingar järnvägsföretag över värden att söka efter bättre prestanda. Restid är den mest uppenbara prestandaindikatorn som kan förbättras genom att introducera höghastighetståg. Tåg med förmågan att luta korgarna inåt i kurvor är ett mindre kostsamt alternativ än att bygga nya linjer med de stora kurvradier som behövs för icke korglutade höghastighetståg.
Idag har korglutning blivit en mogen teknik som accepteras av de flesta operatörer, men föredras av få. Forskning har bedrivits inom områden med potential att förbättra konkurrenskraften hos korglutade tåg. Spårförskjutningskraften kan bli kristisk för ett korglutat höghastighetståg och förbättrade nivåer av spårfel måste övervägas. Risken för fordonsvältning kan ge restriktioner på tillåten rälsförhöjningsbrist i höga hastigheter.
Åksjuka i tåg både med och utan korglutning rapporteras fortfarande. Den sensoriska konflikten är den vanligaste förklaringen till uppkomsten av åksjuka.
Restiden minskar med ökad rälsförhöjningsbrist, topphastighet och traktionsprestanda, men nyttan av ökad topphastighet och traktionsprestanda är liten över en viss nivå.
I rapporten ges vägledning för installation av rälsförhöjning som optimerar de motstridiga kraven på god komfort i tåg utan korgluting och låg risk för åksjuka i tåg med korglutning.
Preface
This study has been carried out at the Swedish National Road and Transport Research Institute (VTI), Linköping, in cooperation with the Royal Institute of Technology, Department of Railway Technology, (KTH) in Stockholm.
This study is part of the project Gröna tåget (the Green Train).
The financial support from Vinnova and Banverket (Swedish rail administration) is acknowledged.
This report covers tilting trains and tilting technology and gives an analysis of the present situation.
Linköping October 2007
Quality review
Review seminar was carried out on 2006-06-01 where Nils Nilstam, Interfleet, and Oskar Fröidh, KTH, reviewed and commented on the report. The author Rickard Persson has made alterations to the final manuscript of the report 2007-09-20. The research director of the project manager Lena Nilsson, VTI, examined and approved the report for publication on 2007-09-24.
Kvalitetsgranskning
Granskningsseminarium genomfört 2006-06-01 där Nils Nilstam, Interfleet, och Oskar Fröidh, KTH, var lektörer. Författaren Rickard Persson har genomfört justeringar av slutligt rapportmanus 2007-09-20. Projektledarens närmaste chef Lena Nilsson, VTI, har därefter granskat och godkänt publikationen för publicering 2007-09-24.
Table of contents
Summary ... 5
Sammanfattning ... 7
1 Introduction ... 9
1.1 Background to the present study ... 9
1.2 Objective and approach of the present study... 9
2 The concept of tilting trains ... 10
3 Vehicles ... 12
3.1 Tilting trains of the world + trends ... 12
3.2 Tilt technology and trends... 14
3.3 Summary ... 17
4 Track... 18
4.1 Design track geometry, terms and definitions ... 18
4.2 National standards in Sweden ... 20
4.3 Standards of European committee of standardization ... 21
4.4 Technical Specifications of Interoperability ... 21
4.5 Track irregularities ... 22
4.6 Analysis of track geometry... 24
4.7 Summary ... 26
5 Track – vehicle interaction ... 28
5.1 Track forces ... 28
5.2 Wheel / rail wear ... 31
5.3 Passenger ride comfort... 34
5.4 Cross-wind stability ... 37
5.5 Summary ... 40
6 Motion sickness ... 41
6.1 Evidence of motion sickness... 41
6.2 Hypothesis of motion sickness... 41
6.3 Deriving models of motion sickness... 42
6.4 Models of motion sickness... 44
6.5 Time dependence of motion sickness... 45
6.6 Calculation of net doses based on ideal track geometry... 46
6.7 How can motion quantities be limited? ... 47
6.8 Summary ... 47
7 Winter properties ... 48
7.1 Lift of ballast stones ... 48
7.2 Snow packing ... 50
7.3 Summary ... 51
8 Analysis of vehicle and infrastructure ... 52
8.1 Vehicles ... 52
8.2 Infrastructure... 53
9 Analysis of services suitable for tilting trains... 58
9.1 Running time – cant deficiency, top speed or tractive performance... 58
9.2 Performance of X2000 ... 58
9.3 Performance of a new tilting train ... 60
9.4 Distance between stops... 66
9.5 New tracks, for tilting or high-speed trains? ... 68
9.6 Upgrading tracks or tilting trains ... 71
9.7 Summary ... 73
10 Discussion and conclusions... 74
10.1 Discussion ... 74
10.2 Conclusions ... 76
10.3 Suggestions for further research... 77
References ... 78
Appendices
Appendix A Symbols Appendix B Abbreviations
Tilting trains – Description and analysis of the present situation. A literature study
by Rickard Persson
VTI (Swedish National Road and Transport Research Institute) SE-581 95 Linköping Sweden
Summary
Growing competition from other modes of transportation has forced railway companies throughout the world to search for increased performance. Travelling time is the most obvious performance indicator that may be improved by introducing high-speed trains. Trains with capability to tilt the bodies inwards the curve is a less costly alternative than building new lines with large curve radii, which is needed for the non-tilted high-speed trains.
Today, tilting has become a mature technology accepted by most operators, but not favoured by many. There are different reasons behind this fact; the non-tilting trains have increased their speed on curves (however at a reduced level of ride comfort), reducing the potential for travelling time reduction by tilting trains to approximately 10–15%. The popularity is also affected by low reliability and motion sickness on certain tilting trains.
Tilting trains can today be purchased from all the major train suppliers. The top speed of tilting trains follows the trend towards higher speeds. The first tilting train with top speed above 250 km/h will be set into service in 2007 in Japan, the Shinkansen N700. Track shift force may be critical for a high-speed tilting train and improved levels of track irregularities must be considered. The risk of overturning may give restriction on cant deficiency at high speeds.
Evidence of motion sickness in both non-tilting and tilting trains has been and is still being reported. The sensory conflict is the most common explanation of motion sick-ness. The latest research suggests a model based on vertical acceleration. The model corresponds well to the hypothesis of motion sickness and can, together with suitable time dependence, describe the degree of motion sickness as function of time. The model is contradictory to earlier research which showed an optimum tilt angle different from zero.
The running times improve with increased cant deficiency, top speed and tractive performance; however the benefit of increased top speed and tractive performance is small above a certain level. 15 minutes running time (9%) may be gained on the Swedish line Stockholm–Gothenburg if cant deficiency, top speed and tractive performance are improved compared with existing tilting trains. One interesting conclusion is that a non-tilting train will, independent of top speed and tractive power, have longer running times than a tilting train with today’s maximum speed and tractive power.
Guidelines for installation of cant are given optimizing the counteracting requirements on good comfort in non-tilting trains and low risk of motion sickness in tilting trains. The guidelines are finally compared with the installed cant on the Stockholm–
Korglutade tåg – beskrivning och analys av dagsläget. En litteraturstudie
av Rickard Persson VTI
581 95 Linköping
Sammanfattning
Ökande konkurrens från andra transportmedel tvingar järnvägsföretag över världen att söka efter bättre prestanda. Restid är den mest uppenbara prestandaindikatorn som kan förbättras genom att introducera höghastighetståg. Tåg med förmågan att luta korgarna inåt i kurvor är ett mindre kostsamt alternativ än att bygga nya linjer med de stora kurvradier som behövs för icke korglutade höghastighetståg.
Idag har korglutning blivit en mogen teknik som accepteras av de flesta operatörer, men föredras av få. Det är flera anledningar bakom detta; tågen utan korglutning har ökat sin hastighet i kurvorna (dock med minskad åkkomfort som resultat), vilket minskar
potentialen för restidsminskning med korglutade tåg till 10–15 %. Populäriteten på-verkas också av låg tillförlitlighet och åksjuka på viss korglutad trafik.
Korglutade tåg kan idag köpas från alla de större fordonstillverkarna. Topphastigheten på korglutade tåg följer trenden mot högre hastigheter. Det första korglutade tåget med topphastighet över 250 km/h kommer att sättas i trafik under 2007 i Japan, Shinkansen N700.
Spårförskjutningskraften kan bli kristisk för ett korglutat höghastighetståg och för-bättrade nivåer av spårfel måste övervägas. Övervägas måste också risken för fordons-vältning som kan ge restriktioner på tillåten rälsförhöjningsbrist i höga hastigheter. Åksjuka i tåg både med och utan korglutning rapporteras fortfarande. Den sensoriska konflikten är den vanligaste förklaringen till uppkomsten av åksjuka. Den senaste forsk-ningen föreslår en modell baserad på vertikalacceleration som indata. Detta stämmer väl med olika hypoteser över uppkomsten av åksjuka och kan tillsammans med lämpligt tidsberoende beskriva graden av åksjuka som funktion av tiden. Modellen ger i motsats till tidigare modeller en optimal lutningsvinkel lika med noll.
Restiden minskar med ökad rälsförhöjningsbrist, topphastighet och traktionsprestanda, men nyttan av ökad topphastighet och traktionsprestanda är liten över en viss nivå. På den svenska linjen mellan Stockholm och Göteborg kan 15 minuters restid (9 %) sparas om rälsförhöjningsbrist, topphastighet och traktionsprestanda förbättras jämfört med dagens korglutade tåg. En intressant slutsats är att ett tåg utan korglutning kommer, oberoende av rälsförhöjningsbrist, topphastighet och traktionsprestanda, ha längre restid än dagens korglutade tåg med sin rälsförhöjningsbrist, topphastighet och
traktionsprestanda.
I rapporten ges vägledning för installation av rälsförhöjning som optimerar de
motstridiga kraven på god komfort i tåg utan korgluting och låg risk för åksjuka i tåg med korglutning. Denna vägledning jämförs slutligen med verklig rälsförhöjning på linjen Stockholm–Göteborg.
1 Introduction
1.1
Background to the present study
Growing competition from other means of transportation has forced railway companies throughout the world to search for increased performance. Travelling time is the most obvious performance indicator that may be improved by introducing high-speed trains. High-speed trains requires straight track or at least tracks with large curve radii and long transition curves not to impair the ride comfort, another performance indicator. Building new tracks with large curve radii is costly and can only be justified where the passenger base is large.
Trains with capability to tilt the bodies inwards the curve is a less costly alternative than building new tracks with large curve radii. The tilt inwards reduces the centrifugal force felt by the passengers, allowing the train to pass curves at enhanced speed with
maintained ride comfort. Trains capable to tilt the bodies inwards is often called tilting trains.
Tilting has today become a mature technology accepted by most operators, but not favoured by many. There are different reasons behind this fact; the non-tilting trains have increased their speed in curves (however at a reduced level of ride comfort), reducing the potential for travelling time reduction by tilting trains to approximately 10–15%. The popularity is also impacted by low reliability and motion sickness on certain services.
International Union of Railways (UIC) [1998] and [2005b] has reported on Tilting Train technology where tilting trains and known tilting technology are described briefly. This report covers tilting trains and known tilting technology as well as an analysis of the present situation.
1.2
Objective and approach of the present study
The objective with this study is to identify areas where the competitiveness of tilting trains can be improved and to conduct further research on identified areas.
The research is divided in two stages with different aims and activities. The aims and activities in a later stage will be depending on the results of earlier stages.
Stage 1
− To make an overview of the present situation on technology, knowledge and development trends.
− To identify areas where research can improve the competitiveness of tilting trains.
Stage 2
− To conduct research on one or more areas identified at stage 1.
The present research report summarises stage 1. This report is divided in two main parts, the first, chapters 2 to 7 covers knowledge found in the literature study. Chapters 8 to 10 covers analysis made within this study with the aim to identify areas where research can improve the competitiveness of tilting trains.
2
The concept of tilting trains
A train and its passengers are subject to centrifugal forces when the train passes horizontal curves. Roll inwards reduces the centrifugal force felt by the passengers allowing the train to pass curves at enhanced speed with maintained ride comfort. Roll may be achieved by track cant, or when the track cant is insufficient, carbody tilt. Trains capable to tilt the bodies inwards is often called tilting trains. The tilting trains can be divided in two groups, the passively tilted trains, called natural tilted trains in Japan, and the actively tilted trains (active tilt is called forced tilt in certain publications).
The passive tilt relies on natural laws with a tilt centre located well above the centre of gravity of the carbody. On a curve, under the influence of centrifugal force, the lower part of the carbody swings outwards. It should be noted that passive tilt has a negative impact on safety due to the lateral shift of centre of gravity of the carbody.
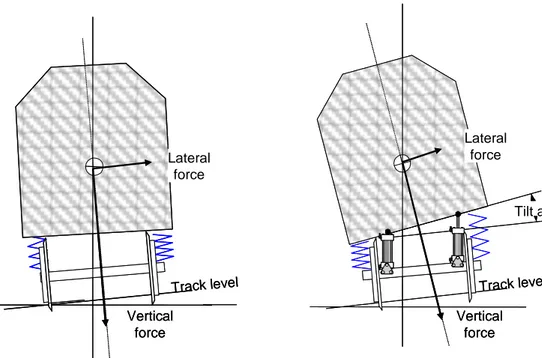
The active tilt relies on active technology, controlled by a controller and executed by an actuator. Tilt as such has normally not an impact on safety on actively tilted train. The basic concept of tilting trains is the roll of the vehicle bodies inwards the curve in order to reduce the lateral force perceived by the passenger, Figure 2-1.
Track level Tilt angle Lateral force Track level Vertical force Lateral force Vertical force Track level Tilt angle Lateral force Track level Vertical force Lateral force Vertical force
Figure 2-1 The basic concept of tilting trains.
Despite the higher track plane acceleration for the tilting train (right), the lateral force in the carbody is lower.
When a vehicle is running on a horizontal curve there will be a horizontal acceleration which is a function of speed v and curve radius R.
R v
ah
2
= [2-1]
The acceleration in the track plane can be reduced compared with the horizontal
track plane is a function of the track cant and the distance 2 b⋅ between the two contact 0 points of a wheelset. ) 2 arctan( 0 b D t ⋅ = ϕ [2-2]
The acceleration perceived by the passenger can be further reduced compared with the track plane acceleration by arranging a carbody tilt angle ϕc. The acceleration in the carbody is normally called lateral acceleration and is denoted as . The acceleration in the perpendicular direction is normally called vertical acceleration and is denoted as .
y&& z&& ) sin( ) cos( 2 c t c t g R v y&&= ⋅ ϕ +ϕ − ⋅ ϕ +ϕ [2-3] ) cos( ) sin( 2 c t c t g R v z&&= ⋅ ϕ +ϕ + ⋅ ϕ +ϕ [2-4]
A reduction of lateral acceleration by increased track cant or carbody tilt is correlated with a slightly increased vertical acceleration. Typical values for lateral and vertical acceleration are shown in Table 2-1.
Table 2-1 Certain typical values for motion quantities on a horizontal curve.
Speed v [km/h] Radius R [m] Track cant D [mm] Carbody tilt angle ϕc [degrees] Lateral acceleration [m/s y&& 2] Vertical acceleration [m/s z&& 2]1) 113 1,000 0 0 0.983) 0 113 1,000 150 0 0 0.05 160 1,000 150 0 0.983) 0.15 166 1,000 150 6.52) 0 0.23 201 1,000 150 6.52) 0.98 0.44
1) The vertical acceleration is here given as offset from g. 2) This tilt angle corresponds to an actively tilted train.
3 Vehicles
3.1
Tilting trains of the world + trends
The first considerations and experiments on reducing the centrifugal force felt by the passenger and thereby allowing higher speeds in curves date from the late 1930s, Deischl [1937] and Van Dorn & Beemer [1938]. In 1938, Pullman built for the
Atchison, Topeka and Santa Fe Railway an experimental pendulum coach, but the lack of damping produced a sea-sickness inducing rolling motion, Wikipedia [2006]. The novel designs where based on passive technology. In 1956, Pullman-Standard built two train sets, called Train-X, that become the first tilting trains in commercial service. The trains were withdrawn from service after as short period due to poor running behaviour. The first large series of tilting trains were the Japanese class 381, which started to run between Nagoya and Nagano in 1973. In 1980, the first tilting Talgo train was put into service between Madrid and Zaragoza in Spain. All these trains had passive (or natural) tilt.
Active technology was introduced 1957 when La Société Nationale des Chemins de Fer (SNCF) built a vehicle that could tilt up to 18 degrees. Deutsche Bahn (DB) converted 1965 a diesel multiple unit series 624 for tilt. In 1972 a tilting version of series 624 called series 634 were put into service on the line Cologne – Saarbrucken as the first actively tilted train in commercial service.
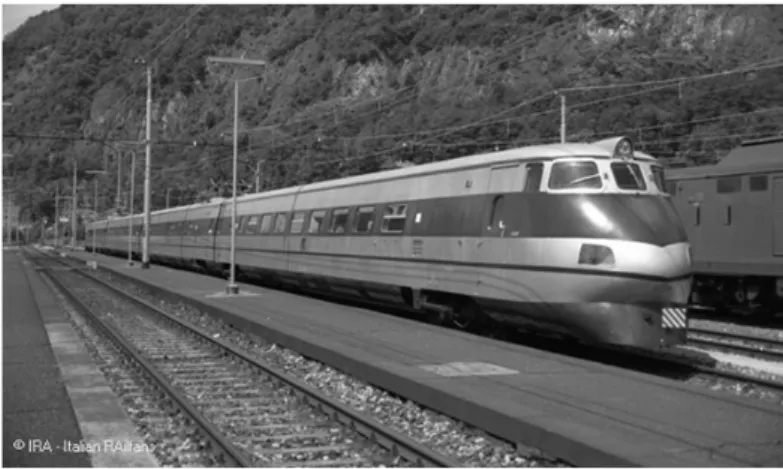
One important development chain for the actively tilting trains was the development of the Pendolino trains, which started 1969 with a prototype tilting railcar, the Y0160. The prototype was 1975 followed by ETR401, which become the first Pendolino in commer-cial service, Figure 3-1.
Figure 3-1 The Italian Railways ETR401, Photo by Paolo Zanin.
British Rail gained a lot of experience with their prototype tilting train, the Advanced Passenger Train (APT). One example is the comfort indexes PCT and PDE, which were
developed from test with APT, Harborough [1986]. The trains featured a lot of new developments, with the drawback of poor reliability. The project was finally abandoned, and some patents were sold to FIAT which applied the knowledge on the later intro-duced ETR450.
The break-through for actively tilted trains came around 1990 when introduction of large series, like the ETR450 in Italy and the X2000 in Sweden, started. At the same
carbodies, have been produced world-wide by different suppliers. Table 3-1, gives a list of, for the development tilt, certain important vehicles, a list of tilting vehicles that are in or have been in service is found in Appendix B.
Table 3-1 Certain important vehicles in the development of tilt technology. Developer Product Year Top
speed [km/h] Tilt actuation Comment Pullman – Standard 1)
Train-X 1956 ? Passive First tilting vehicle in service SNCF – 1957 ? ? First vehicle with active tilt FS/FIAT Y0160 1969 200 Hydraulic First vehicle of FIAT technology DB 634 1972 140 Pneumatic First vehicle with active tilt in
service
BR APT-E 1972 240 Hydraulic The comfort indexes PCT and
PDE were developed
JR/Hitachi 381 1973 120 Passive First vehicle on Hitachi technology
FS/FIAT ETR401 1975 171 Hydraulic First vehicle of FIAT technology in service
SJ/ASEA X15 1975 200 Pneum. /
Hydraulic
First vehicle of ASEA technology
Talgo Pendular 1980 180 Passive First tilting Talgo
FS/FIAT ETR450 1989 250 Hydraulic Highest top speed of trains in service
JR/Hitachi 2000 1989 130 Passive + Pneumatic
First vehicle using stored track data
ASEA/ABB X2000 1990 200 Hydraulic First vehicle of ASEA technology in service AEG VT611 1997 160 El-Mech. First vehicle with
electro-mechanical actuators JR/Hitachi N700 2007? 300 Pneumatic First tilting vehicle in service
with top speed above 250 km/h?
1) The design was based on a Talgo patent.
The early developments on actively tilting trains in Europe were initiated by the operators like SNCF and DB. In the late 60s, Ferrovie dello stato (FS) joined forces with FIAT that led to the construction of a prototype tilting railcar, the Y0160, which is the predecessor of the Pendolino. Swedish State Railways (SJ) and ASEA had a joint venture with the X15, which gave the tilting technology to X2000. Today most train development is performed by the suppliers, a statement also valid for tilting trains. In fact, the tilt technology has become that mature that the development has been partly transferred to the sub-suppliers, like Extel Systems Wedel (ESW) and Curtiss-Wright which supplies tilt systems based on electro-mechanical actuators.
of 120 km/h in service. Narrow gauge trains in Japan have still only 130 km/h as maxi-mum speed, when the tilting trains in Europe have at least 160 km/h as maximaxi-mum speed. The Acela trains in USA has 240 km/h as top speed, but still the Pendolino trains, ETR450, ETR460 and ETR480 in Italy have the highest maximum speed of all tilting trains in service, 250 km/h, see Figure 3-2. However, the Italian tilting trains runs at the same speed as Italian non-tilting trains at speeds above 200 km/h, Casini [2005].
Research on trains, which combines top speeds higher than 250 km/h and tilting capability, has been performed by SNCF/Alstom (tilting TGV) and JR/Hitachi (tilting Shinkansen series N700). The latter is planned to enter service 2007 with a top speed of 300 km/h, a maximum cant deficiency of 154 mm and a maximum tilt angle of 1°.
0 50 100 150 200 250 300 1970 1980 1990 2000 2010 1st year in service M a xi m u m ser v ic e sp eed [ k m /h ]
Figure 3-2 Top speed as function of 1st year of service.
3.2
Tilt technology and trends
Two parallel development chains may be seen in tilt technology, one based on passive or natural tilt as it is called in Japan and one on active tilt. The passive tilt relies on natural laws with a tilt centre located well above the centre of gravity of the carbody. On a curve, under the influence of the centrifugal force, the lower part of the carbody swings outwards. The designer must consider the trade-off between damping (i.e. small “swinging” motions) and fast response. The series 2,000 trains in Japan was the first train were active tilt support where added to a passively tilted train to enhance performance.
Some of the first actively tilting trains relied on active technology based on pneumatic systems, where air was shifted from one side to the other of the air suspension. An important technology step come with rollers and pendulums which carry the carbody load and provide movement possibility. The movement may then be controlled by an actuator that not has to carry the carbody load, resulting in much lower energy consumption.
the carbody. The electro-mechanical actuators showed advantages and become an alternative in 1990s. These systems consist of actuators placed in the bogie and an electric power pack with converter placed in the underframe of the carbody, Figure 3-3.
Figure 3-3 Electromechanical actuator, ESW [2006].
The electro-hydraulic actuator becomes an alternative in the next generation of tilting trains. These systems consist of the same components as the electro-mechanical actuator, but the mechanical gear in the actuator is replaced by a pump and a cylinder, Enomoto [2005].
The actively tilted trains need some kind of control system. Novel systems applied a body feedback with an accelerometer placed in the carbody as transducer. The body feedback systems had stability problems due to low-frequency movements in the
secondary suspension, forcing development of the bolster feedback systems. The bolster feedback systems uses transducers placed in the tilted part of the bogie. A reference transducer in the non-tilted part of the bogie give the advantage of allowing partial compensation of the lateral acceleration, Figure 3-4, which have an positive impact on motion sickness, Förstberg [2000].
Controller Actuator Body
Body accelerometer
Body feedback
Controller Actuator Body Bogie accelerometer Reference transducer Position transducer Bolster feedback Controller Actuator Body
Bogie accelerometer
Controller Actuator Body
Body accelerometer
Body feedback
Controller Actuator Body Bogie accelerometer Reference transducer Position transducer Bolster feedback Controller Actuator Body
Bogie accelerometer
Figure 3-4 Block diagram of tilting system layouts.
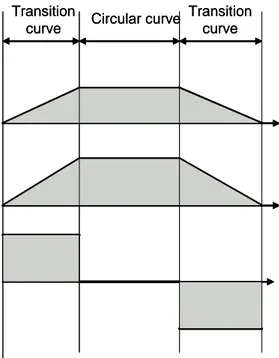
There are different kinds of information sources that can be used as reference trans-ducer. The obvious one is the lateral acceleration, but also roll and yaw velocity may be used. Most tilting trains use more than one source as base for its control. The typical
Circular curve Transition curve Transition curve Lateral acceleration Yaw velocity Roll velocity Circular curve Transition curve Transition curve Lateral acceleration Yaw velocity Roll velocity
Figure 3-5 Information sources and their typical behaviour.
Assuming that the speed is constant the sources have following properties: 1. Lateral acceleration measured in the bogie has a close relation to the cant
deficiency at track level. The lateral acceleration changes on transition curves
and receives a constant value on the circular curve. The lateral acceleration can in principle be used directly as a lead value base.
2. Yaw velocity measured in the bogie has a relation to curve radius and speed. The yaw velocity changes in transition curves and receives a constant value in the circular curve. The relation to curve radius and speed means that the cant and speed must be considered before yaw velocity can be used as lead value base. 3. Roll velocity measured in the bogie has a relation to the rate of change of cant of
the track. The roll velocity receives a non-zero value in the cant transition when the installed cant changes and a zero in the circular curve when the installed cant is kept constant. The roll velocity is an excellent indicator of cant transitions, which may be used to switch between different control strategies.
All three sources have zero value on straight track.
Japanese tilting trains uses wayside information to improve the performance. The system is combined with the Automatic Train Protection (ATP) system, where timing information is send from a way-side element to the ATP system in the train and further to the tilt controller. The track data is stored on board the train. The Spanish supplier Construcciones y Auxiliar de Ferrocarriles (CAF) has in series R-598 showed that a system based on stored track data can work without wayside input, Gimenez & Garcia [1997]. The stored track data can either be based on a track data register or on train measured track data. A positioning system is needed to pick the right track data at the right time.
Sasaki [2005] give four different information sources to the positioning system: 1. Way-side beacons.
2. Global Positioning System (GPS) and comparison with line map. 3. Comparing the measured curvature with line data.
4. Integrating the speed signal.
Sasaki show how sources 2 to 4 can be combined with 1. All four sources can be used together by selection the best source at each moment. The accuracy has been tested and found to better than 4 metres, the accuracy for the GPS alone was 34 meters. 10 metres accuracy is assumed by Sasaki as limit for tilting timing purpose.
3.3 Summary
Tilting trains can today be purchased from all the major train suppliers. The top speed of tilting trains follows the trend towards higher speeds. The first tilting train with top speed above 250 km/h will be set into service in 2007 in Japan, the Shinkansen N700. It should be noted that the maximum cant deficiency will be similar to Swedish non-tilting passenger trains.
Different means of actuation exists for the active carbody tilt, different suppliers prefer different solutions. Common is that actuation can be bought from sub-suppliers. Control systems using stored track data has entered the market and this is a trend that likely will continue.
4 Track
4.1
Design track geometry, terms and definitions
Track gauge
Track gauge is the distance between the inner faces of the rail heads of the track. The track gauge is measured 14 mm below the top of the rail on the inner face. Standard track gauge is 4 feet, 8-1/2 inches or approximately 1,435 mm.
Circular horizontal curve
Circular horizontal curve is a curve in the horizontal plane with constant radius. The circular horizontal curve is characterized by its radius R which is related to the track centre line. The circular horizontal curve may also be characterized by its curvature which the inverse to the radius.
Transition curve
Transition curves are used to connect straight track to circular horizontal curves or to connect two circular horizontal curves. The transition curve is characterized by its curvature as function of the longitudinal position. The most common transition curve has linear variation of the curvature; this type of transition curve is called clothoid.
Track cant
Track cant D (or superelevation) is the amount one running rail is raised above the other running rail (in a curve). Track cant is positive when the outer rail is raised above the inner rail.
Cant transitions
Cant transitions (or superelevation ramps) are used to connect two different track cants. The cant transition has in most cases the same longitudinal position as the transition curve. The cant gradient is characterized by its longitudinal distance to raise one unit (normally expressed as 1 in X, where X is the longitudinal distance in units). The most common cant transition has a linear variation of the track cant.
Rate of change of cant
Rate of change of cant is the rate of which cant is increased or decreased at a defined speed. The rate of change of cant is characterized by the cant change per time unit
. The most common cant transition has constant rate of change of cant.
dt dD /
Cant deficiency
Cant deficiency I arises when the installed cant is lower than the cant of equilibrium. The cant deficiency is characterized by the additional cant needed to receive
equilibrium.
Rate of change of cant deficiency
Rate of change of cant deficiency is the rate of which cant deficiency is increased or decreased at a defined speed. The rate of change of cant deficiency is characterized by the cant deficiency change per time unit . The most common transition curve / cant transition has constant rate of change of cant deficiency.
dt dI /
distance to raise one unit (normally expressed as 1 in X, where X is the longitudinal distance in units).
Vertical curve
Vertical curves are used to connect two different track gradients. Vertical curves are normally circular curves. The vertical curve is characterized by its radius Rv.
The design track geometry properties described above have impacts on safety and ride comfort, these relations are described in Table 4-1 and 4-2.
Table 4-1 Design track geometry relation to safety.
Property Relation to safety
Track gauge The track gauge has an impact on the lateral
behaviour of the vehicle which may lead to unstable running.
Reduced circular horizontal curve radius increases the lateral track forces, which increases the
derailment ratio (Y/Q).
Circular horizontal curve
No impact
Transition curve
Track cant High cant may be a problem for freight wagons where
brake to stop at high cant may shift the load. UIC has proved that 180 mm is acceptable.
Steep cant transitions may lead to diagonal wheel unloading which in turn may lead to derailment due to flange climbing. European Rail Research Institute (ERRI) has showed that 1/400 m/m is acceptable.
Cant transitions
No impact (see cant transitions)
Rate of change of cant
High cant deficiency may lead to high lateral track forces. High cant deficiency also increases the risk of over-turning.
Cant deficiency
No impact
Rate of change of cant deficiency
No impact
Track gradient
Vertical curve No impact
Table 4-2 Design track geometry relation to ride comfort.
Property Relation to ride comfort
Track gauge The track gauge has an impact on the lateral
behaviour of the vehicle which has an impact on the lateral ride comfort.
No impact (see cant deficiency)
Circular horizontal curve
Reduced transition curve length increases rate of change of cant deficiency and thereby also the lateral jerk perceived by the passenger. It also increases the roll velocity for tilting trains, which is believed to contribute to motion sickness.
Transition curve
Track cant No impact (see cant deficiency)
No impact (see rate of change of cant)
Cant transitions
Increased rate of change of cant increases the roll velocity perceived by the passenger. Roll velocity is considered to contribute to motion sickness.
Rate of change of cant
Increased cant deficiency increases the lateral carbody acceleration perceived by the passenger.
Cant deficiency
Increased rate of change of cant deficiency increases the lateral jerk perceived by the passenger. It also increases the roll velocity in tilting vehicles. Roll velocity is considered to contribute to motion sickness for tilting vehicles.
Rate of change of cant deficiency
No impact
Track gradient
Vertical curve No impact
Note: No impact means that no first order dependences exist.
4.2
National standards in Sweden
The national standards in Sweden, issued by BV, gives guidance on cant, cant gradient, cant deficiency, rate of change of cant and rate of change of cant deficiency for non-tilting vehicles as well as non-tilting vehicles, BV [1996]. The standard also gives guidance on vertical curves. The standard is under revision, 2006. Certain key requirements are given in Table 4-3.
The Swedish standard categorizes the trains based on running gear and tilting capabi-lity:
A Non-tilting trains.
B Non-tilting trains equipped with running gear for high cant deficiency service. S Tilting trains equipped with running gear for high cant deficiency service.
Table 4-3 Key requirements for tilting trains in Sweden.
Cant [mm] Rate of change of cant [mm/s] Cant deficiency [mm] Rate of change of cant deficiency [mm/s] 150 601) 245 79
1) The official value is 69 mm/s but due to other limits the rate of change of cant does not exceed 60 mm/s.
4.3
Standards of European committee of standardization
The European committee of standardization (CEN), gives guidance on cant, cant gradient, cant deficiency, rate of change of cant and rate of change of cant deficiency for non-tilting vehicles, CEN [2002]. The standard also gives guidance on vertical curves. The standard is under revision, tilting vehicles are considered in working draft version CEN [2006b]. Certain key requirements are given in Table 4-4.
The CEN-standards categorize the track based on the type of services on the track: I Mixed traffic lines, with passenger train speeds from 80 km/h to 120 km/h. II Mixed traffic lines, with passenger train speeds greater than 120 km/h and up to
200 km/h.
III Mixed traffic lines, with passenger train speed higher than 200 km/h. IV Mixed traffic lines, for vehicles incorporating special technical design
characteristics.
V Dedicated passenger lines with speed over 250 km/h.
Table 4-4 Key requirements for tilting trains according to CEN [2006b].
Cant [mm] Rate of change of cant [mm/s] Cant deficiency [mm] Rate of change of cant deficiency [mm/s] 1801) 75 306 150
1) For mixed traffic lines, for vehicles incorporating special technical design characteristics.
4.4
Technical Specifications of Interoperability
European Association for Railway Interoperability (AEIF), gives in The Technical Specifications of Interoperability (TSI) for Trans-European High-Speed Rail system, Infrastructure guidance on cant and cant deficiency for non-tilting vehicles,
AEIF [2002a]. No guidance is given for tilting trains (infrastructure owner may decide). AEIF categorize the track based on the type of services on the track, they are:
I Lines especially built for high speed. II Lines especially upgraded for high speed.
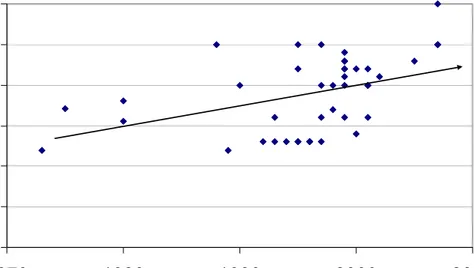
The cant is maximized to 180 mm for all lines, when the maximum cant deficiency is depending on track category and speed, see Figure 4-1.
0
50
100
150
200
0
100
200
300
400
Speed [km/h]
C
a
n
t d
e
fic
ie
n
c
y
[m
m
]
Upgraded lines, High performance vehicles Upgraded lines
High Speed Lines
Figure 4-1 Maximum cant deficiency for non-tilting vehicles as function of speed, AEIF [2002a].
4.5 Track
irregularities
Track irregularities are deviations from the nominal track geometry. Requirements on track irregularities are divided in maximum deviation from mean (mean-to-peak) and standard deviation. The maximum values are safety-related and the standard deviation has a relation to ride comfort.
The national standards in Sweden, issued by BV [1997], give guidance on track
irregularities as maximum deviation from mean (mean-to-peak) and standard deviation. Explicit guidance is given for track irregularities with long wave lengths and tracks used by tilting vehicles.
CEN has not issued any standard for track irregularities; but work is in progress within WG28 2006. AEIF [2002a] gives guidance on track irregularities as maximum devia-tion from mean (mean-to-peak) and standard deviadevia-tion. No guidance for track
irregularities longer than 25 m is given. Tilting vehicles are not considered explicitly in this standard.
A comparison on track irregularities (as mean-to-peak) between BV [1997] and AEIF [2002a] is shown in Table 4-5. The limits on track irregularities are depending on speed. The levels of track irregularities are valid within specified speed intervals, which are different from standard to standard, and the values in the table are therefore given at selected speeds to allow comparison. BV, but not AEIF, differentiates between non-tilting vehicles and non-tilting vehicles, the values shown are for non-tilting vehicles. Both BV and AEIF differentiate between requirements for planned maintenance and unplanned maintenance.
Table 4-5 Track irregularities, BV and AEIF, mean to peak.
BV AEIF
Maintenance level Planned Unplanned Planned2) Unplanned
Vertical [mm] (3 to 25 m wave lengths)1)
at V = 120 km/h 10 16 8 12
at V = 160 km/h 6 10 6 10
at V = 200 km/h 6 9 5 9
at V = 300 km/h NA NA 4 8
Vertical [mm] (25 to 100 m wave lengths)
at V = 120 km/h – – – –
at V = 160 km/h 15 – – –
at V = 200 km/h 15 – – –
at V = 300 km/h NA NA – –
Lateral [mm] (3 to 25 m wave lengths)1)
at V = 120 km/h 6 10 8 10
at V = 160 km/h 4 6 6 8
at V = 200 km/h 3 5 5 7
at V = 300 km/h NA NA 4 6
Lateral [mm] (25 to 100 m wave lengths)
at V = 120 km/h – – – –
at V = 160 km/h 10 – – –
at V = 200 km/h 10 – – –
at V = 300 km/h NA NA – –
Cross level [mm] (on 3 m longitudinal base)
at V = 120 km/h 9 13 – 10.5 at V = 160 km/h 7 10 – 10.5 at V = 200 km/h 6 9 – 7.5 at V = 300 km/h NA NA – 7.5 Gauge [mm] at V = 120 km/h 1,430–1,450 1,430–1,465 – – at V = 160 km/h 1,430–1,442 1,430–1,455 – – at V = 200 km/h 1,430–1,440 1,430–1,450 – – at V = 300 km/h NA NA – 1,434–1,443
1) BV uses the wave length interval 1 – 25 m, AEIF does not specify the wave length but the values are the same as in CEN [2005] standard for vehicle homologation which specify the wave length to 3–25 m.
2) The values are given as information by AEIF, same as given in CEN [2005] standard for vehicle homologation.
A comparison between BV [1997] and AEIF [2002a] on track irregularities as standard deviation is shown in Table 4-6. The limits on track irregularities are depending on speed. The levels of track irregularities are valid within specified speed intervals, which are different from standard to standard, and the values in the table are therefore given at selected speeds to allow comparison. BV differentiates between non-tilting vehicles and tilting vehicles, the values shown are for tilting vehicles. BV has only requirements for planned maintenance.
Table 4-6 Track irregularities, BV and AEIF, standard deviation.
BV AEIF
Quality level Planned Unplanned Planned2) Unplanned
Vertical [mm] (3 to 25 m wave lengths)1)
at V = 120 km/h 1.9 – 1.8 2.1
at V = 160 km/h 1.3 – 1.4 1.7
at V = 200 km/h 1.1 – 1.2 1.5
at V = 300 km/h NA – 1.0 1.3
Lateral [mm] (3 to 25 m wave lengths)1)
at V = 120 km/h 1.7 – 1.2 1.5
at V = 160 km/h 1.2 – 1.0 1.3
at V = 200 km/h 1.1 – 0.8 1.1
at V = 300 km/h NA – 0.7 1.0
Cross level [mm] (on 3 m longitudinal base)
at V = 120 km/h 1.4 – – –
at V = 160 km/h 1.0 – – –
at V = 200 km/h 0.9 – – –
at V = 300 km/h NA – – –
1) BV uses the wave length interval 1–25 m, AEIF does not specify the wave length but the values are the same as in CEN [2005] standard for vehicle homologation which specify the wave length to 3–25 m.
2) The values are given as information in AEIF [2002a], same as given in CEN [2005] standard for vehicle homologation.
4.6
Analysis of track geometry
Kufver has within the Fast And Comfortable Trains (FACT) project analysed the track standards in the view of tilting trains, Kufver [2005]. Relations between enhanced permissible speed for tilting trains and the permissible speed for non-tilting trains are expressed for different track segments.
The different track standards show a large spread in requirements, which can be seen in Table 4-7 where certain key requirements from different standards are given.
Table 4-7 Comparison between different standards on non-tilting and tilting vehicles.
BV CEN AEIF national
European3) General properties Cant mm 150 180 180 139–180 Cant gradient m/m 1/400 1/400 – 1/400 Non-tilting vehicles Cant deficiency1) mm 150 168 165 100–180 Rate of cant mm/s 512) 60 – 35–85 Rate of cant deficiency mm/s 56 90 – 30–92 Tilting vehicles Cant deficiency mm 245 3066) – 1824)–300 Rate of change of cant mm/s 602) 756) – 434)–95 Rate of change of cant deficiency mm/s 79 1506) – 504)–1505)
1) The cant deficiency is given at 200 km/h.
2) The official value is 56 mm/s but due to other limits the rate of change of cant does not exceed 51 mm/s.
3) The national European column shows the spread of values according to Kufver [2005]. Countries considered are The Czech republic, France, Germany, Italy, Norway, Spain, Sweden and United Kingdom.
4) Passively tilting trains in Spain. 5) France and Germany have no limit. 6) CEN [2006b].
In circular curves the relation between enhanced permissible speed for tilting trains VT
and the permissible speed for non-tilting trains VC may be expressed as:
C C T T C T I D I D V V + + = [4-1] where:
DT = Limit for cant, tilting trains [mm]
IT = Limit for cant deficiency, tilting trains [mm] DC = Limit for cant, non-tilting trains [mm]
IC = Limit for cant deficiency, non-tilting trains [mm]
From the track standards shown in Table 4-7, the relation between enhanced permissible speed for tilting trains VT and the permissible speed for non-tilting trains VC can be
On cant transitions, the relation between enhanced permissible speed for tilting trains VT
and the permissible speed for non-tilting trains VC may be expressed as:
C T C T D D V V & & = [4-2] where: T
D& = Limit for rate of change of cant, tilting trains [mm/s] C
D& = Limit for rate of change of cant, non-tilting trains [mm/s]
From the track standards shown in Table 4-7, the relation between enhanced permissible speed for tilting trains VT and the permissible speed for non-tilting trains VC can be
found in the range 100% to 131%.
On transition curves, the relation between enhanced permissible speed for tilting trains
VT and the permissible speed for non-tilting trains VC may be expressed as:
3 C C T T C T I D I D V V & & & & + + = [4-3] where: T
D& = Limit for rate of change of cant, tilting trains [mm/s] T
I& = Limit for rate of change of cant deficiency, tilting trains [mm/s]
C
D& = Limit for rate of change of cant, non-tilting trains [mm/s] C
I& = Limit for rate of change of cant deficiency, non-tilting trains [mm/s]
From the track standards shown in Table 4-7, the relation between enhanced permissible speed for tilting trains VT and the permissible speed for non-tilting trains VC can be
found in the range 108% to 116%.
Kufver [2005] has also analysed the track standards in the view of passenger comfort in tilting trains using the PCT comfort index. Kufver showed that PCT favours low lateral
acceleration in carbody in instead of low roll velocity. The lateral acceleration in carbody is lower in tilting vehicles than in non-tilting vehicles assuming that both vehicles are used at their maximum cant deficiencies. As result the comfort according to
PCT in a tilting vehicle is better than in a non-tilting. The PCT comfort index also favours
increased cant instead of increased cant deficiency by the same reason.
4.7 Summary
Most countries have their own standards for nominal track geometry. The standards also contain different types of the requirements from one country to another. The European standard on nominal geometry defines maximum or minimum values and contributes to some degree to unification. Tilting trains have not received the same attention as non-tilting trains. Some requirements are missing other are just copies of requirements for the non-tilting trains or adjusted as to not give restrictions. One
change of cant can possibly be logical for a non-tilting vehicle where a direct relation to roll velocity exists, but on the other hand, the roll velocity is much higher in a tilting vehicle.
The work with a European standard on deviations from nominal geometry (i.e. track irregularities) has started and may contribute to unification; today some of this informa-tion is found in standards for vehicle homologainforma-tion, CEN [2005]. Requirements on longer wave lengths than 25 meters should be stated. The roll motions of vehicles should be considered when selecting the upper limit for wave lengths.
5
Track – vehicle interaction
The track–vehicle interaction is today guided by standards. In Europe these standards are issued by CEN, some based on a UIC-standard. These standards are widely used also outside Europe. Comparison with older vehicles is another possibility to set limits. This technique was applied when SJ set certain limits for the tilting train that became X2000. Today this type of limits is found in TSI for high-speed trains on the task of side wind stability issued by AEIF [2006].
5.1 Track
forces
5.1.1 Methods
CEN [2005] gives guidance on track shift forces, derailment ratio, lateral wheel forces and vertical wheel forces, Figure 5-1. The same properties with the same limit values are found in UIC [2005a]. Both these standards are for vehicle homologation where the stipulated requirements set the limits to be accepted. The track forces are normally measured with measuring wheelsets. The standards also give guidance on how to select suitable track sections for the measurements and how to process the measured forces. Low-pass filtering is one part of the process, where both standards allow 20 Hz as cut-off frequency. Frequencies higher than the cut-cut-off frequency are not considered.
Statistical treatment is made in two steps, the first step considers the value over one test section (70 to 500 meter) the second step combines different test sections to test zones (test zone here means straight track, large curve radius or small curve radius).
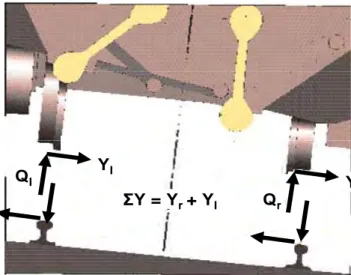
Yr Yl Qr Ql ΣY = Yr + Yl Yr Yl Qr Ql ΣY = Yr + Yl
Figure 5-1 Definitions of track forces.
Track shift force
The track shift force is the sum of lateral wheel forces on a wheelset, ∑Y in Figure 5-1. The track shift force is related to the risk of shifting the track laterally when a train passes. The criterion is also known as the Prod´homme criterion after the inventor, Prod´homme [1967]. The track shift force is considered as safety critical.
The track shift force is taken as a two-meter average. The considered value over a test section is the 99.85% value. The considered value over a test zone is the 99% confi-dence value, which is compared with the limit:
) 3 2 10 ( 0 1 lim max, k Q Y = ⋅ + ⋅ Σ [kN] [5-1] where:
k1 is a constant equal to 1 for all vehicles except freight wagons Q0 is the static vertical wheel load [kN]
The track shift force can be divided in two parts, one quasi-static part and one dynamic part. The quasi-static part has a dependence on cant deficiency, which for a tilting train is higher than for a non-tilting train. The dynamic part has a dependence on speed, which (for the same curve radius) is also higher for a tilting train than for a non-tilting train. Important factors for maintaining the track shift forces under the specified limits are, Andersson & Halling [1999]:
− Low nominal loads.
− Low unsprung mass (impact on dynamic part). − Suspension characteristics (impact on dynamic part).
− Radial steering (impact on force distribution between two axles in a bogie).
Derailment criteria
The ratio between lateral and vertical track forces on a wheel is used as derailment criterion, this ratio is also called flange climbing criterion. The lateral force on the flange is here balanced to the vertical force at the same wheel. Flange climbing is safety critical.
The derailment criterion is taken as a two-meter average. The considered value over a test section is the 99.85% value. The considered value over a test zone is the 99% confidence value, which is compared with the limit:
8 . 0 lim max, = ⎟ ⎠ ⎞ ⎜ ⎝ ⎛ Q Y [5-2] where:
Y is the lateral wheel force
Q is the vertical wheel force
The derailment ratio can be divided in two parts, one quasi-static part and one dynamic part. The quasi-static part has a dependence on cant deficiency, which for a tilting train is higher than for a non-tilting train, but both the lateral and vertical forces increases when the cant deficiency increases. However, the risk for derailment is higher at low speeds, where the tilt normally is inactive, than in high speeds due to the impact from small curve radii and worse track irregularities, making tilting train no different from the non-tilting train.
Lateral wheel-rail forces
The lateral wheel-rail forces have a relation to track loading and track maintenance. The lateral track force is divided in two parts, one quasi-static part and one dynamic part.
The standards have only limit criterion on the quasi-static part. The criterion is evalua-ted is small radius curves with radii equal or greater than 250 meter.
The considered value over a test section is the average value. The considered value over a test zone is the average of all curves in the same direction, which is compared with the limit:
( )
Y qst,lim =60 [kN] [5-3]where:
Y is the lateral wheel-rail force
The quasi-static part has a dependence on cant deficiency, which for a tilting train is higher than for a non-tilting train. The dynamic part has a dependence on speed, which also is higher for a tilting train than for a non-tilting train. Important factors for main-taining the lateral forces under the specified limits are, Andersson & Halling [1999]:
− Low nominal loads.
− Low unsprung mass (impact on dynamic part). − Suspension characteristics (impact on dynamic part).
− Radial steering (at under-radial steering the creep/friction forces on the low wheel forces the wheelset towards the high rail, thus increasing the high rail lateral force).
Vertical wheel-rail forces
The vertical wheel-rail forces have a relation to track loading and track maintenance. The vertical track force is divided in two parts, one quasi-static part, which includes the static wheel load, and one dynamic part, the standards have limit criteria on both. The considered value over a test section is the average value. The considered value over a test zone is the average of all curves, which is compared with the limit:
( )
Q
qst,lim=
145
[kN] [5-4]where:
Q is the vertical wheel force
The considered value over a test section is the 99.85% value. The considered value over a test zone is the 95% confidence value, which is compared with the limit:
( )
Q max,lim =90+Q0 [kN] [5-5a]where:
Q is the vertical wheel force and Q0 the static vertical wheel load [kN]
There is also a limit depending on the maximum service speed of the vehicle, at 250 km/h:
The quasi-static part has a dependence on cant deficiency, which for a tilting train is higher than for a non-tilting train. The dynamics part has a dependence on speed, which also is higher for a tilting train than for a non-tilting train. Important factors for main-taining the vertical forces under the specified limits are, Andersson & Halling [1999]:
− Low nominal loads.
− Low unsprung mass (impact on dynamic part). − Suspension characteristics (impact on dynamic part). − Height of centre of gravity.
5.1.2 Analysis
Kufver [2000] and Lindahl [2001] have simulated track-vehicle interaction for high-speed tilting vehicles with following data, Table 5-1.
Table 5-1 Vehicle properties used by Kufver and Lindahl.
Property Kufver Lindahl
Carbody length 24.95 [m] 25 [m]
Carbody height 3.8 [m] 3.6 [m]
Bogie centre distance 17.7 [m] 18 [m]
Bogie wheel base 2.9 [m] 2.7 [m]
Carbody mass 32,411 [kg] 33,000 [kg]
Carbody centre of gravity height 1.61 [m] 1.55 [m]
Bogie frame mass 5,420 [kg] 6,000 [kg]
Wheelset mass 1,340 [kg] 1,600 [kg]
Both Kufver and Lindahl found that track shift forces can be safety critical for tilting vehicles at high speed. At 360 km/h Lindahl set the maximum allowed cant deficiency to 275 mm in track shift point of view when assuming track irregularities of today’s 200 km/h track in Sweden. An adjusted track standard must be considered for 275–300 mm cant deficiency, in particular at speeds higher than 200 km/h.
5.2
Wheel / rail wear
5.2.1 Methods
Wheel and rail wear may in a general sense be understood as deterioration of the sur-faces on wheel and track. This deterioration can be divided in two groups of basic mechanisms, loss of material, i.e. abrasive wear, and Rolling Contact Fatigue (RCF), Kimura [2000].
The wheel and rail wear has a strong relation to economy both for the infrastructure owner and the train operator. The relations between track and train properties are complicated when it comes to wheel and rail wear, nor does it exist any standards that
which often leads to an extensive and complicated verification process due to the number of factors that affects the wheel turning interval.
Enblom [2003] has observed two different models for loss of material:
1. The one-parameter model according to McEven and Harvey [1985] which assumes a relation between loss of material and the dissipated energy in the contact between wheel and rail.
2. The two-parameter model according to Archard [1953] which assumes a relation between loss of material to contact pressure and sliding velocity.
In the 1980s laboratory studies were made at the Illinois Institute of Technology, which studied material loss under different conditions and suggesting a one-parameter model for wear prediction in curves, Formula 5-6. F⋅ν (named Tγ in UK) is introduced in some of the most common software packages for vehicle dynamic simulation as the wear number (W). Up till now there is no established method for measuring the wheel wear number. K A F k W w + ⋅ ⋅ = ν [5-6] where: w k = Wear coefficient
F = Tangential creep force
V = Creep ratio
A = Contact area
K = Constant
Rolling contact fatigue is an area where much research is in progress. Ekberg et al. [2002] has taken an engineering approach to the problem developing three rolling contact Fatigue Indexes (FI) depending on initiating location. Fatigue is predicted to occur if one or more inequalities are fulfilled.
1. Surface initiated fatigue
0 3 2 > ⋅ ⋅ ⋅ ⋅ ⋅ − = z surf F k b a FI μ π [5-7a]
2. Sub-surface initiated fatigue
e EQ res h DV z sub a b a F FI (1 2) , , 4⋅π⋅ ⋅ ⋅ −μ + ⋅σ >σ = [5-7b]
3. Fatigue initiated at deep defects
th z
def F F
where:
μ = utilized friction coefficient a, b = axis of the Hertzian contact patch
k = yield stress in pure shear
z
F = vertical load magnitude
DV
a = material parameter
res h,
σ = hydrostatic part of residual stress
e EQ ,
σ = equivalent stress fatigue limit
th
F = threshold of force magnitude
Burstow [2004] has shown that the wear number can be useful when judging the risk of RCF also, Figure 5-2. The RCF damage is zero for Tγ less than 15 N because the energy can be transmitted to the rail without causing any damage. At 15 N the energy becomes large enough to initiate cracks, at 65 N the energy is so high that wear begins and at 175 N the wear and RCF crack initiating rate is in balance.
Figure 5-2 RCF damage as function of wear number, Tγ, Burstow [2004].
5.2.2 Analysis
The wheel and rail wear in curves has a relation to the vehicle’s ability of radial steering. This could be achieved by reducing the primary suspension stiffness in longitudinal direction, a technique applied for example in Sweden since the 1980s. Reduced primary suspension stiffness in longitudinal direction may and has been applied on tilting vehicles. Negotiating curves at high cant deficiencies may influence wheel wear due to the increased lateral force that must be taken up by the wheels. However, the increased lateral force is normally accomplished by a decreased angle of attack for the leading wheelset, thus producing a tendency towards reduced wear. The total effect of higher cant deficiency on wheel and rail wear is therefore small regarding wear. Some reports on wheel wear problems on tilting trains are found in the literature,
Trainweb [2006] has reported the same for Acela. None of these vehicles is believed to have any substantial radial steering ability.
From a vehicle point of view, the wheel profile development must also be considered. Flange wear leads to decreased flange thickness and need for reprofiling due to thin flange. Tread wear may lead to high equivalent conicity and a need for reprofiling due to poor running behaviour. The longest wheel turning interval is received when flange wear and tread wear is in balance with each other. However, these phenomenons are not specific for tilting trains only.
RCF has, for all models described by Ekberg et al. [2002], a dependence on vertical force magnitudes. The increased cant deficiency will result in increased vertical load on the curve outer wheel, which will increase the risk for RCF. The increased vertical load on the curve outer wheel can be counteracted by modest axle load and low centre of gravity. The risk of RCF may also be counteracted by careful optimization of the utilized friction coefficient. Important ingredients are brake blending and longitudinal primary suspension stiffness.
5.3
Passenger ride comfort
5.3.1 Methods
The comfort of passengers in a railway vehicle is influenced by a number of different factors like temperature, noise, vibration etc. The passenger comfort considered here is the part influenced by dynamic behaviour of the vehicle. Passenger comfort in this sense can be divided in three groups:
• Frequency weighted accelerations as functions time. • Combinations of weighted accelerations.
• Special purposes.
Weighted accelerations as function time
The technique to present frequency weighted, in carbody measured, accelerations as a measure of passenger ride comfort has been described by Sperling [1956] as the Wz-value, by Oborne [1976] as the Ride Index. Frequency weighted accelerations are also an important step in today’s most used standards on passenger comfort, ISO [1997], [1999] and CEN [1999].
Combinations of weighted accelerations
The technique to combine different frequency weighted accelerations to one comfort index was derived by ERRI and is described in CEN [1999] and UIC [1994]. Both these standards are written for passenger ride comfort, but widely used for vehicle homologa-tion. The CEN-standard is under revision, CEN [2006a]. Two different ride comfort in-dexes are described; one is a simplification of the complete method. The standards also give guidance on how to select suitable track sections for the measurements and how to process the measured signals. The simplified method is based on accelerations
measured on the floor only, Formula 5-8, when the complete method is based on accelerations measured on the interfaces to the passenger.
(
) ( ) ( )
2 95 2 95 2 95 6 d d wb ZP w YP w XP MV a a a N = ⋅ + + [5-8] where: d w XPa 95 = The 95 percentile of the weighted longitudinal rms. acceleration measured on the floor
d w YP
a 95 = The 95 percentile of the weighted lateral rms. acceleration measured on the floor
b w ZP
a 95 = The 95 percentile of the weighted vertical rms. acceleration measured on
the floor
Special purposes
The weighted acceleration as function of time and the combined comfort indexes describe passenger comfort in general. In some case this description of passenger ride comfort is too general. British Rail Research has described two techniques considering discrete events and curve transitions, Harborough [1986]. Both these methods are described in CEN [1999] and CEN [2006a]. The methods separate between seated and standing passengers.
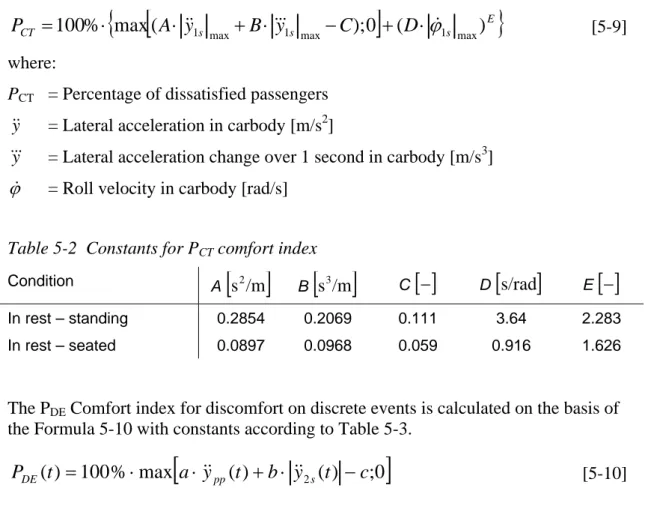
The PCT Comfort index for discomfort on curve transitions is calculated on the basis of
the Formula 5-9 with constants according to Table 5-2.
[
]
{
E}
s s s CT A y B y C D P 100% max( );0 ( ) max 1 max 1 max1 &&&
ϕ
&&& + ⋅ − + ⋅
⋅ ⋅
= [5-9]
where:
PCT = Percentage of dissatisfied passengers y&& = Lateral acceleration in carbody [m/s2]
y&&
& = Lateral acceleration change over 1 second in carbody [m/s3
] ϕ& = Roll velocity in carbody [rad/s]
Table 5-2 Constants for PCT comfort index
Condition A
[ ]
s2/mB
[ ]
s3/m C[ ]
− D[
s/rad]
E[ ]
−In rest – standing 0.2854 0.2069 0.111 3.64 2.283
In rest – seated 0.0897 0.0968 0.059 0.916 1.626
The PDE Comfort index for discomfort on discrete events is calculated on the basis of
the Formula 5-10 with constants according to Table 5-3.

![Figure 4-1 Maximum cant deficiency for non-tilting vehicles as function of speed, AEIF [2002a]](https://thumb-eu.123doks.com/thumbv2/5dokorg/4903358.134781/26.892.255.712.180.459/figure-maximum-deficiency-tilting-vehicles-function-speed-aeif.webp)
![Figure 5-2 RCF damage as function of wear number, Tγ, Burstow [2004].](https://thumb-eu.123doks.com/thumbv2/5dokorg/4903358.134781/37.892.200.703.545.829/figure-rcf-damage-function-wear-number-tγ-burstow.webp)