Copyright © IEEE.
Citation for the published paper:
This material is posted here with permission of the IEEE. Such permission of the IEEE does
not in any way imply IEEE endorsement of any of BTH's products or services Internal or
personal use of this material is permitted. However, permission to reprint/republish this
material for advertising or promotional purposes or for creating new collective works for
resale or redistribution must be obtained from the IEEE by sending a blank email message to
pubs-permissions@ieee.org.
By choosing to view this document, you agree to all provisions of the copyright laws
protecting it.
2010
Predicting the Risk of Future Hospitalization
Niklas Lavesson
Second International Workshop on Database Technology for Data Management in Life
Sciences and Medicine
Predicting the Risk of Future Hospitalization
Niklas Lavesson
School of Computing, Blekinge Institute of Technology Box 520, SE–372 25 Ronneby, Sweden
Email: Niklas.Lavesson@bth.se
Abstract—Elderly over 80 is the fastest growing segment of the Swedish population. With this increase in age the proportion of people with more than one chronic disease, multiple prescribed drugs, and disabilities is getting larger. At the same time, hospitalization accounts for a large amount of the total cost of healthcare. We hypothesize that the number and duration of these hospitalizations could be reduced if the primary care was given suitable tools to predict the risk and/or duration of hospitalization, which then could be used as a basis for providing suitable interventions. In this paper, we investigate the possibility to learn how to predict the risk of hospitalization of the elderly by mining patient data, in terms of age, sex, as well as diseases and prescribed drugs for a large number of patients. We have obtained diagnosis and drug use data from 2006, and associate these data with the number of days of hospitalization from 2007 for 406,272 subjects from the Östergötland county healthcare database. We suggest a data mining approach for automatically generating prediction models and empirically compare two learning algorithms on the problem of predicting the risk for hospitalization.
Index Terms—intervention, co-morbidity, prediction I. INTRODUCTION
The proportion of elderly people is increasing in the de-veloped world [1]. Sweden is no exception. In fact, elderly people over 80 represents the fastest growing segment of the population. As a consequence, the number of people with more than one chronic disease, multiple prescribed drugs, and disabilities is growing in Sweden. This group is also heavily represented in terms of hospitalization, which accounts for a substantial amount of the total cost of healthcare treatment of the elderly in Sweden. Additionally, hospitalization may also decrease the quality of life for patients. Quantifying the risk factors for this group of people and the disease burden attributable to those factors is the key to understanding how to prevent chronic diseases through appropriately targeted health policies [2]. Consequently, we hypothesize that many of the hospitalizations can be avoided if the patients are subjected to suitable forms of intervention. This would benefit both the patients and the healthcare system. However, it is generally infeasible to subject all elderly in the population to the costly interventions. Thus, we need to identify groups of patients for which we can decrease the risk of hospitalization by subjecting
possible to generate models that can predict the risk of hospi-talization by applying data mining algorithms to training data featuring input attributes such as: age, sex, and the presence of diseases and the use of prescribed drugs for a certain year, associated with the number of days of hospitalization during the subsequent year. The aim is to formalize the described problem and suggest a suitable approach for generating and preprocessing the data. The presented study is carried out as part of a larger project on hospitalization risk prediction and the use of the data has been approved by the Ethics Committee at Linköping University, Sweden.
B. Outline
The remainder of this paper is organized as follows: in Section II, we give a more detailed description of the problem and introduce the necessary terminology and definitions. In the next section, we describe our approach. The experimental procedure is then presented in Section IV. Conclusions and pointers to future work are presented in the last section.
II. BACKGROUND
The occurrence of multiple chronic disorders and the use of multiple drugs are more common for the elderly than for the population in general. In fact, the management of healthcare delivery for persons with chronic illnesses has advanced substantially in recent decades [3]. In 1999, it was reported that healthcare costs for individuals with at least three chronic conditions accounted for 89% of the annual budget of one particular American health insurance program [4]. This situation is similar for Sweden [1].
Comorbidity, i.e., the presence of at least two disorders or diseases in the same patient, is associated with a poor quality of life, high healthcare demand, the use of multiple medications, and an increased risk for mortality. Thus, the optimization of the care for this population should be of high priority. Furthermore, it has been shown that the appropriate interventions may improve clinical outcomes and processes of care and, to some extent the quality of life, for patients with chronic illnesses [1]. However, it is difficult to make the appropriate judgments about which care to provide to older
e.g., diabetes. As is noted in [5], a more common example of a case is a patient with type 2 diabetes who is depressed and obese and has coronary heart disease and osteoarthritis.
The question is which interventions to promote for patients with such a complex comorbidity. In addition, it is difficult to assess the impact of such interventions. In one controlled trial of the impact of preventive home visits to older people it was concluded that mortality was reduced significantly [1]. However, the authors note that their findings are dependent on contextual factors that make it difficult to form general policy recommendations. As stated earlier, we would like to investigate the number of days of hospitalization during the subsequent year as an indicator, both of the need for, and the impact of preventative measures.
The Swedish counties store large amounts of patient data, including: age, sex, the associated primary care unit, the num-ber of days of hospitalization, the numnum-ber of hospitalizations, and the complete set of diagnoses for each patient. In addition, the Epidemiological Center at the National Board of Health and Welfare stores information about prescribed drugs. Since these data can be obtained for specific years, we believe that it would be possible to use diagnosis and drug data for one particular year and hospitalization data from the subsequent year to build predictive models for estimating the risk for hospitalization.
A. Terminology
Drugs are classified using the anatomical therapeutic chemi-cal (ATC) classification system1, which is recognized as an
in-ternational standard. In this system, the drugs are divided into different groups according to the organ or system on which they act and their chemical, pharmacological and therapeutic properties. There are five different levels at which the drugs can be classified. The first level, indicated by a letter, is the anatomical main group and the second level, indicated by the same letter and two digits, is the therapeutic subgroup. Each level becomes more specific; the fifth and last level is the chemical substance.
Diseases are classified using the international classification of diseases (ICD) system2, which correspondingly divides the
diseases into groups at different levels. Analogously to ATC, the ICD code begins with an alphabetical character. The first level is represented by this character and two digits and the second level by the character followed by three digits.
B. Related Work
The automatic or semi-automatic generation of prediction models from patient data has been extensively studied. Many studies seem to focus on the general task of mining medical databases and the typical issues that could arise. For example, approaches to deal with the class imbalance problem have been presented [6]. This problem occurs when one category of the
1World Health Organization (WHO): About the ATC/DDD system, http: //www.whocc.no/atcddd/atcsystem.html
2World Health Organization (WHO): International classification of diseases, http://www.who.int/classifications/apps/icd/icd10online/
TABLE I ORIGINALDATA
Database
Property Disease Drug Hospitalization #Entries 545,415 2,439,799 77,981 #Unique subjects 77,981 77,981 77,981
#Unique diagnoses 6,221 n/a n/a
#Unique drugs n/a 1,034 n/a
Statistics for the three original databases: subjects below 65 years of age (n = 328, 291) have been excluded.
target attribute, i.e., the variable to be predicted, is heavily underrepresented in comparison to the other categories. The impact of the problem can be profound, resulting in, e.g., severely biased and poor models. In addition, other studies focus on evaluating which model generators, i.e., learning algorithms, are best suited for mining different types of medical data [7]. One of the most common applications of data mining in medicine is the diagnosis of different diseases [8]. Also, some studies exist that evaluate approaches to predict healthcare costs by mining patient data provided by health in-surance companies [9]. However, to our knowledge, there exist no previous studies addressing the prediction of hospitalization by mining diseases and prescribed drugs.
III. METHOD
The overall aim is to investigate whether it is possible to automatically analyze patient information in order to predict the duration of hospitalization patients the subsequent year. Given the substantial amount and complexity of data, the investigation can be categorized as a large-scale data min-ing project. The different views on the required steps and the possible level of automation in such projects have been discussed extensively in the literature [10], [11]. One study in particular [12] has tried to synthesize some of these views and also provides an analysis of the importance of domain knowledge during different steps. The synthesized set of steps are: a) problem definition, b) target data set generation, c) data preprocessing and transformation, d) feature and algorithm selection, e) data mining, f) evaluation, and g) fielding. In this paper, we describe all except the last of these steps related to our project. We first formulate the problem as follows: given patient data, in terms of age, sex, prescribed drugs and known diseases, for a particular year, predict the risk for hospitalization during the subsequent year.
A. Data
The original data have been obtained from two sources. Firstly, the age, sex, and associated diseases of each patient as recorded in 2006, as well as the number of days of hospitalization as recorded 2007, have been obtained from the Regional Patient Database of Östergötland, Sweden. The data on drugs as recorded 2006 have been obtained from the Epidemiological Center at the National Board of Health and Welfare in Sweden. The statistics from relevant subsets of these databases can be viewed in Table I.
TABLE II DATASETDESIGN Attribute(s) Description
Sex nominal
Age Subject age in 2006 - numeric Diagnosis 1 . . . m ICD codes representing diseases
-nominal vector
Drug 1 . . . k ATC codes representing prescribed drugs - nominal vector
Hospitalization The number of days of hospitaliza-tion, 2007 - numeric
Each row represents a unique subject, defined by sex, age, the presence/absence of m diseases, the presence/absence of k drugs, and the number of days of hospitalization the subsequent year.
1) Analysis: The complete, original databases include data for 406, 272 subjects. Since the primary motivation for the study is to improve the risk assessment of the elderly in order to get a better basis for selecting suitable interventions, we have selected to exclude all patients of age 64 and below. This exclusion reduces the number of unique subjects to 77, 981 . There are 6, 221 unique IDC (diagnosis/disease) codes and 1, 034unique ATC (prescribed drug) codes in the databases. We will soon describe how these amounts can be significantly reduced. The male/female ratio is 44 to 56 and the mean age is 76. In addition, the mean number of days of hospitalization for these subjects is 1.7. However, the five patients with the highest number of hospitalization days were all admitted for well over 100 days during 2007.
2) Transformation: In the Disease and Drug databases, each entry describes an association between a subject and a particular disease or prescribed drug. Thus, the data for one patient may encompass multiple entries in each database. As we want to predict the risk of hospitalization on a per patient basis, we need to transform these data from row to column format so that each data instance represents a unique subject. This transformation is conducted by replacing the IDC code and ATC code columns with one column for each IDC and ATC code. For each patient, the associated diseases and drugs are marked as present (true) and all other diseases and drugs are marked as absent (false). Thus, each disease and drug is represented by a Boolean IDC or ATC attribute.
B. Preprocessing
There are a number of steps that can be performed in terms of preprocessing the data set further. We now review these step in turn. Each instance in the data set describes a unique subject using the attributes presented in Table II.
1) Truncation of ATC and ICD codes: As noted in Sec-tion II, the ATC drug codes and the ICD diagnosis codes are both designed to define main and sub groups, using different numbers of characters. In the studied databases, the ATC code lengths range from 1 to 7 while the ICD code lengths range from 1 to 4. Since each unique ATC and ICD code is used as an individual input attribute, that is, a Boolean attribute indicating the presence/absence, it is important that the total number of unique codes is kept as low as possible to reduce sample complexity. The domain experts suggest the use of
three characters for the ICD code and four characters for the ATC code. This particular configuration would result in a total number of 955 attributes (age, sex, 678 ICD codes, and 274 ATC codes) for the complete data set, as opposed to 7, 257 attributes when the untruncated ICD and ATC codes are used.
2) Estimating Risk from Hospitalization Days: The number of hospitalization days is a numeric attribute ranging from 0 to 236 in the original Hospitalization data set. Domain experts suggest that this target attribute can be discretized into three different categories; low risk, medium risk, and high risk for future hospitalization. The justification for these categories is as follows: we are primarily interested in the last category. If the number of days can be reduced for this high risk group the cost for healthcare could be lowered significantly and the quality of life for the patients could be improved. The medium risk group represents a borderline group, in which patients could potentially spend a number of days in the hospital, possibly distributed over more than one admission.
The low risk group represents patients that will not be admitted to the hospital at all or whom might be admit-ted for a short period of time. The low and medium risk group admissions could possibly be avoided completely if the appropriate interventions are carried out. Discretization unavoidingly results in an imbalanced data set (where a large majority of patients belong to the low risk group). This is a common problem for many data mining applications and several studies address associated issues [6], [13].
IV. EXPERIMENTALPROCEDURE
We will now outline the design of the experiment. The aim of the experiment is to evaluate a feature selection technique (χ2) and to empirically compare two data mining algorithms
on the problem of classifying patients into the defined risk groups (low, medium, and high risk for future hospitalization). All generation, preprocessing, and transformation of data, as well as most of the data analysis is conducted in R 2.10.1. The Weka [14] machine learning workbench version 3.7.0 is used for additional data set analysis and experimentation.
A. Generation of Training, Test, and Validation Sets
The complete data set is divided into two subsets. The first subset is used to generate and evaluate prediction models and the second subset will be used for validation in future research. The two subsets have been generated by performing stratified sampling from the complete data set to ensure an equal class distribution for the subsets. The training/testing set, denoted data-0.10, used in the presented study, contains 10% of the instances (n = 7, 798) from the complete data set and the validation set contains the remaining 90% of the instances. The data set used in the presented study, data-0.10, is systematically divided into training and testing subsets, as will be described in Section IV-C, to avoid an overly optimistic estimate of performance.
B. Feature and Algorithm Selection
The χ2test is selected as a ranking measure for performing
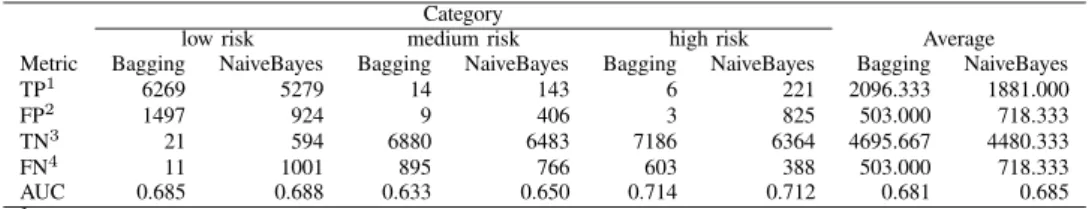
TABLE III EXPERIMENTAL RESULTS Category
low risk medium risk high risk Average
Metric Bagging NaiveBayes Bagging NaiveBayes Bagging NaiveBayes Bagging NaiveBayes
TP1 6269 5279 14 143 6 221 2096.333 1881.000
FP2 1497 924 9 406 3 825 503.000 718.333
TN3 21 594 6880 6483 7186 6364 4695.667 4480.333
FN4 11 1001 895 766 603 388 503.000 718.333
AUC 0.685 0.688 0.633 0.650 0.714 0.712 0.681 0.685
1Subjects correctly categorized to belong in a risk particular group. 2Subjects incorrectly categorized to belong in a risk particular group. 3Subjects correctly categorized to not belong in a risk particular group. 4
Subjects incorrectly categorized to not belong in a risk particular group. The performance of Bagging on the data set generated with χ2
cutpoint of 9 is compared with the performance of NaiveBayes on the data set generated with χ2cutpoint of 6.
data models. Eleven cutpoints, c = {0, 1, . . . , 10}, are chosen to determine which attributes should be excluded from
data-0.10. The eleven resulting data sets are denoted:
data-0.10-0, data-0.10-1, and so forth. For the presented study, two algorithms are selected for comparison: Bagged REP Trees (Bagging), and Naive Bayes (NaiveBayes).
C. Evaluation
Evaluation is carried out, using 10-fold cross-validation, for both algorithms on the eleven data sets generated by performing feature selection as well as the untampered
data-0.10 data set. The weighted average of the area under the
ROC curve (AUC) across the three categories is used as a benchmark classification performance measure. The AUC measure is used in two capacities; to determine the optimal χ2 cutoff point for both algorithms and to determine which algorithm is most suitable for the classification task.
V. RESULTS
The results from the feature selection process are presented in Table IV. As this table shows, NaiveBayes in general performs better than Bagging. Given the employed cutoff point interval, the optimal data set for NaiveBayes is data-0.10-6, containing 256 attributes. Similarly, the optimal data set for Bagging is data-0.10-9, containing 177 attributes. In Table III, we display detailed results for the two data sets, determined to be optimal for NaiveBayes and Bagging, respectively. It is evident that, out of the two studied algorithms, NaiveBayes outperforms Bagging on the problem of predicting the low and medium risk of hospitalization. Despite a large number of false positives, NaiveBayes manages to accurately establish an elevated risk of hospitalization for a rather large group of patients. Subsequently, these patients could be subjected to suitable interventions. In contrast, Bagging is unsuccessful in establishing elevated risks, resulting in that an overwhelming majority of the medium and high risk patients are determined to belong to the low risk group. Despite of this fact, Bagging yields a slightly higher AUC than NaiveBayes on the high risk group. This is due to a better ratio between TPs and FPs but it is worth considering that the number of TPs is very low.
TABLE IV FEATURE SELECTION RESULTS
Algorithm
χ2 Bagging NaiveBayes
cutoff #Attributes AUC AUC
n/a 958 0.668(0.023) 0.668(0.032) 0 791 0.667(0.022) 0.668(0.032) 1 565 0.666(0.022) 0.677(0.032) 2 443 0.673(0.023) 0.681(0.032) 3 366 0.675(0.022) 0.684(0.031) 4 331 0.680(0.024) 0.685(0.031) 5 295 0.675(0.024) 0.686(0.031) 6 256 0.679(0.031) 0.686(0.031) 7 240 0.675(0.030) 0.685(0.032) 8 202 0.677(0.031) 0.683(0.032) 9 177 0.682(0.026) 0.683(0.032) 10 166 0.679(0.025) 0.682(0.030) Average weighted Area under the ROC curve (AUC) scores for Bagging and NaiveBayes on data sets generated by removing all attributes with a χ2test score less than a specific cutoff point. The optimal score(s) for each algorithm is/are shown with bold style.
As is shown in Figure 1, featuring the NaiveBayes perfor-mance for each risk group, the NaiveBayes algorithm is most successful at predicting high risk patients, that is, patients with a high risk of hospitalization the following year. However, it is suspected that the overall classification performance of both algorithms is still too low for practical application even though the baseline (indicated by a straight line in the ROC plots) is probably a resonable estimator of current practice since no risk prediction is used today.
VI. CONCLUSIONS
In this paper, we have investigated the possibility to learn how to predict the risk of hospitalization of the elderly by mining patient data, in terms of age, sex, as well as the diseases and prescribed drugs for a large number of patients. We suggest an approach for this purpose and describe the necessary steps that should be taken to generate, preprocess, and transform the data set. We perform feature selection using the χ2-test and experimentally compare Bagging and
NaiveBayes on the task for classifying patients into three groups; low, medium, and high risk of hospitalization. The
0.0 0.2 0.4 0.6 0.8 1.0 0.0 0.2 0.4 0.6 0.8 1.0 FPR TPR 0.0 0.2 0.4 0.6 0.8 1.0 0.0 0.2 0.4 0.6 0.8 1.0 FPR TPR 0.0 0.2 0.4 0.6 0.8 1.0 0.0 0.2 0.4 0.6 0.8 1.0 FPR TPR
Fig. 1. ROC plots of the low risk (top), medium risk (middle), and high risk (bottom) categories. Each plot is generated by one 10-fold cross-validation test of the Naive Bayes algorithm on the chi6-0.10 data set.
empirical results indicate that our approach seem to provide a resonable basis for generating hospitalization risk prediction models. However, the data complexity and the imbalanced class distribution are obvious issues that need to be further studied. Additional future work include the application of association learning to establish relationships between groups of diseases and prescribed drugs that are particularly useful for hospitalization risk prediction.
Acknowledgments
This study is funded by a grant from Blekinge county council. The author wish to thank Lars Borgquist and Henrik Magnusson at Linköping university, Sweden, for providing the data used in this study.
REFERENCES
[1] K.-G. Sahlen, L. Dahlgren, B.-M. Hellner, H. Stenlund, and L. Lind-holm, “Preventive home visits postpone mortality: a controlled trial with time-limited results,” BMC Public Health, vol. 6, no. 220, 2006. [2] E. Nolte and M. McKee, Caring for people with chronic conditions:
A health system perspective. New York City, USA: Open University Press, 2008.
[3] A. C. Tsai, S. C. Morton, C. M. Mangione, and E. B. Keeler, “A meta-analysis of interventions to improve care for chronic illnesses,” American
Journal of Managed Care, vol. 11, pp. 478–488, 2005.
[4] C. M. Boyd, J. Darer, C. Boult, L. P. Fried, L. Boult, and A. W. Wu, “Clinical practice guidelines and quality of care for older patients with multiple comorbid diseases: implications for pay for performance,”
American Medical Association, vol. 294, no. 6, pp. 716–724, 2005. [5] K. Grumbach, “Chronic illness, comorbidities, and the need for medical
generalism,” Annals of Family Medicine, vol. 1, no. 1, pp. 4–7, 2003. [6] C. I. Lee, C. J. Tsai, T. Q. Wu, and W. P. Yang, “An approach to
mining the multi-relational imbalanced database,” Expert Systems with
Applications, vol. 34, no. 4, pp. 3021–3032, 2008.
[7] Q.-N. Tran, “Mining medical databases with modified gini index classi-fication,” in Fifth International Conference on Information Technology:
New Generations, 2008.
[8] D. Durson, “Analysis of cancer data: a data mining approach,” Expert
Systems, vol. 26, no. 1, pp. 100–112, 2009.
[9] J. W. Robinson, “Regression tree boosting to adjust health care cost predictions for diagnostic mix,” Health Services Research, vol. 43, no. 2, pp. 755–772, 2008.
[10] P. Langley and H. A. Simon, “Applications of machine learning and rule induction,” Communications of the ACM, vol. 38, no. 11, pp. 55– 64, 1995.
[11] U. M. Fayyad, G. Piatetsky-Shapiro, and P. Smyth, “The kdd process for extracting useful knowledge from volumes of data,” Communications of
the ACM, vol. 39, no. 11, 1996.
[12] I. Kopanas, N. M. Avouris, and S. Daskalaki, “The role of domain knowledge in a large scale data mining project,” in Second Hellenic
Conference on AI: Methods and Applications of Artificial Intelligence, 2002, pp. 288–299.
[13] N. Japkowicz and S. Stephen, “The class imbalance problem: A sys-tematic study,” Intelligent Data Analysis, vol. 6, no. 5, pp. 429–450, 2002.
[14] I. H. Witten and E. Frank, Data Mining: Practical Machine Learning
Tools and Techniques. San Francisco, USA: Morgan Kaufmann Publishers, 2005.