Proceedings of 8th Transport Research Arena TRA 2020, April 27-30, 2020, Helsinki, Finland
Analysis and comparison of simulated and real train driving in an
Automatic Train Protection (ATP) system environment
Tomas Rosberg
a, Birgitta Thorslund
a, Anders Lindström
aaVTI, Olaus Magnus väg 35, Linköping 58195, Sweden
Abstract
This paper presents the differences between the train traffic simulation tool RailSys and real train traffic with focus on Electrical Multiple Units (EMU) and the Swedish automatic train protection (ATP) system ATC, on a single-track line. Braking, acceleration, different types of resistance and running times have been investigated. From this study it can be concluded that the margins to unconditional ATC braking is high and that the braking differs depending on the signal target. Compared to RailSys, the measurements show significantly lower acceleration and retardation, which results in differences between measured and simulated running time.
This is the first step exploring how capacity, signal systems, and driving behaviour interact and will be followed by investigations of the next generation signaling system ERTMS.
Keywords: ATP; ATC; ERTMS; simulation; driving behaviour; signaling
1. Introduction
The automatic train protection system ATC (Automatic Train Control) used in Sweden serves two purposes, safety and efficiency. As a safety system, ATC aims at preventing consequences of driver errors. Efficiency has been increased in terms of enabling higher speeds and decreased headway compared to traditional trackside signalling (Harms, Fredén, 1996). ATC has been the dominating train safety system in Sweden since 1980 (Lawson, Wallin, Bryntse, Friman, 2002) and is used in conjunction with trackside equipment, such as optical signals, shunting signals and speed boards.
The next generation signalling system, European Rail Traffic Management System (ERTMS) is an important industrial project that is being implemented to improve cross-border interoperability throughout Europe by creating a single rail signalling standard. ERTMS is a continuous communications-based signal system that is expected to save maintenance costs, improve safety and increase traffic capacity (RailwayTechnology, 2018). Today ERMTS is implemented on four lines in Sweden - Botniabanan, Ådalsbanan, Haparandabanan and Västerdalsbanan (Trafikverket, 2019).
The Swedish Transport Administration and signal planning consultants make capacity assessments of ATC and ERTMS to study the design and planning of lines. There is a need to develop the field of ERTMS simulation and improve the basis for ERTMS planning (Köhler & Knutsen, 2017). At the Swedish Road and Transport Research Institute (VTI), user-centered development of a train driving simulator for education and training has being carried out for several years (Thorslund, Rosberg, & Lindström, 2019). This offers the opportunity to conduct studies
2 under controlled conditions as well as the possibility to study, evaluate and train safety-critical situations which are difficult, expensive or even impossible to study in the real world (Abadir Guirgis & Peters, 2015; Abadir Guirgis, Peters, & Lidström, 2015; Hedman, 2017).
RailSys is a commercial train traffic simulator used by the Swedish Transport Administration and signal planners for the design of ATC and ERTMS lines, to ensure operating time and punctuality when introducing ERTMS, as well as for modelling and for studies of new ERTMS versions (Bendfeldt, Mohr, & Muller, 2000). What is lacking in modelling is, however, a driver behaviour model.
To our knowledge no previous attempts to add a driver model into capacity simulation has been made. At VTI a doctoral project has therefore been initiated with the main aim to explore how capacity, signal systems, and driving behaviour interact. The planned work consists of three main steps, where first the effect of the transition from ATC to ERTMS, for example, driving behaviour, operating times and line capacity will be investigated. With the new knowledge, we examine how parameter setting (simulation parameters, driver information and dynamic parameters, such as braking) should be adapted for more realistic capacity planning, based on driver behaviour. Finally, a conclusion will be summarized of how we can benefit from the results for planning, such as speed and signal optimization, based on both driving behaviour and capacity. This paper presents the ATC part for the first step, conducted on Jönköpingsbanan during spring 2019 with a single type and configuration of passenger train.
2. Aim
The aim of this study was to examine the differences between the train traffic simulation tool, RailSys, and real train driving in terms of braking, acceleration, braking related to the ATC retardation curve and braking towards signal targets. The paper will highlight the Swedish dominant train signalling system ATC.
To address this aim, the following research questions were formulated: • Does the braking behaviour differ depending on the ATC signal target? • How does the train driver follow the ATC retardation curve?
• How does RailSys simulation of train braking and running times differ from real train driving? 3. Theory
This chapter includes the theory needed to answer the research questions with the methods described in chapter 4.
3.1. Impact on acceleration from rolling, curve, and slope resistance and from rotating mass
When measuring acceleration or simulating trains in RailSys, several different types of resistance, affecting the dynamics of the train, should be considered. The impact of four types of resistance, namely rolling, curve, slope and rotating mass resistance was analyzed for the 3-waggon Bombardier Regina train set. An estimate of the maximum resistance affecting the acceleration was made on the longest uphill section on Jönköpingsbanan between Jönköping, Huskvarna and Forserum. This slope is approximately 10 km long with an inclination of between 6-12 ‰.
According to the European standard (EN 14067-2, 2003), the rolling resistance can be described as:
𝑅𝑟𝑜𝑙𝑙𝑖𝑛𝑔= 𝐶1+ 𝐶2𝑣𝑡𝑟+ 𝐶3𝑣𝑡𝑟2 (1)
Where 𝐶1+ 𝐶2𝑣𝑡𝑟 is the mechanical resistance and resistance from cooling air and ventilation, and 𝐶3𝑣𝑡𝑟2 is the aerodynamical resistance.
Resistance due to slope is also described in a European standard (EN 14067-2, 2003):
3
m [kg] train mass
g [m/s2] gravity
i [‰] rail inclination
Due to the inability of the train wheel flanges to adapt to the rail, the train is also affected by a curve resistance. According to an expert at Bombardier (Flykt, 2019), for a three-waggon Regina, this can be described as:
𝑅𝑐𝑢𝑟𝑣𝑒= 6380m (1000 ∗ (𝑟 − 55))⁄ (3)
m [kg] train mass
r [m] curve radius
This gives the total force and acceleration from 1, 2 and 3, with respect to the rotating mass with factor k:
𝑅𝑇𝑂𝑇 = 𝑅𝑟𝑜𝑙𝑙𝑖𝑛𝑔+ 𝑅𝑠𝑙𝑜𝑝𝑒+ 𝑅𝑐𝑢𝑟𝑣𝑒 𝑎 = 𝑅𝑇𝑂𝑇⁄(𝑚k)
With Bombardier Regina train data (Flykt, 2019) k =1,048, C1 = 1100, C2 = 12,5, C3 = 0,44, m = 188 000 kg and
given track data for the uphill section between Jönköping and Forserum from Swedish Transport Administration database BIS, imax =12 ‰, vmax = 130 km/h, rmin = 862 m, , Rrolling = 2,25 kN, Rslope = 22,1 kN and, Rcurve = 1,5 kN,
the maximum retardation on this section due to resistance was calculated to amax = -0,13 m/s.2 The parameters k,
C1, C2 and C3 are used in the RailSys simulation described in chapter 4.5.
3.2. Calculation of ATC retardation curve (R-curve)
For the braking curve the retardation (b) is calculated according to (ATC - Övervakningsfunktioner, 2006):
𝑏 = 𝑏𝑓+ 𝑘𝐺 (4)
Where bf is the ATC retardation number for the specific train, entered by the driver in the ATC system, k is set to
0,01 m/s2 and G is the average track inclination. The latter is given by track balises to the ATC onboard system.
The permitted braking curve is then given by (ATC - Övervakningsfunktioner, 2006):
𝑠𝑟 = (𝑣0 2 − 𝑣𝑡𝑎𝑟𝑔𝑒𝑡2 ) 2𝑏⁄ (5)
Where sr is the braking distance to target, v0 is the train speed, vtarget is the target speed and b is given by (4). This
formula refers to ATC in normal adhesion mode, which has been the case for all measurements.
4. Method
The method to answer the research questions is presented in this chapter. This includes preparations, setup and data collection for the real train driving as well as analysis and comparison with RailSys data.
4.1. Preparations
A data inventory was done to identify possible aspects of train driving and signalling systems. The map in Figure 1 acted as a basis for discussion and lists the main interrelated variables, relevant for the measurement setup.
4 Figure 1. Train driving parameters of interest.
The inventory of obtainable data resulted in a selection of the following track sections to compare: Falköping to Sandhem (track section 710) and Sandhem to Nässjö (track section 711). Both sections form Jönköpingsbanan. Götalandståg is the main train operator and was asked to contribute with trains for the measurement setup. The track sections are trafficked on daily basis by Bombardier Regina X50-B/X53-A, which is a three-waggon electrical multiple unit (EMU). There was no possibility to use the vehicle support systems, like the recorder unit, to obtain the data parameters. However, the train cabin for the selected train routes was prepared in advance with equipment enabling collection of train speed and position, in addition to video cameras providing video footage of the train driver view, the ATC driver panel and the braking level display.
All drivers were informed by the vehicle department at Götalandståg about the data collection and were able to deny participation.
4.2. Data collection
The following data was collected with the VBOX measurement equipment from Racelogic (Racelogic, 2019); GPS position, velocity and driver viewpoint window view. An additional GoPro HD video camera was used to collect data from ATC driver panel and the train brake level display. The data collection was performed during 5 days in March 2019. In total 18 measurement runs on the same stretch was conducted. The regional trains from Falköping to Nässjö have an approximate running time of 1:30 h, which yielded approximately 30 hours of measurement data being collected.
The ATC driver panel works as a train driver interface to the train safety system. Monitoring train speed and preventing stop signal passage are two main important functions. In the data collection the focus was on monitoring the main signalling and the pre-signalling display, which supports the driver with the current permitted speed and under certain conditions the permitted speed at the next signal, i.e. pre-signalling.
4.3. Calculation of retardation from braking curve
A three-step method was used for calculating the retardation from measured braking curves. First start, stop and middle measuring points (pstart, pstop, pmid) were decided, then the average acceleration was calculated for the linear
curves from the start to middle, and middle to stop measuring points, respectively. The retardation was then determined as the average value of the two linear curves. The three measuring points in Figure 2 were chosen according to the following criteria:
• pstart - point where train velocity was 5 km/h below permitted speed
• pstop - point where train velocity was 5 km/h over target permitted speed
5 Figure 2. Train speed/time graph, overlaid with ATC current permitted speed and measurement points to determine retardation.
4.4. Braking behaviour and ATC signal targets
Three braking categories were selected to be measured. Braking towards a 40 km/h target, braking towards a ≥ 70 km/h target and braking towards a station without any restrictive signal point. The latter situation could appear when a train is approaching a station on the main track, and no restrictive signal forces the train to stop. In this case the train route is clear without any occupation in the block section in front of the train. However, the train is scheduled for a stop according to the timetable.
All signal points in the same category were gathered and an average value of retardation was calculated. In total 28 braking situation towards 40 km/h target have been analyzed. For the ≥ 70 km/h targets 66 situations have been used, and for stations without signal point 72 situations.
4.5. Train driving and ATC retardation curve (R-curve)
In the ATC system the train retardation curve is defined as the fully developed retardation (ATC -
Övervakningsfunktioner, 2006), see Fig 3. This limit is monitored by the ATC system for all signal targets. If the train speed is too high to stop the train before the signal target, the ATC system will brake the train
unconditionally. So, the train speed is supervised both according to the retardation curve in order to fulfill signal targets but also with regard to the track and train permitted speed. However, the system allows the driver to exceed the speed limit with up to 9 km/h in order to enable a smoother speed monitoring. Note that this allowed overspeed is always limited by the retardation curve.
6 Figure 3. Relation between train speed, ATC permitted velocity and retardation braking curve (R-curve).
Comparing train retardation with ATC retardation curve was divided in two steps. Comparing the retardation of both curves and measuring the distance from actual speed curve to the R-curve. The distance measurement,
drcurve, is measured from the speed curve 5 km/h below the permitted speed to the R-curve. The method for
calculating average retardation described in chapter 3.2 was used, where the average track inclination in equation (4) was fetched from the ATC balise configuration, specified in BIS database. Track inclination is only given by the ATC system for downhill slopes. For Jönköpingsbanan balises can report inclination of 0‰, 5‰ and 10‰. 28 brake situations for 40 km/h and 66 for ≥ 70 km/h targets have been used to calculate a total average
retardation value. The comparison of acceleration and distance quantifies the driver’s closeness to unconditional ATC brake behaviour.
4.6. RailSys simulation compared to real train driving
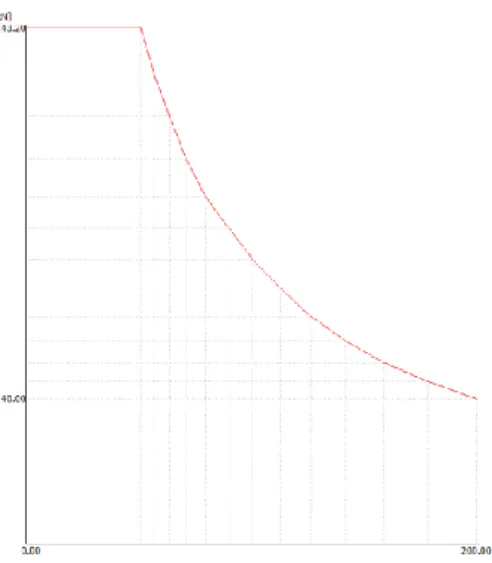
For RailSys two aspects have been investigated, one related to running times and the second to acceleration and retardation behaviour. The difference in running time between Nässjö and Falköping was investigated. The track section has been dived into the sections between the 10 stations Nässjö, Forserum, Tenhult, Huskvarna, Jönköping, Bankeryd, Habo, Mullsjö, Sandhem, and Falköping, where the average running time per section was calculated from the measured running times. For comparison, a RailSys simulation was performed with the same preconditions, i.e. using the same train model, track route and identical signaling conditions. The dwell time was set to 1 s in RailSys in order to avoid total running time to be affected by station stops. RailSys was configurated with a traction force curve provided by Flykt (2019), as shown in Figure 4. The braking rate was set to 0.6 m/s2,
according to the RailSys user guide provided by the Swedish Road Administration (Trafikverket, 2016).
Secondly, the difference between acceleration and retardation behaviour from RailSys and real measurements was analyzed. Three acceleration and retardation points for each section between stations formed an average value respectively. For RailSys the points were given by the simulation tool and for the real train drive the VBOX equipment was the measurement source. The samples were chosen randomly at the following speed ranges; speed ≥ 90 km/h, speed ≤ 50 km/h, and one point in between. RailSys calculates rolling resistance according to equation (1). RailSys also takes curve, slope and rotating mass resistance in consideration. However, the calculations and parameters are not specified or documented.
7 Figure 4. Traction force curve for 3-waggon Regina (Flykt, 2019).
5. Results
5.1. Braking behaviour and ATC signal targets
The braking behaviour for 17 train runs on Jönköpingsbanan is shown in Table 1.
Train route Target 40km/h [m/s2] No of braking targets Target ≥ 70 km/h [m/s2] No of braking targets Station without stopping signal point [m/s2] No of braking targets 190312_7216 N/A 0 -0.392 4 -0.481 4 190312_7233 -0.343 2 -0.554 1 -0.502 4 190312_7216 -0.433 2 -0.296 3 -0.491 5 190313_7209 -0.383 2 -0.307 5 -0.429 3 190313_7216 N/A 0 -0.342 4 -0.451 5 190313_7233 -0.359 3 -0.343 3 -0.525 5 190313_7240 -0.33 1 -0.309 4 -0.479 6 190314_7209 -0.396 3 -0.396 5 -0.555 5 190314_7216 N/A 0 -0.37 5 -0.54 5 190314_7233 -0.396 2 -0.33 3 -0.397 5 190314_7240 N/A 1 -0.281 2 -0.349 1 190318_7209 -0.315 2 -0.39 3 -0.459 3 190318_7216 -0.392 1 -0.373 5 -0.378 5 190318_7233 -0.448 3 -0.296 3 -0.553 3 190318_7240 -0.290 2 -0.318 5 -0.306 3 190319_7209 -0.332 3 -0.361 6 -0.48 5 190319_7216 -0.340 1 -0.326 5 -0.534 5 Average acc. -0.37 -0.352 -0.465 Total no of targets 28 66 72
Table 1. Acceleration measurements for three different target points, 40 km/h, ≥70 km/h and station without stopping signal point. Between target points 40 km/h and ≥70 km/h no major difference could be determined. The average measurement for braking towards a station point indicates a higher retardation than when braking towards other signal targets. Retardation towards a station is 32% higher than ≥70 km/h targets and 26% higher than 40 km/h targets.
8
5.2. Train driving and ATC retardation curve (R-curve)
For the permitted braking curve, calculated according to chapter 3.3, the acceleration was determined according to Table 2. Note that stations without imperative stop signal target do not have any ATC retardation curve.
Train route Average acc. of R-curves [m/s2] No of breaking targets Average distance to R-curve 40 km/h target, drcurve [m] No of breaking targets Average distance to R-curve ≥ 70 km/h target, drcurve [m] 190312_7216 -0.875 0 N/A 4 536 190312_7233 -0.665 2 723 1 843 190312_7216 -0.792 2 563 3 969 190313_7209 -0.714 2 1027 5 1396 190313_7216 -0.831 0 N/A 4 1116 190313_7233 -0.762 3 958 3 1016 190313_7240 -0.861 1 509 4 625 190314_7209 -0.715 3 494 5 835 190314_7216 -0.804 0 N/A 5 873 190314_7233 -0.715 2 1135 3 784 190314_7240 -0.784 1 522 2 664 190318_7209 -0.774 2 726 3 577 190318_7216 -0.770 1 711 5 711 190318_7233 -0.812 3 1623 3 888 190318_7240 -0.779 2 988 5 988 190319_7209 -0.733 3 579 6 895 190319_7216 -0.751 1 729 5 1281 Average acceleration -0.773
Average distance to R-curve 838 882
Total no of targets 28 66
Table 2. Average acceleration for R-curve and distance from train to R-curve.
The result in Table 2 indicates that the unconditional ATC retardation curve is steeper than the actual train braking. If comparing train runs the R-curve admits in average 109% and 119% higher retardation without any ATC unconditional braking for 40 km/h and ≥70 km/h targets. The average distance to the unconditional braking point, is measured to 838m and 882m, which indicates no correlation between target point and distance.
5.3. RailSys simulation compared to real train driving
Run time simulation was performed with RailSys for all the measured train routes. The results are presented in Table 3. Average measured running time [hh:mm:ss] Average running time RailSys [hh:mm:ss] Diff RailSys – measured running time [hh:mm:ss] Timetable reference time [hh:mm:ss] Falköping-Sandhem 00:12:31 00:11:58 00:00:33 00:12:00 Sandhem-Mullsjö 00:07:18 00:06:47 00:00:31 00:07:00 Mullsjö-Habo 00:07:17 00:07:08 00:00:09 00:08:00 Habo-Bankeryd 00:05:06 00:04:51 00:00:15 00:05:00 Bankeryd-Jönköping 00:07:06 00:06:34 00:00:32 00:07:00 Jönköping-Huskvarna 00:05:50 00:04:58 00:00:52 00:06:00 Huskvarna-Tenhult 00:06:07 00:05:35 00:00:32 00:09:00 Tenhult-Forserum 00:06:59 00:06:38 00:00:21 00:07:00 Forserum-Nässjö 00:10:19 00:09:19 00:01:00 00:10:00
Running time and difference 01:08:34 01:03:48 00:04:46 01:11:00
9 Results for measured and simulated accelerations are presented in Figure 5. The average acceleration value for RailSys is 22% higher than measured train accelerations, and the average retardation value is 48% higher than the measured train retardation.
Figure 5. Measured acceleration compared to RailSys simulation on Jönköpingsbanan.
6. Discussion
The commercial RailSys simulation tool is used widely by signal planners for the design of ATC and ERTMS lines, and the aim with this study was to pinpoint the difference between real train driving and simulated traffic. In this section the results are discussed for each research question respectively.
There are different aspects of driving behaviour with different impact on the running time. Results revealed that the braking differs depending on the signal target. This is one aspect affecting the running time. The impact of pre-signalling on the distance to the permitted braking curve has not been studied. In general, all restrictive speed targets are signalled, but the distance differs depending on the signal target. On Jönköpingsbanan the pre-signalling distance varies between 1000m and 1600m, and the exact distance is likely to impact when the driver starts braking.
When studying the driving behaviour in relation to the ATC retardation braking curve, the margin to unconditional ATC limitation is high. One explanation can be that the driver is aware of the margins and seems to prioritize comfort issues. On the other hand, Jönköpingsbanan is a high trafficked single-track line, with limited possibilities to gain lost time, which likely also affects the driving behaviour. This phenomenon is most likely not found on a double track line, having higher gains in driving closer to the retardation curve. This is also a subject for further studies.
The results show significant differences in train acceleration and retardation, and one of the reasons is the driving behaviour. It is also shown that the real train acceleration and retardation is significantly lower than in micro-simulations of train traffic. The slope resistance has a large impact on the acceleration. For the 6-12‰ inclination slope between Jönköping and Forserum the maximum retardation is calculated to -0.13 m/s2. Curve, rotating mass
and rolling resistance also contribute to the retardation but to a lesser extent. In contrast the impact of driving behaviour is in the same order of magnitude as the slope resistance.
7. Conclusion
The train driving behaviour dependencies to ATC signaling targets and ATC retardation braking curve have been reviewed in this article. The results from the measurements on Jönköpingsbanan, a single-track line, shows that the margins to unconditional ATC braking is high. The braking differs depending on the signal target, and
10 retardation towards stations without any stop restrictions is more than 30% higher than retardation towards 40 km/h signaling points. Compared to the micro simulations in RailSys the measurements show significantly lower acceleration and retardation, which results in differences between measured and simulated running time.
References
Abadir Guirgis, G., & Peters, B. (2015). Simulatorbaserad utbildning i ERTMS -Utvärdering av utbildning och träning för lokförare i VTI:s tågsimulator. Retrieved from VTI notat 21-2015.
Abadir Guirgis, G., Peters, B., & Lidström, M. (2015). Lokförarutbildning i Sverige –Simulatoranvändning och ERTMS. Retrieved from VTI notat 13–2014.
Banverket. (2006). ATC - övervakningsfunktioner, BVH 544.30004.
Bendfeldt, J.-P., Mohr, U., & Muller, L. (2000). RailSys, a system to plan future railway needs. Computers in Railways, VII. EN 14067-2. (2003). European standard Railway applications ‒ Aerodynamics – Part 2: Aerodynamics on open track, CEN. Flykt, P. (2019). Personal communication.
Hedman, L. (2017). Use of Train simulator in Train driver education. Retrieved from http://www.nlc.nassjo.se/Lokfoerare Köhler, P., & Knutsen, D. (2017). Kapacitetssimulering Malmbanan år 2021. Retrieved from Trafikverket.
Lawson, H., Wallin, S., Brytse, B., & Friman B (2002). Twenty Years of Safe Train Control in Sweden. Racelogic. (2019). Manuals for Video VBOX. Retrieved from http://www.racelogic.co.uk/
RailwayTechnology. (2018). European Rail Traffic Management System (ERTMS). Retrieved from https://www.railway-technology.com/projects/european-rail-traffic-management-system-ertms/
Thorslund, B., Rosberg, T., & Lindström, A. (2019). User-centered development of a train driving simulator for education and training. Paper presented at the Rail Norrköping, Norrköping.
Trafikverket. (2016). Handledning för användning av tågtrafiksimuleringsverktyget RailSys på Trafikverket. Retrieved from Trafikverket. Trafikverket. (2019). Information about the Swedish rail network. Retrived from https://www.trafikverket.se/resa-och-trafik/jarnvag/Sveriges-jarnvagsnat/