The Effect of Log Position Accuracy on the Volume Yield in Sawmilling of Tropical Hardwood
12
0
0
Full text
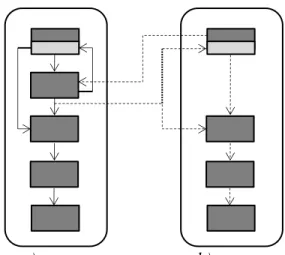
(2) bioresources.com. PEER-REVIEWED ARTICLE. sawmills, but an alternative solution is to build the scanning station separate from the saw line, so that anyone can scan logs upon payment. At the scanning station, the logs are scanned, the optimal positioning is determined, and the log is marked to indicate the optimal log orientation. These two scanning alternatives are illustrated in Fig. 1.. Log yard Scanning station Saw line (with positioning devices) Trimming/Drying/Packaging Market/Export. a). b). Fig. 1. The schematic representation of a proposed Mozambican sawmill layout with a logscanning station: a) as an integrated part of the saw-line and b) as an external scanning station where the sawmill uses log-shape data from the scanning station. The detaching of the scanning station from the saw line may reduce the equipment costs, but the log turning and feeder devices may still be onerous for a common sawmill. This makes it interesting to consider the possibility of positioning the log manually, using the positioning data from the scanning station. Regardless of the simplicity of the equipment used in Mozambique, to process the tropical hardwood species, the processing of the hardwood is in general difficult because of the large diameters and considerable irregularities in the logs. Many studies to increase the volume yield of hardwood have been conducted (Richards et al. 1979; Meimban et al. 1992; Lin and Wang 2012; Schajer 2016). There have also been extensive studies regarding the effects of log positioning, mainly for the softwood species from the “boreal region.” For instance, Lundahl and Grönlund (2010) found that the average volume yield can be increased by applying the optimal combination of rotation and parallel positioning, in cant-sawing and through-and-through sawing. Wessels et al. (2011) developed an algorithm, the tentacle algorithm, to find an optimal or close-to-optimal positioning solution by a limited number of iterations. They found that the tentacle algorithm performed better than the other evaluated algorithms in terms of the mean volume yield obtained. However, studies of the individual effects of each of the positioning parameters (offset, skew, and rotation) are scarce, especially for tropical species. For instance, Baltrušaitis and Pranckevičienė (2005) investigated the effect of offset logs with top diameters in the range of 14 cm to 32 cm. Berglund et al. (2013) and Fredriksson (2014) investigated the optimization of log positioning, but the effect of each sawing parameter was not discriminated. Tulokas and Vuorilehto (2007) investigated the effect of rotation in automatic log positioning equipment. Being able to determine the optimal log orientation before sawing is one step forward to improving the volume yield of sawn timber, but there are many factors that can influence the final result. In the suggested production models (Fig. 1), the marking of the optimal position on the log may introduce errors. Another important and challenging step is managing the proper position of the log on the headrig for logs with a very irregular Ah Shenga et al. (2016). “Log position in sawmilling,”. BioResources 11(4), 9560-9571.. 9561.
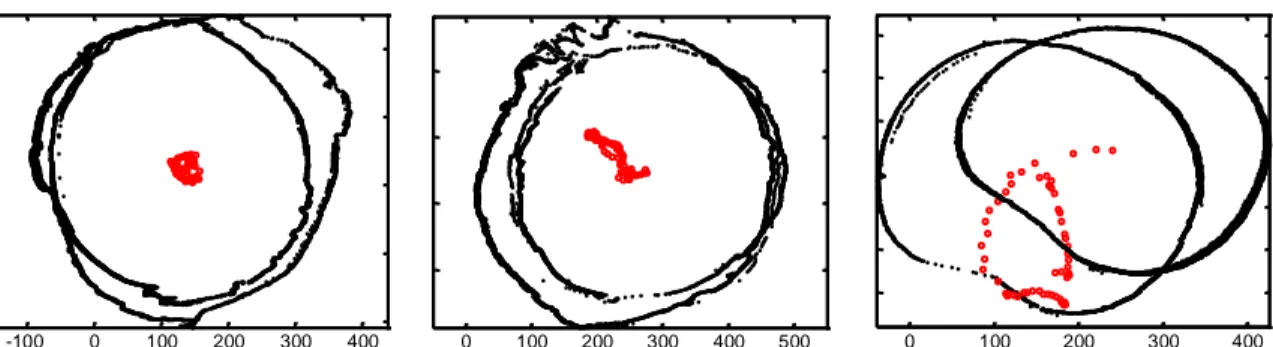
(3) PEER-REVIEWED ARTICLE. bioresources.com. shape or a large diameter. The present study was therefore performed to assess the effect of deviation from the optimal rotation, skew, and offset, and how these errors impact the volume yield. The objective was to investigate the effect of a deviation in the log positioning, around the optimal position, on the volume yield of sawn timber. Further, the effect of the log shape, i.e., straight logs or logs with a very irregular shape, on the volume yield when the log positioning deviates from the optimal position was also studied.. EXPERIMENTAL To investigate the effect of positioning error, i.e., the deviation in log positioning (offset, skew, and rotation) around the position that gives the highest possible volume yield of sawn timber, sawing simulations were performed based on scanned external shapes of logs from two tropical hardwood species. Materials A database of 15 logs of two tropical hardwood species, jambirre (Millettia stuhllmannii Taub.) and umbila (Pterocarpus angolensis DC.) was used. The logs were between 1.8 m and 3.8 m long and had a top diameter of between 23 cm and 39 cm. Ah Shenga et al. (2015) developed the database in an earlier study, and in the database, the outer shape of each log is described as a point cloud acquired using a 3D-laser scanner. The main reason for selecting these species was that this study wished to examine the effect of log shape on how the positioning accuracy influences the volume yield. Umbila is generally straight, and jambirre is crooked. For this study, the 15 logs were graded into two groups using crookedness as the criterion. Log crookedness The crook for each scanned log was determined in the following way: (1) at every 10 mm along the length of the log, the geometric center of the cross section was determined, i.e., the arithmetic mean position of all points that define the outer shape of the log at that position; (2) a straight line between the geometric centers of the outermost two cross sections of the log (the top and butt end of the log) was defined; and (3) the crook for each log was then calculated as the maximum distance from that line to the geometric centers of the cross sections. Examples of the different levels of crookedness are shown in Fig. 2. The geometric centers for the cross sections along the log, which can also be seen as an estimation of the pith location, are seen as dots in the central regions. A fairly straight log has all the geometric centers well centralized, while a crooked log has the geometric centers scattered all over the cross section view. Log grades The crook of the 15 logs in the database was computed, and a crook of 60 mm was chosen as the limit, which allowed the logs to be grouped into two grades. Grade 1 logs consisted of those with a crook of less than 60 mm and Grade 2 greater than or equal to 60 mm.. Ah Shenga et al. (2016). “Log position in sawmilling,”. BioResources 11(4), 9560-9571.. 9562.
(4) bioresources.com. PEER-REVIEWED ARTICLE. -100. 0. 100 200 (mm). 300. 400. 0. 100. a). 200 300 (mm). 400. 0. 500. 100. b). 200 (mm). 300. 400. c). Fig. 2. The cross-section view of the log periphery at the top and butt end of three logs from the database, and the geometric centers calculated at each 10 mm of the log length (the circles in the central region of the cross sections). The degree of log crookedness is illustrated as the scatter of the geometric centers: a) a fairly straight log, b) a single crooked log, and c) a double crooked or tortuous log. Methods The models of the scanned logs were used to simulate the sawing and to calculate the volume yield of sawn timber. Two sawing patterns, cant-sawing and through-andthrough sawing (Fig. 3), and three positioning parameters, offset, skew, and rotation, (Fig. 4), were used for the simulation. The sawing patterns commonly used in Mozambique sawmills are cant-sawing that is used to process sawn timber for export, and through-andthrough sawing that is used to produce sawn timber for the domestic market. Details about the two sawing patterns used are listed in Table 1, showing the setup for the virtual sawmill about board thickness for each log diameter class. The sawn timber was sharp edged (i.e., no wane), and the volume of the sawn timber was calculated as the sum of the sharp edged board volumes. The volume yield calculations were based on the scanned outer shape log volume (Ah Shenga et al. 2015). The edging was determined by fitting a maximum rectangle onto a board (Fig. 5), with a modular width of 5 mm. The length of the board was set as floating, but a minimum length was set to 20 cm (minimum length of parquet flooring piece). To compensate for the shrinkage that occur during drying of the green sawn timber, a 4% increase in board dimension was added to the target crosssectional dimensions (Table 1), regardless of the main direction of the wood. SB. Cant 1. Cant 2. SB. Bandsaw,a) kerf = 3 mm. SB. CB. SB. Bandsaw, kerf b) = 3 mm. Fig. 3. Sawing patterns used in the study: a) cant-sawing and b) through-and-through sawing. The grey areas represent sharp-edged centerboards and sideboards. Ah Shenga et al. (2016). “Log position in sawmilling,”. BioResources 11(4), 9560-9571.. 9563.
(5) bioresources.com. Skew. Offset. PEER-REVIEWED ARTICLE. Rotation. Fig. 4. Definition of the positioning parameters of offset, skew, and rotation. Sharp edged board Wane. Fig. 5. Flat view of a sawn board showing the principle for the edging procedure. The rectangle in the middle represents the maximum dimensions of a sharp edged board that can be achieved from a cant or an un-edged board. Table 1. Sawing Patterns for Cant-sawing and Through-and-through Sawing, Showing the Thickness of Sideboards and the Centerboards or Cants for Each Log Diameter Class (top diameter) Log diameter class (mm) No.. Sawing pattern (mm). Min.. Max.. cant-sawing. through-and-through. 1. 0. 249. 25, 25, 50, 50, 25, 25. 25, 25, 25, 25, 25, 25, 25, 25. 2. 250. 289. 25, 25, 75, 75, 25, 25. 25, 25, 25, 50, 50, 25, 25, 25. 3. 290. 329. 25, 25, 100, 100, 25, 25. 25, 25, 50, 50, 50, 50, 25, 25. 4. 330. 369. 30, 30, 100, 100, 30, 30. 30, 30, 50, 50, 50, 50, 30, 30. 5. 370. 409. 30, 50, 100, 100, 50, 30. 25, 50, 50, 50, 50, 50, 50, 25. 6. 410. 449. 30, 75, 100, 100, 75, 30. 25, 50, 50, 75, 75, 50, 50, 25. 7. 450. 489. 50, 75, 100, 100, 75, 50. 25, 75, 75, 75, 75, 75, 75, 25. Note: The grey marked values represent the thickness of sawn timber or cants for cant-sawing and centerboards for through-and-through sawing patterns, respectively. The width of sawn timber is defined by the maximum edged board fitted on sawn timber during edging. Three independent simulations were performed with following objectives: (1) to determine the optimal positioning (OP) for each log, i.e., the combination of the positioning parameters that resulted in the highest volume yield of sawn timber; (2) to evaluate the effect on the volume yield of a deviation in one positioning parameter at a time around the. Ah Shenga et al. (2016). “Log position in sawmilling,”. BioResources 11(4), 9560-9571.. 9564.
(6) bioresources.com. PEER-REVIEWED ARTICLE. OP; and (3) to evaluate the effect on the volume yield when all three positioning parameters were set to have random deviation around the OP. The code and simulation were carried out using Matlab software (MathWorks, USA). The code routine for the last two simulations were similar to the code used to determine the OP, but with changes in the intervals. Simulation of optimal positioning (OP) To determine the OP, the logs offset was set to vary from -100 mm to 100 mm in steps of 10 mm, skewed from -1° to 1° in steps of 0.5° and rotated 360° in steps of 5°. A total of 7665 combinations of the positions were tested for each log, and at each combination the volume of the sharp edged boards was calculated. The position that gave the highest volume yield was defined as the OP, and used as the input and reference position in the subsequent simulations. Influence of one positioning parameter at a time To evaluate the effect of the deviation in each of the positioning parameters around the OP, the offset was varied from -30 mm to 30 mm in steps of 1 mm. The skew was varied from -0.7° to 0.7°, in steps of 0.1° and the rotation was varied from -30° to 30° in steps of 1°. These simulations were executed by varying one positioning parameter at a time keeping the other two parameters fixed at OP values. For example, to test the effect of the deviation in rotation, the skew and offset were locked at the OP values, while the rotation was varied ± 30°. Figure 6 shows how the rotation was changed around the OP. OP OP-30º. OP+30º. Fig. 6. Cross-sectional view of a database log showing the principle for the rotation variation around the optimal positioning (OP). The volume yield was calculated when the log was rotated OP-30º and OP+30º (grey area), around the OP in increments of 1. Random variation in all positioning parameters To estimate how a deviation in the positioning parameters influences the total volume yield in a more practical situation, the variation intervals were limited for each position parameter, and the log positioning for the volume yield simulations were randomly selected. A simultaneous deviation in each positioning parameter around the OP was used, such that the offset was varied ± 15 mm, the skew ± 0.35°, and the rotation ± 15°. The interval of the rotation parameter was chosen within the standard deviation interval of 10° to 15°, which was reported by Tulokas and Vuorilehto (2007) when investigating the automatic log rotation of softwood. The interval ranges set for offset and skew parameters are believed to be realistic in practice.. Ah Shenga et al. (2016). “Log position in sawmilling,”. BioResources 11(4), 9560-9571.. 9565.
(7) PEER-REVIEWED ARTICLE. bioresources.com. Twenty randomly selected positions within these intervals were simulated for each log, resulting in 8,000 simulations for each log, and the cumulative mean value for the volume yield for each log grade and each sawing pattern was calculated. A standard t-test was used to evaluate results from the simulations.. RESULTS AND DISCUSSION Table 2 shows the average volume yield from cant-sawing and through-andthrough sawing patterns when the three positioning parameters (offset, skew, and rotation) were simultaneously optimized to find the log position that gave the maximum volume yield. The optimal position (OP) is then the position of the log that gives the maximum volume yield, and the ideal situation is when the log is positioned at the OP with a minimum of deviation. Unfortunately, because of large irregularities in many of the logs, the OP was difficult to determine visually. To analyze the importance of the log crook and the irregular outer shape, the logs were graded in two grades before the simulations. Six of the logs were classified as Grade 1, and nine of the logs were classified as Grade 2. The result in Table 2 show a large difference in volume yield at OP for the two log grades (around 14 percentage points). The difference in volume yield between grades is mainly due to the crookedness of the logs. In the more straight logs, Grade 1, the log center and the sawing pattern center coincide in each cross-section along the entire log while in Grade 2 logs there is a deviation between the log center and the pattern center along the log. Table 2. Simulated Volume Yield of Sawn Timber at Optimal Position (OP) when Varying all Positioning Parameters Simultaneously Log crook Grade 1 Grade 2 Sawing pattern CS TT CS TT Volume yield at OP* (%) 59.9 59.1 45.9 45.6 Standard deviation 4.46 4.36 8.39 6.94 Average Volume yield at OP** (%) 59.5 45.8 p value (CS ~ TT) 0.46 0.71 p value (CS1 ~ CS2 / TT1 ~ TT2) < 0.0001 * Optimal mean volume yield when varying one positioning parameter at time. ** Optimal mean volume yield of each log grade. CS – cant sawing, TT– through-and-through sawing, Grade 1 – logs with crook less than 60 mm and Grade 2 greater than 60 mm.. Within the groups with same log grade, the results show no significant difference between the cant-sawing and the through-and-through sawing patterns (Table 2, p value > 0.05). However, the result shows that there is a difference in volume yield between log grades, i.e., the Grade 1 logs gives higher volume yield than Grade 2 logs regardless of sawing pattern used (Table 2, p value < 0.0001). Table 3 shows the average decrease in volume yield when one of the log positioning parameters is varied at a time around the OP of the log, i.e., the mean value of all simulations in the interval. The results show that the decrease of volume yield of cantsawing is higher than on the through-and-through sawing.. Ah Shenga et al. (2016). “Log position in sawmilling,”. BioResources 11(4), 9560-9571.. 9566.
(8) bioresources.com. PEER-REVIEWED ARTICLE. For comparison, the mean decrease in volume yield for all Grade 1 logs when varying the offset was 9%, which is a higher than reported by Baltrušaitis and Pranckevičienė (2005) who showed a decrease in the volume yield between 2.7% and 8.3%. The reason of this difference may be caused by the high degree of crookedness of the sampled logs used on our study. Table 3. Simulated Average Decrease in Yield when Having Positioning Error in One Parameter and Keeping the Other Two at OP Log crook. Grade 1 CS. Sawing pattern. Grade 2 TT. SD. CS. TT. SD. SD. SD. Rotation -12.7 4.8 -11.5 3.3 -16.9 4.5 -11.9 3.0 Decrease in yield Offset -9.6 3.6 -8.7 2.9 -14.0 4.2 -7.7 1.7 (%) Skew -9.4 3.2 -8.4 2.3 -11.9 3.7 -7.1 1.5 CS – cant-sawing, TT – through-and-through sawing, SD – standard deviation (%). The Table 3 also shows that the through-and-through sawing pattern is less affected by the errors in positioning, which suggests that this sawing pattern should be used to achieve a high volume yield when having error in one of the log positioning parameters. Figures 7 and 8 show how the volume yield is decreasing when the positioning parameters are varying around the logs OP. Naturally, the volume yield decreases when the deviation from the OP increases. The larger slope of the curves, the more sensitive is the volume yield to deviation in the positioning parameters.. Offset. -0.7. -0.5. -0.3. Rotation. Skew (º) -0.1 0.1 0. Skew. 0.3. Offset. 0.5. 0.7. -0.7. -0.5. -10. -15. -20. -25 -10 0 10 Rotation (º) and Offset (mm). 0.3. 0.5. 0.7. -10. -15. -20. -30. Skew (º) -0.1 0.1 0. Skew. -5 Yield change (%). Yield change (%). -5. -0.3. Rotation. -20. 20. 30. -30. -20. -25 -10 0 10 Rotation (º) and Offset (mm). 20. 30. a) b) Fig. 7. The effects on the volume yield of sawn timber from deviations in the offset, skew, and rotation around the optimal position (OP) when varying one parameter at a time. Each dot is the mean value of six Grade 1 logs that were sawn according to: a) a cant-sawing pattern, and b) a through-and-through sawing pattern. The change in the volume yield is the percentage of reduction based on the maximum volume yield at the OP. The OP is indicated with the grey circle in the origin of the plot. Ah Shenga et al. (2016). “Log position in sawmilling,”. BioResources 11(4), 9560-9571.. 9567.
(9) bioresources.com. PEER-REVIEWED ARTICLE. Offset. -0.7. -0.5. -0.3. Rotation. Skew (º) -0.1 0.1 0. Skew. 0.3. Offset. 0.5. 0.7. -0.7. -0.5. -10. -15. -20. -25 -10 0 10 Rotation (º) and Offset (mm). 0.3. 0.5. 0.7. -10. -15. -20. -30. Skew (º) -0.1 0.1 0. Skew. -5. Yield change (%). Yield change (%). -5. -0.3. Rotation. -20. 20. 30. -30. -20. -25 -10 0 10 Rotation (º) and Offset (mm). 20. 30. a) b) Fig. 8. The effects on the volume yield of sawn timber from deviations in the offset, skew, and rotation around the optimal position (OP) when varying one parameter at a time. Each dot is the mean value of nine Grade 2 logs that were sawn according to: a) a cant-sawing pattern, and b) a through-and-through sawing pattern. The change in the volume yield is the percentage of reduction based on the maximum volume yield at the OP. The OP is indicated with the grey circle in the origin of the plot. Overall, the figures confirm the results in Table 3, showing that the rotation is the most important parameter for the volume yield. Similar conclusion was reported by Todoroki (1995), who investigated the log rotation effect of crooked logs. The result also show that the offset was the second most important parameter followed by skew. Similar finding was reported by Wessels (2009) who studied the optimization of the cant-sawing process for pine logs. The largest change in volume yield can be seen when Figs. 7a and 8a are compared, showing a difference in performance for cant-sawing when applied on straight logs (7a) and on crooked logs (8a). Another trend is that the volume yield decrease for cant-sawing is more scattered than for the through-and-through sawing which also can be seen in Table 3 (SD values). A large scatter means that the volume yield is sensitive to small variation in a log positioning parameter. Figure 9 shows the accumulated average volume yield decrease when offset, skew, and rotation were simultaneously varied randomly around the OP. These simulations were done to show a “more practical case” in which a sawmill has full information about the positioning parameters of the logs at OP, but having random errors in all three positioning parameters at the same time. It should be noted that the investigated interval of variation is narrower than in Figs. 7 and 8, and it was set to considering manual positioning. The results in Fig. 9 show that for straight logs (Grade 1) the volume decrease is about 9.8% for both sawing patterns, cant-sawing being just slightly better. For crooked logs (Grade 2), a very large difference in volume yield decrease could be seen where through-and-through sawing had an average decrease in volume yield of about 7.7% compared to 12.5% in cant-sawing.. Ah Shenga et al. (2016). “Log position in sawmilling,”. BioResources 11(4), 9560-9571.. 9568.
(10) bioresources.com. PEER-REVIEWED ARTICLE. The larger difference of the decrease in Grade 2 logs is because the effect of noncoincidence of the log center and the sawing pattern center in each cross-cut along the log length is more severe when using cant-sawing than through-and-through sawing. Thus, the through-and-through sawing should be applied when crooked logs are sawn. 0 -6. 1000. 2000. Number of simulations 3000 4000 5000. 6000. 7000. 8000. Volume yield change (%). -7 -8 -9 -10 -11 -12 -13 CS - Grade 1. TT - Grade 1. CS - Grade 2. TT - Grade 2. Fig. 9. The accumulated average decrease in the volume yield of sawn timber for Grade 1 and Grade 2 logs when all three positioning parameters were simultaneously and randomly varied around the OP. CS cant-sawing, TT through-and-through sawing. To give some volume yield numbers based on our study, and compare the predictions to reality, the following calculation was made. Consider that a sawmill has obtained access to the optimal positioning parameters of each log and using manual positioning with random error in each parameter, similar to the simulation results shown in Fig. 9. The volume yields of the sawmill were calculated in relation to the volumes yields at the optimal positioning from the simulation 1, when varying simultaneously all positioning parameters (Table 2, grade 1 – 60% and grade 2 – 46% ). The calculation gives volume yields of 54% for Grade 1 and 41% for Grade 2 logs what is larger volume yield than the 35% of volume yield reported in Mozambique today. The 35% is based on measurements through surveys. The results of this study show that it is possible to considerably improve the volume yield and that there are strong arguments to put emphasis on improvements in log positioning systems and technique to reduce the positioning errors with aid of measurement and controlled positioning devices at Mozambique sawmills. The idea presented here, a scanning station in which logs can be marked to indicate the optimal position of the log and the position of the first cut could be a possible solution to increase the yield and an important task for future. This study is somewhat limited by the fact that the sample consisted of only 15 logs, but considering that the log shape is in focus in the study, the results is a good indication of the potential of log positioning and selection of sawing pattern to increase the volume yield of tropical timber. Ah Shenga et al. (2016). “Log position in sawmilling,”. BioResources 11(4), 9560-9571.. 9569.
(11) PEER-REVIEWED ARTICLE. bioresources.com. CONCLUSIONS 1.. The rotation is the log positioning parameter that most affects the volume yield, and the offset is the second most important positioning parameter, followed by the skew.. 2.. The variation in the volume yield associated with a deviation in the positioning of the log before sawing can reduce the volume yield of sawn timber between 7.7% and 12.5%. 3.. For Grade 1 logs i.e., fairly straight logs, the choice between the cant-sawing and the through-and-through sawing pattern is not important for the volume yield. To achieve as high volume yield for crooked Grade 2 logs, the cant-sawing pattern should be avoided and through-and-through sawing pattern being used.. 4. The results indicate that the use of data indicating the orientation of the optimal positioning from a proposed scanning station would considerably increase the volume yield.. REFERENCES CITED Ah Shenga, P., Bomark, P., Broman, O., and Sandberg, D. (2015). “Simulation of tropical hardwood processing: Sawing methods, log positioning, and outer shape,” BioResources 10(4), 7640-7652. DOI: 10.15376/biores.10.4.7640-7652 Baltrušaitis, A. and Pranckevičienė, V. (2005). “The influence of log offset on sawn timber volume yield,” Materials science (Medžiagotyra) 11(4), 403-406. Berglund, A., Broman, O., Grönlund, A., and Fredriksson, M. (2013). “Improved log rotation using information from a computed tomography scanner,” Computers and Electronics in Agriculture 90, 152-158. DOI: 10.1016/j.compag.2012.09.012 Fredriksson, M. (2014). “Log sawing position optimization using computed tomography scanning,” Wood Material Science & Engineering 9(2), 110-119. DOI: 10.1080/17480272.2014.904430 Lin, W. and Wang, J. (2012). “An integrated 3D log processing optimization system for hardwood sawmills in central Appalachia, USA,” Computers and Electronics in Agriculture 82, 61-74. DOI: 10.1016/j.compag.2011.12.014 Lundahl, C. G. and Grönlund, A. (2010). “Increased yield in sawmills by applying alternate rotation and lateral positioning,” Forest Products Journal 60(4), 331-338. DOI: 10.13073/0015-7473-60.4.331 Meimban, R. J., Mendoza, G. A., Araman, P., and Luppold, W. (1992). “A simulation model for a hardwood sawmill decision support system,” Journal of Forest Engineering 4(1), 39-47. DOI: 10.1080/08435243.1992.10702643 Richards, D. B., Atkins, W. K., Hallock, H., and Bulgrin, E. H. (1979). “Simulation of hardwood log sawing,” (http://oai.dtic.mil/oai/oai?verb=getRecord&metadataPrefix=html&identifier=ADA0 80874), Accessed on February 26, 2016. Schajer, G. S. (2016). “Wood machining: Past achievements, present capabilities, future opportunities,” Wood Material Science & Engineering 11(3), 127-134. DOI: 10.1080/17480272.2015.1112833. Ah Shenga et al. (2016). “Log position in sawmilling,”. BioResources 11(4), 9560-9571.. 9570.
(12) PEER-REVIEWED ARTICLE. bioresources.com. Todoroki, C. L. (1995). “Log rotation effect on carriage sawing of swept logs,” New Zealand Journal of Forestry Science 25(2), 246-255. Tulokas, T., and Vuorilehto, J. (2007). “Improvement potential in log rotation,” Baltic Forestry 13(2), 221-228. Wessels, C. B. (2009). “Cant sawing log positioning optimization: Solution simulation study,” Forest Products Society 59(4), 17-22 Wessels, C. B., de V du Plessis, J., and Smit, N. (2011). “Cant sawing log positioning in a sawmill: searching for an optimal solution,” Southern Forest: A Journal of Forest Science 73(1), 15-22. DOI: 10.2989/20702620.2011.576486 Article submitted: June 1, 2016; Peer review completed: July 11, 2016; Revised version received and accepted: September 15, 2016; Published: September 23, 2016. DOI: 10.15376/biores.11.4.9560-9571. Ah Shenga et al. (2016). “Log position in sawmilling,”. BioResources 11(4), 9560-9571.. 9571.
(13)
Figure


+3


Related documents
Generally, a transition from primary raw materials to recycled materials, along with a change to renewable energy, are the most important actions to reduce greenhouse gas emissions
För att uppskatta den totala effekten av reformerna måste dock hänsyn tas till såväl samt- liga priseffekter som sammansättningseffekter, till följd av ökad försäljningsandel
Från den teoretiska modellen vet vi att när det finns två budgivare på marknaden, och marknadsandelen för månadens vara ökar, så leder detta till lägre
The increasing availability of data and attention to services has increased the understanding of the contribution of services to innovation and productivity in
Generella styrmedel kan ha varit mindre verksamma än man har trott De generella styrmedlen, till skillnad från de specifika styrmedlen, har kommit att användas i större
Parallellmarknader innebär dock inte en drivkraft för en grön omställning Ökad andel direktförsäljning räddar många lokala producenter och kan tyckas utgöra en drivkraft
Närmare 90 procent av de statliga medlen (intäkter och utgifter) för näringslivets klimatomställning går till generella styrmedel, det vill säga styrmedel som påverkar
Den förbättrade tillgängligheten berör framför allt boende i områden med en mycket hög eller hög tillgänglighet till tätorter, men även antalet personer med längre än
