By
Vincent V. Salomonson
Department of Atmospheric Science Colorado State University
Fort Collins, Colorado
The research was funded by the National Aeronautics and Space Administration Contract No. NASr-147
Project director: Dr. William E. Marlett August, 1968
by
Vincent V. Salomonson
The research described in this report was funded by the
National Aeronautics and Space Administration Contract No. NASr-147
Project Director: Dr. William E. Marlatt
Department of Atmospheric Science Colorado State University
Fort Collins, Colorado August, 1968
ANISOTROPY IN REFLECTED SOLAR RADIATION
The objective of this study was to observe in some detail the nature of the reflection process for several specific surfaces and show in the case of clouds that the reflection of solar radiation is accomplished by several processes which interact with one another to produce the
observed directional reflectance distributions. The first
portion of this study utilized an aircraft-mounted satellite radiometer to observe the reflected radiances over stratus clouds, white sand, snow, a dry desert lake bed, a grassland-sad surface, a swampy-dense vegetation surface, and water. The second portion of this study involved the utilization of existing scattering theory to numerically examine the influence: of droplet size distribution and droplet con-centrations on single scattering results representative of that occurring in the clouds over which the
observa-tions of reflected solar radiation were taken. This
por-tion of the study also compared theoretical results involv-ing multiple scatterinvolv-ing with the results actually observed over stratus clouds.
Anisotropy in the reflected solar radiation was
observed in varying degrees for all the surfaces studied. The anisotropy for all surfaces increased with increasing
solar zenith angle. At large solar zenith angles forward
over soil and vegetative surfaces. The scatterin~ from stratus clouds was observed to be a function of the
thick-ness of the clouds and the reflectivity of the s' ~face
beneath the clouds.
The computed single scattering results were found
to be most sensitive at scattering angles near
a
and 100degrees to changes in the droplet size distribution and
associated droplet concentration in a cloudy volume. It
was found that multiple scattering smooths the anisotropy and other effects suggested by single scattering results. Remarkably good agreement was evident in comparisons of the anisotropy predicted by some theoretical results including multiple scattering and that actually observed over stratus clouds.
The author wishes to thank Dr. William E. Marlatt for his patience, time, and supoort during the time required to accomplish the research described in this
report. Appreciation is also expressed to Professors
Lew i sO. G ran t, Norm a n A. E van s, and Bra d for dR. Be an fo',. taking the time to read and comrent on the manLi-script.
The professional and conscientious contributions toward acquisition of the data that were made by the pilot of the aircraft, Mr. Dwain D. Adam, are greatly
appreci'ated. Mr. Donald W. Hill and Mr. Gary M. Cobb
made essential contributions to the final results through their technical knowledge and assistance. Mrs. Sandra Olson is commended for her care and attention to detail in typing the manuscript.
The funding of this research by the National Aero-nautics and Space Administration through Contract No. NASr-147 is gratefully acknowledged.
List of Tables ... ·viii
List of Figures .•.•... ·· ... ix
List of Symbols ... xiv
Introducti on ... . Chapter I: MEASUREMENTS OF ANISOTROPY IN REFLECTED SOLAR RADIATION... 4
1.1 Introduction ... , ... 4
1.2 Instrumentation... 7
1.3 Assumptions and Definitions ... 12
1.4 Field Measurements and Analysis ... 15
1.5 Results of Field Measurements ... 19
1.6 Discussion of Results ... 34
1.7 Conclusions ... 47
Chapter II: A THEORETICAL FRAMEWORK FOR ANALYZING SCATTERING FROM STRATUS CLOUDS... 50
2.1 Introducti on. . . .. . . .. 50
2.2 The Equation of Radiative Transfer ... 51
2.3 The Mie Theory ... 57
2.4 The Intensity and Polarization ... 82
2.5 The Scattering Coefficient ... 84
2.6 The Scattering Coefficient and Intensity Functions for a Polydispersed Particulate Volume ... 88
Chapter III: SINGLE AND MULTIPLE SCATTERING RESULTS--COMPUTED AND OBSERVED ... 90
3.1 Difficulties in Numerically Simulatinq Observed Resul ts. . .. . . ... .. .. . . .. . . .. . .. 90
3.2 Procedure ... 91 vi
Paoe No. 3.3 Results and Discussion ....•... 102 3.4 A Comparison of Ohserved and CO~Duted
Resu1ts ... 109
Chapter IV: A SUMMARY AND RECOMMENDATIONS FOR
FURTHER RESEARCH ... 116
4. 1 S u mm a r y ..•.•.•....••...•...••••..•••.•••. 1 1 6
4.2 Recommendations ...•... 119
REFERENCES ... 121
APPENDIX: FURTHER REFLECTANCE RESULTS OVER
VARIOUS SURFACES ...•... 127
No. Caption No. 1.5.1 A summary of fliqhts over different
reflect-ing surfaces and" the associated conditions... 20 1.5.2 Integrated directional reflectances and
relative anisotropy observed by the NIMBUS
F-3 MRIR over different surfaces at varying
solar zenith angles ... " ... 38
3.2.1 A summarv describinq comnutations of P,/4n,
P2/4n, a~d POL vers~s G for three diff~rent
wavelengths and droplet size distributions ... 101
F i q. r~ 0 • 1. 2.1 1. 2.2 1 .2.3 1 . 3. 1 1. 5.1 1. 5.2 1. 5.3 1. 5. 4 1. 5.5 1 .5.6
A sketch sho~/inq ho(.o,' thp :lirnbus ~~RIR was
11lounteci on a Pi'ler Tl'Jin r:OI';nnche ....•.•..••• 9 NimbllS ["--3 fllPcjiul1i rr~('.olutinn radiometer
( MR T R ) • • • • • • • • • • . • • • • • • • • . . • • . • • . • • • • • • • • • •• 10 Snectra1 resnonse characteristics of the
Sol-a-meter (silicon cell) and the two
channels of the Nimbus F-3 ~RIR
resnond-inq to solar radiation ... 11 Radiation geometry ... 13 Reflectances over stratus clouds near San
Francisco, California, on 17 July 1965, 0754-0840 PST (l,;0=45-540 ) , showing the
hemispheric variation of
r/(r)o
versusrelative azimuth ~ and radiometer zenith
angle 8 for the wavelength intervals
0.55-0.85~,
(a),
and for 0.2-4.0~, (b). Part (c)shows
r
versus e in the principal plane ... 25Same as Fig. 1.5.1 except that the reflec-tances are over stratus clouds near Bakers-field, California, on 14 December 1966,
1127-1148 PST (l,; =57-58°) ... 26
°
Same as Fig. 1.5.1 except that the reflec-tances are over stratus clouds near Logan, Utah, on 16 December 1966, 1031-1114 MST
(z:; =66-70°) ... 27
°
Same as Fig. 1.5.1 except that the
ref1ec-tances are over snow near Logan, Utah, on
16 December 1966, 1031-1114 MST (~
=66-70°) ... ~ ... 28
Same as Fig. 1.5.1 except that the ref1ec-tances are over white gypsum sand near
Alamogordo, New Mexico, on 29 October 1966,
0917-0946 MST (~ =57-61°) ... 29
°
Same as Fig. 1.5.1 except that the reflec-tances are over Bristol Lake, northeast of
Twenty-nine Palms, Ca1ifornia
o
on 15 December1966, 1234-1257 PST (z:; =58-59 ) ... 30
°
1 .5.8 1 .6. 1 1. 6.2 1. 6.3 2.3. 1 3.2. 1 3.3. 1 3.3.2 3.3.3
tances are" over a grass~and-sDd surface near Briggsdale, Colorado, on 4 November
- 0) 31
1965, 1215-1241 MST (r; =59-63 ... .
o
Same as Fig. 1.5.1 except that the reflec-tances are over a swampy, dense veqetation surface near Tallahassee, Florida, on 6 January 1967, 1039-1109 EST (s =56-61°)
o 32
Same as Fiq. 1.5.1 excent that the reflec-tances are~over a qrassland-sod surface near Briggsdale
o
Colorado, on 25 October 1966, (~ =66-69). The height ~bove thesurface ~as 1370m ... 43 Same as Fig. 1.5.1 except that the
reflec-tances are over a grassland-sod surface near Briggsdale, Colorado, on 25 October 1966, 0934-0957 MST (so=59-62°). The
height above the surface was 610 m ... 44 The observed distribution of reflectance
(r') in the principal plane over a water surface near Oceanside, California, on 13
December 1966, 0952-1020 PST (~ =63-66°) .... 46
°
A simplified spherical coordinate system .... 61 Droplet size distributions used in
comput-ing intensity and polarization versus scat-tering angle at wavelengths of 0.573, 0.620, and 0.740 microns ... 97 The intensity functions and polarization
versus scattering angle for a cloudy volume with the n1 droplet distribution illuminated by radiation of 0.573~ wavelength ... 103 The intensity functions and polarization
versus scattering angle for a cloudy volume with the n1 droplet distribution illuminated by radiation of 0.740~ wavelength ... 104 The intensity functions and polarization
versus scattering angle for
a
cloudy volume with the n droplet distribution illuminated by radiation of 0.620~ wavelength ... 1053.3.4 3.3.5 3.4. 1 3.4.2 3.4.3 A.1. A.2 A.3
The intensity functions and polarization versus scattering angle for a cloudy volume with the n2 droplet distribution
illuminated by radiation of 0.620~
wave-length ... 106 The intensity functions and polarization
versus scattering angle for a cloudy volume with the n3 droplet distribution
illuminated by radiation of 0.620~
wave-length ... 107
A comparison of the results observed by
the narrow bandpass of the MRIR over
stratus clouds on 14 December 1966 and computed multiple scattering results from
Kattawar and Plass (1968a, Fig. 3) using
a cumulus cloud droplet distribution ... 111 A comparison of the results observed by
the narrow bandpass of the MRIR over
stratus clouds on 11 June 1965 and
computed multiple scattering results from Kattawar and Plass (1968a, Fig. 3) using
a cumulus cloud droplet distribution ... 112 A comparison of the results observed by
the narrow bandpass of the MRIR over
stratus clouds on 15 December 1966 and computed multiple scattering results from Kattawar and Plass (1968a, Fig. 3;1968b, Fig. 8) using cumulus and nimbostratus
cloud droplet distributions ... 113 Same as Fig. 1.5.1 except that the
reflec-tances are over stratus clouds near San Francisco, California, on 11 June 1965,
1146-1226 PST (l;; =16-17°) ... 128
°
Same as Fig. 1.5.1 except that the reflec-tances are over stratus clouds near San Francisco, California, on 17 July 1965,
1137-1225 PST (l;; =17-18°) ... " ... 129
°
Same as Fig. 1.5.1 except that the ref1ec-tances are over stratus clouds near San Francisco, California, on 11 June 1965,
0646-0734 PST (~ =58-68°) ... 130
°
tances are over stratus clouds near Bakers-field, California, on 14 December 1966,
1352-1415 PST (~ =63-66°), ... 0. 131
°
A.5 Same as Fig. 1.5.1 except that the
reflec-tances are over stratus clouds near
Bakers-field, California, on 15 December 1~66,
( _ 0) 132
0818-0839 PST ~ -76-79 ... .
°
A.6 Same as Fig. 1.5.1 except that the
ref1ec-tances are over snow near Laramie, Wyoming,
on 10 December 1966, 1040-1112 MST (~ =
°
.
°
63-65 ) ... ·133
A.7 Same as Fig. 1.5.1 except that the
reflec-tances are over snow near Laramie, Wyoming,
on 10 December 1966, 0715-0818 MST (~ =
82-86°) . . . . • . . . • . . . • • . . . • . . . ~ ... 134
A.8 Same as Fig. 1.5.1 except that the
ref1ec-tances are over white gypsum sand near Alamogordo, New Mexico, on 15 August 1965,
1120-1153 MST {~=20-22°) ... 135
°
A.9 Same as Fig. 1.5.1 except that the
reflec-tances are over white gypsum sand near Alamogordo, New Mexico on 29 October 1966,
1155-1231 MST {t ~47-49°) ....•... 136
°
A.10 Same as Fig. 1.5.1 except that the
reflec-tances are over white gypsum sand near
Alamogordo, New Mexico, on 30 October 1966,
0913-0939 MST (~=57-61°) ... 137
°
A.l1 Same as Fig. 1.5.1 except that the
reflec-tances are over white gypsum sand near
Alamogordo, New Mexico, on 29 October 1966,
0706-0749 MST (~ =76-82°) ... 138
°
A.12 Same as Fig. 1.5.1 except that the
reflec-tances are over Bristol Lake, northeast of
Twenty-nine Palms, Californiad on 15 December
1966, 1445-1504 PST (~ =70-73 ) ... 0 • • • 0.0139
J
A.13 Same as Fig. 1.5.1 eXcfpt that the
reflec-tances are over a grassland-sod surfQ:e near
Briggsdale, Colorado, on 4 Novembe~ 1965,
1253-1316 MST (I; =57-59°) ... 14(;
o
A.14 Same as Fig. 1.5.1 except that the reflec-tances are over a grassland-sod surface
near Briggsdale s Colorado, on
04 November
1965s 1337-1354 MST (~ =55-57 } ... 141
°
A.15 Same as Fig. 1.5.1 except that the
ref1ec-tances are over a grassland-sod surface near Briggsdale, Colorado, on 25 October
1966, 1606-1630 MST (~ =78-82°} ... 142
°
A.16 Same as Fig. 1.5.1 except that the
reflec-tances are over a swampy, dense vegetation surface near Tallahassee, Florida, on 6
January 1967, 1555-1617 MST (~ =70-73°) ... 143
°
a o A b B c
=
positive constant in general dropletdistribution
=
lower and upper limits of integrationover a droplet size distribution
= coefficient for the scattered
electro-magnetic field
= modal droplet radius
=
area= coefficients for the transmitted
electro-magnetic field
= positive constant in droplet size
distri-bution
= coefficient for the scattered
electro-magnetic field
=
coefficients for the scatteredelectro-magnetic field
=
magnetic induction vector= speed of light
= scattering cross section
=
electric displacement vector= electric field vector
=
amplitude of the electric field=
radiant energy= electric field component of the electric
wave
=
electric field component of the magneticwave
=
component of the electric field vectorin the e direction
E F F p o H p
HI
P H2 P i I \)= component of the electric field vector
in the p direction
net flux
= a function whose independent variable is ~
=
net flux column matrix= magnetic field vector
=
amplitude of the magnetic field= magnetic field component of the electric
wave
= magnetic field component of the magnetic
wave
= component of the magnetic field vector in the
e direction
= component of the magnetic field vector in the
cp direction
= component of the magnetic field vector in the
p direction
=
Hankel function of the first kind= Hankel function of the second kind
= (_1)1/2
= dimensionless intensity functions
= intensity component parallel to the meridional
plane passing through the local vertical and the direction of propagation of the intensity vector
= intensity component perpendicular to the
plane defined above
=
specific intensity=
current density vector=
ordinary Bessel functionk2 k k 0 !l. m m 0 n n I n(a) ,n1 ,n2 ,n3 N N o N' p(cose) 1P POL rl iw = c = -k1k2 = ~
=
21T C t-o=
integer=
integer= complex index of refraction
=
real part of the complex index of refraction=
absorptive or imaginary part of the complexindex of refraction
=
droplet size distributions= radiance observed by the radiometer
= radiance observed by the radiometer when
its field of view 1S completely filled by
an ideally diffuse reflector of unit reflectivity illuminated by the solar constant at normal incidence
=
spectral radiance observed by theradio-meter
= droplet concentration in grams per cubic
meter
= Neumann function
= integer
= associated Legendre polynomial
=
intensity function for a polydispersedparticulate
= p(s,¢;S;¢I)
=
phase function or indicatrix=
phase matrix=
polarization= N/N = reflectance
o
r o
-
r R s S SI S SIv
integrated directional reflectance
=
averaqed value of reflectanceavera~e reflectance observed at 8=00
a function whose independent variable is p
= 1 ength
=
the component of the solar constant normalto the reflecting surface
=
the total incoming energy measured by theSol-a-meter
=
solar spectral irradiance impinging uponthe earth at the mean distance between the sun and the earth
=
the component of SOA normal to, and actuallyimpinging upon the reflecting surface
=
time averaged Poynting vector= flux produced by the interference of the
incident and scattered radiation
= scattered component of the Poynting vector
=
incident component of the Poynting vector-=
radial component of S= time
= a function whose independent variable is G
=
an intensity or Stokes parameter related tothe plane of polarization
=
electric potentialOebye potentials
=
magnetic potential=
an intensity or Stokes parameter relatedto the ellipticity of polarization
=
total energy scattered by a spherey z Zl a y n n 8 8
used in conjunction with the Mie Theory
=
lower and upper limits of integration overa droplet size distribution using x as the variable of integration
=
scalar quantity= one axis of a cartesian coordinate system
perpendicular to a plane parallel atmosphere
= one axis of a cartesian coordinate system
oriented parallel to the direction of propa9ation at the incident ray
= a positive constant in a general droplet
size distribution
= constant
= volumetric scattering coefficient
= constant
= a positive constant in a general droplet
size distribution
= dielectric constant
=
solar zenith angle=
cos 8=
cos 8~=
cos 8=
radiometer zenith angle or the angle ofthe outgoing radiation measured with respect to the outgoing normal to an element of area
=
zenith angle of scattered radiation=
scattering angleA o 1.1 \J 'IT 'lTQ, p
-p ~ o w=
wavelength = wavelength in a vacuum=
micron (lO-4centimeters)=
frequency of electromagnetic energy=
permeability= 3.1415926536
=
angle dependent function in the expressions for the scattered field = Pi(cose)/sine=
radius=
density of scattering material= charge density
= kp
=
electroconductivity= optical depth
~ angle dependent function in the expressions for the scattered field
=
dPi(cose)/de=
azimuth or radiometer azimuth=
azimuth of the sun= azimuth in spherical coordinate system
= an unspecified function
= spectral response of the MRIR
= relative azimuth
=
field frequencyQ"
=
solid a n9l e corresponding to the scatteredradiation
( ( s ) )
=
designates the scattered wave( ( t) )
=
designates the transmitted wave( ( ;) )
=
desiflnates the incident wave(*)
=
designates the complex conjugateRe
=
indicates the real part of a complex quantity( ( d)
=
refers to the region outside the scatteringsphere
( ( 2 ) )
= refers to
sphere the region inside the scattering
( 0) = degrees
INTRODUCTION
One of the most significant, but still not fully explained, occurrences that takes place in the earth-atmosphere system is the redistribution and transforma-tion of the incominq enerqy from the sun. A major por-tion of the solar energy which impinges upon this system is reflected by terrestrial surfaces and eventually does not contribute to the various weather phenomena that are of importance to all aspects of life on earth. It was the objective of this study to observe in some detail the nature of the reflection process for several specific surfaces and show in the case of clouds that the reflec-tion of solar radiareflec-tion is accomplished by several pro-cesses which interact with one another to produce the observed directional reflectance distributions.
The first portion of this study consists of describinq and interpreting reflectance observations made with an
aircraft-mounted satellite radiometer over seven different types of surfaces. These observations serve to show that appreciable anisotropy in the reflected radiation does exist and that the ma9nitude of the reflectances varies
in isolated portions of the solar spectrum dependinq upon the surface being observed and its spectral reflectivity. The implications of these observations will be related to the problem of determining the planetary albedo fro~ meteor-oloqical satellite radiometers with a limited field of view.
processes which produce the observed anisotropy in reflected solar radiation observed over clouds. This choice was ~ade, first of all, because of the wide dis-tribution of clouds throuahout the earth's atmosphere and their important contribution to the planetary albedo. Secondly, the possibility of mathematically modelinq a cloud, particularly a stratus cloud, and its reflection properties is much greater than for the majority of the other reflecting surfaces considered here. Furthermore, an appreciation of the processes involved in the transfer of radiant energy in a cloud is of great use to the atmos-pheric scientist insofar as the applicability of this know-ledge to other radiative transfer situations that take place in the atmosphere is concerned.
This second portion consists of two sub-parts. The first sub-part will review the necessary and important por-tions of radiative transfer and electromagnetic theory that are the basis for numerical computations designed to dupli-cate observed scattering and absorption processes taking place in a cloudy atmosphere. In particular, the basic equation of radiative transfer, the equations for
describ-ing the diffraction of an electromagnetic wave by a sphere, and the scattering of electromagnetic energy by
poly-dispersed particulate volumes is described and developed in some detail. The second sub-part describes and illus-trates the results of numerical computations involving
sinole and multiple scatterinq. These results show the effects of varyin~ droplet size distribution, droplet concentration. and optical depth on reflectances observed at various individuill wclvplenqths and over a portion of the solar spectrum includinq ')('veral wavelengths. In particular, it is shown thilt the observed results do agree, in general. with published comrutations including multiple scatterinn.
In addition to the above, conclusions are drawn and brief recommendations made as to the feasibility and
practicality of inferring the characteristics of a cloudy volume from the character of the scattered light. Recom-mendations are made as to further computations and obser-vations that could and should be made to further verify and sUbstantiate the results and conclusions drawn in this study.
MEASUREMENTS OF ANISOTROPY IN REFLECTED SOLAR RADIATION
1.1. Introduction
The weather satellite has provided meteorologists with the means whereby larqe portions of the earth's surface and
atmosphere can be observed in a relatively short time. As
satellite technology has developed, it has become increas-ingly evident that by using a satellite equipped with suit-able radiometers, one can measure the various components of
the radiative energy balance. This means that the satellite
is capable of providing valuable data enabling one to deter-mine the amount of energy available for driving atmospheric
processes on time and distance scales corresponding to the meso and macro scales of motion.
One of the difficulties which has hampered progress in this realm of study is that the radiation reflected
from most surfaces is not isotropic. Since the majority
of satellite radiometers have a limited field of v~ew,
they cannot measure the total energy reflected from a
surface in all directions at any particular moment. In
order to determine the amount of energy reflected in all directions, it is necessary to either measure the energy reflected in all directions, or to make one measurement and combine it with a prior knowledge of the directional
character of the reflected energy. Since present
meteoro-logical satellite systems are not capable of measuring reflected energy in all directions simultaneously, the
need for an improved knowledge of surface reflection
characteristics was what originally prompted the research reported here (Study Conference on the Global Atmospheric
Research Pro~ramme, 1967, pp 46-47, 65).
Bandeen, et al. (1965) used satellite measurements
to estimate the albedo of the earth. In that study it
was necessary to assume that the reflection from all surfaces was isotropic and independent of wavelength. When these assumptions were used, the resulting values of annual planetary albedo did not balance the correspond-ing reliable values of emitted thermal radiation and
incom-ing s01ar radiation. Eventually it was necessary to apply
a simple correction factor in order to achieve this balance.
Viezee and Davis (1965) have also reported on difficulties
encountered in using satellite measurements to obtain the
albedo of cloudy regions. More recently Ruff et. al. (1968)
have reported on a statistical analysis of TIROS IV obser-vations that enabled them to derive reflection patterns representative of the average results from a large number
of cloud observations and cloud types. All of the studies
mentioned above have served to emphasize that the reflection from most surfaces is neither isotropic nor independent of
wavelength. Furthermore, each indicated that the
deter-mination of the total reflected solar energy from a surface or surfaces is a very difficult task when using satellite measurements.
Coulson (1966), Coulson, et al. (1965), Hapke and Van Horn (1963), and Chen, et al. (1967) have reported on measurements made in the laboratory of anisotropically reflected radiation from soils, sands, and vegetation. Kozlov and Federova (1962) and Bartman (1967), using air-planes and balloons respectively, have measured
aniso-tropy in solar energy reflected from cloud and snow fields. Griggs and Marggraf (1967) report on measurements of the directional reflectance characteristics of clouds, water, and snow as observed with a polarimeter mounted on an aircraft.
This chapter presents measurements made from an airplane with a radiometer originally designed for a meteorological satellite. Because of the radiometer construction and the lateral and vertical mobility of the airplane, the resulting reflectance measurements made under natural conditions cover a greater range of direc-tions over a reflecting surface than is possible with
many other instruments and means of conveyance. Results
are presented and discussed for seven different surfaces: stratus clouds, snow, white gypsum sand, a dry desert lake bed, a grassland-sod surface, dense vegetation, and water. These surfaces have widely varying characteristics and are, as a result, representative of many of the terrestrial
surfaces reflecting solar radiation. It was also possible
to find homogeneous and uniform areas of each surface that were large enouqh for measurements to be made from an
airplane. It will be seen that the reflectivity is achieved in a different manner for each surface and to a varying deqree in different regions of the solar spectrum.
1.2 Instrumentation
The platform used for these measurements was a Piper
Twin Comanche. This airplane commonly cruises at
approx;-mately 80 meters per second and is capable of flying at altitudes up to 9000 meters.
The radiometer used for these measurements was the
NIMBUS F-3 medium resolution radiometer (MRIR)l. Of the
five channels available on the radiometer, only results
from two of the channels will be discussed here. These
two channels measure energy in the 0.2 - 4.0~ and
0.55 - 0.85~ portions of the solar spectrum. The
0.2 - 4.0~ channel will be referred to as the broad
bandpass and the 0.55 - 0.85~ channel as the narrow
bandpass. The radiometer uses a rotating aluminum mirror
to scan across surfaces within the view area. The
instan-taneous field of view is 50 milliradians in cross-section. Energy striking the surface of the mirror is reflected into
the chopper and detector systems. The manner in which the
lAny information provided in this dissertation pertaining to the manufacture of instruments is for the reader's information only and does not constitute endorsement by the author or his institution.
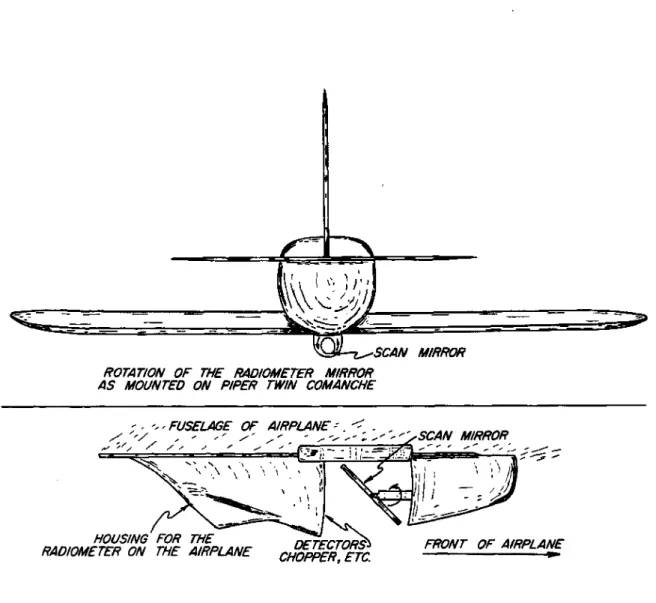
radiometer was mounted on the airplane and its direction
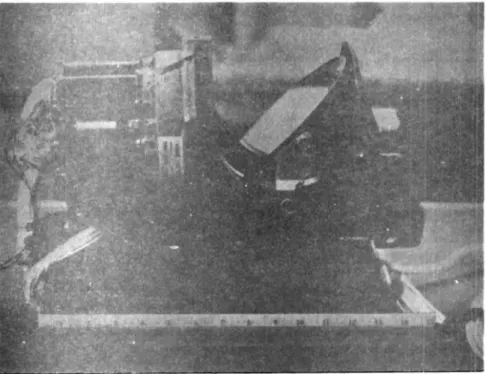
of scan are shown in Fig. 1.2.1. A closer view of the
radiometer is seen in Fig. 1.2.2. The time constant of
the radiometer is 0.02 seconds.
The radiometer was built and calibrated by the Santa
Barbara Research Center, Goleta, California. Several
calibration curves (reflectance versus voltage) were obtained for the periods corresponding to the
measure-ments discussed here. The method of calibration has been
discussed by Bartman (1966, 1967). The measurement errors
associated with a current calibration were ±2%. This
excludes the errors associated with the calibration of the albedo source used in the calibration of the MRIR.
For this study, the signals produced by the radio-meter were recorded on high speed strip chart recorders. The error in the recorded signal was 0.2% of a full scale
reading. The response time of the recorder was 0.2
seconds.
In order to measure the incoming solar energy, a Sol-a-meter (silicon solar cell) was mounted on the top of the Piper Twin Comanche over its center of gravity. The characteristics of the Sol-a-meter are described by
Selcuk and Yellott (1962) and by Dirmhirn (1967). The
Sol-a-meter was calibrated against an Eppley pyrhelio-meter before it was mounted on the aircraft and again
~SCAN MIRROR ROTATION OF THE RADIOMETER MIRROR
AS MOUNTED ON PIPER TWIN COMANCHE
FRONT OF AIRPLANE
...
Fig. 1.2.1. A sketch showing how the Nimbus MRIR was mounted on the Piper Twin Comanche.
Fig. 1.2.2 Nimbus F-3 medium resolution radiometer (MRIR).
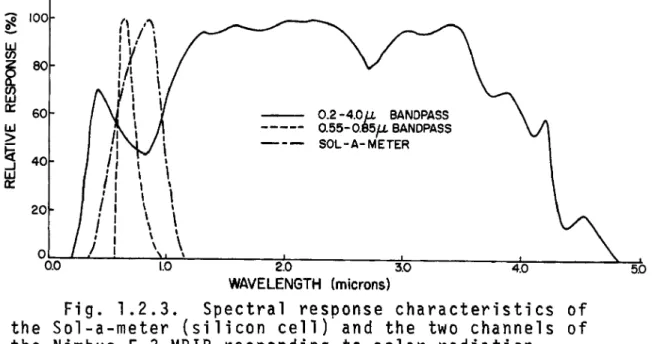
~ 100 !!.. ~
~
80 a:: 60 1LI > ij 40 ...J 1LI a:: 20,
,
,
,
\ \ \ \ \ 0.2 -4.0 j.J.. BANDPASS 0.55-0.85fL BANDPASS SOL-A-METER O~~~~ ____ ~~ ____________ ~ ______________ ~~ ____________ ~~ ________ ~~ 0.0 1.0 2.0 3.0 4.0 5.0 the the WAVELENGTH (microns)Fig. 1.2.3. Spectral response characteristics of Sol-a-meter (silicon cell) and the two channels of Nimbus F-3 MRIR responding to solar radiation.
also checked while it was on the airplane using a
specially constructed aircraft test stand. The
cali-bration was not observed to drift during the
measure-ment period reported here. The estimated error
associated with this instrument while mounted on
the airplane was ±5%. The spectral response curves
for the Sol-a-meter and the two MRIR channels are shown in Fig. 1.2.3.
1.3. Assumptions and Definitions
The radiation geometry employed in this analysis is shown in Fig. 1.3.1 along with the descriptive names applied
to the various angular measurements used. The principal
plane is described by AZBOA. The scattering plane is
des-cribed by BOCB.
In analyzing the measurements it was assumed that the surface being viewed by the radiometer was uniform in
topo-graphy and composition. It was further assumed that the
scattering or reflection was symmetrical with respect to
the principal plane. The actual observations showed that
these assumptions were best satisfied in the cases of the
dry desert lake bed and white gypsum sand. These
assump-tions were least approximated by the results describing reflection from a snow surface.
The calibration curves of the radiometer were based on the definition that the reflectance is the ratio of the radiance observed by the radiometer and the radiance the
RADIOMETER AZIMUTH
SUN AZIMUTH
SOLAR ZENITH ANGLE
RADIOMETER ZENITH ANGLE
Icp -(1800+cPoll = RELATIVE AZIMUTH SCATTERING ANGLE LOCAL ZENITH COS-I (Sin~oSineCOSt-coS~oCOSel INCIDENT BEAM
radiometer would observe if its field of view were completely filled by an ideally diffuse reflector of unit reflectivity illuminated by the solar constant
at normal incidence. This relationship can be
expressed as
rl = N(~ ,¢ ;8,¢)/N
o 0 0
1.3(1)
SOA is the solar spectral irradiance impinging upon the
earth at the mean distance between the sun and the earth.
~A is the spectral response of the instrument. NA is best
expressed as beinq eauivalent to
1.3(2)
where SA is the component of SOA normal to, and actually
impinging upon the reflecting surface. One can further
define another reflectance that applies for any solar
zenith angle ~o as
r
=
rl/cosr;, •It is also useful for checkin9 and comparison pur-poses to define an integrated directional reflectance r D that is equivalent to the albedo measured by a 2TI
pyranometer. This integrated directional reflectance
has the mathematical form:
r
(2
Ncose sine dedcpo 0
r
=
D 1.3(4)
N cos~ cose sine dedcp
o 0
Since N is an isotropic radiance, the expression above o
may be rewritten as
1.3(5)
The bar on the reflectance
r
is used to indicate that itis an average of readings taken by the radiometer at
various combinations of e and ¢.
1.4. Field Measurements and Analysis
Different values of radiometer zenith angle e were obtained through the rotation of the scanning mirror of
~he radiometer. Only radiometer zenith angles less than
from outside the target boundary. Different values of
relative azimuth
*
were obtained by changing the headingof the aircraft at predetermined increments relative to
the azimuth of the sun. For the first few flights the
relative azimuth was varied in 300 increments, thus
requiring a total flight time of forty to fifty minute~.
In later flights, the relative azimuth was varied by 4~o
increments. This latter procedure shortened the flight
time to less than thirty minutes and also reduced the variation of the solar zenith angle during each flight.
For each value of relative azimuth, the airplane was flown at a prescribed heading until the radiometer had
completed ten scans. Occasionally, it was necessary to
limit the number of scans to less than ten due to the limited areal extent of the surface.
Two factors were considered in choosing the flight
altitude over a surface. On one hand, it was important
that the reflecting surface fill the field of view for
8<75°. On the other hand, it was desired that the
radio-meter field of view integrate over as much of the surface
as possible. Over surfaces with limited areal extent the
second factor was compromised in favor of the first.
Flight altitudes of the aircraft above the surfaces varied from 120 meters over a snow surface to 1200 meters over
stratus clouds. This means that when 8=00 , the
jnstanta-neous field of view ranged roughly in diamete.,r frem "6 t{) 60 meters.
Once the signal from the radiometer was recorded on an analog strip chart, it was then necessary to obtain reflectance values rl corresponding to predetermined
increments of 6. Through the use of an overlay grid,
the appropriate values of reflectance were obtained from the analog voltage trace on a strip chart for every fifteen degrees of radiometer mirror rotation (radiometer zenith
angle). The position of the mirror was determined from
a pulse generated on the analog trace by a small light
installed in the radiometer housing at 6=1800. The
recorded voltages were converted by computer to
reflec-tance and the average t maximum, minimum t and standard
devia-tion values determined for each pass of the airplane over the reflecting surface.' The range in average values at
particular values of 6 and $ for successive passes over
the same area gives an indication of the relative uniformity
of the results that have been obtained. Representative
values of this param~ter will be given for each flight
discussed.
An analysis of errors involved revealed that the total
error in rl is ±3%. This figure includes the error
asso-ciated with the recorders (0.2%), radiometer (2%), obtaining
reflectance values from the recorder ~race (0.3%), and
reading the calibration curves (0.5%). Where large
varia-tions in the reflectance occurred rapidly, particularly
snondino to a narticular value of 'I.
The error in r is stron91v denendent on the error in the determination of the solar zenith angle. For an error of flo in anv individual estimate of c , the error , 0 ran q e s fro m 13 % a t c, = 0 0 t ol2 3 % a t s = 8 0 0 . 0 uri n 9 a
·0 0
fli0ht the solar zenith anqle varied from 1-100 denendina on the time reouired to complete the f1i~ht and the time of day. The ref1ectances were comouted using the solar zenith an91e anorooriate for each senarate pass of the airplane over the reflecting surface. The time reouired for each oass was aDproximate1y 1.5 minutes.
To obtain a value of integrated directional reflec-tance (r
n)
for each flight over a particular surface, it was necessary to use a finite differencinq rrocedure thatwould utilize reflectance measurements taken at fifteen degree increments in e and thirty or forty-five degree increments in ~ over the 2TI steradians above each surface.
As an examo1e, the finite differencinq procedure used for 45° increments in ~ will be qiven. Eq. 1.3(5) was broken into three inteqrations and then into summations in order to arrive at the final value of integrated directional reflectance. In the eouations below
o 0 0
ro
=
(iTcosr; )-1{ f 2 1T JiT/24
(r') cose sine ded1jJ
0
0 0
+ f2iT
f
1 1 iT / 2 II(r')
case sino dedw0 JiT/24
2iT iT/?
+
f
J (rr) cose sine ded1jJ }o IP/24 = (iTcosr; )-1 o 6 { (;r) _ f)-o 1.4(1) o 8 +
I
i=l 5=2
I
(r~.) lJ (coseJ.) (sine.) (iT/4) (iT/12) .18
+
I
(ril) cos(23iT/48) sin(23n/48) (n/4) (n/24)}. i=ll.5. Results of Field Measurements
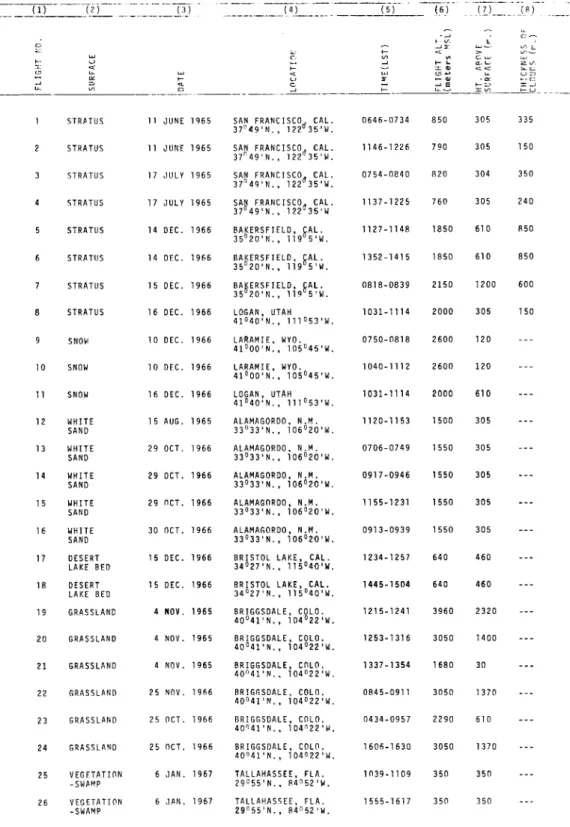
Table 1.5.1 lists the flights made over various reflect-ing surfaces. Four flights made over a water surface are not listed here because of special difficulties with the measurements. These difficulties will be discussed in
the next section. All flights were made under as clear a sky condition as possible. On a few occasions some
TABLE 1. 5.l. A SUMMARY OF FLIGHTS
DIFFERENT REFLECTING SURFACES . AND ASSOCIATED DITIONS MADE OVER
. _____ ._.(4L _____ _ _ _ _ ~_5_) _ _ (6) .. c· .--, , v, --' " I-~ ~ X~ to) ~:::~ ____________ 5 ___________ 1-_ _ _ _ ~,,=c _~e 10 11 12 13 14 15 16 17 18 19 20 21 22 23 24 25 26 STR~TUS STRATUS STRATUS STRATUS STRATUS STRATUS STRATUS STRATUS SNO,! SNOW SNOW WHITE SAND WHITE SAND WHITE SAND WHITE SAND WHITE SAND DESERT LAKE BED DESERT LAKE BED GRASSLAND GRASSLAND GRASSLAND GRASSLAND GRASSLAND GRASSLAND VEGETATION -SW~MP VEGETATl0N -SWAMP 11 ,JUNE 1965 11 JUNE 1965 17 ,JULY 1965 17 ,JULY 1965 14 DEC. 1966 14 DEC 1966 15 DEC_ 1966 16 DEC. 1966 10 DEC. 1966 10 DFC. 1966 16 DEC. 1966 15 AUG. 1965 29 OCT. 1966 29 OCT. 1966 29 nCL 1966 30 OCT. 1966 J5 DEC. 1966 15 DEC. 1966 NOV. 1965 4 NOV. 1965 4 NOV. 1965 25 NOV. 1966 25 OCT. 1966 25 OCT. 1966 JAN. 1967 6 ,JAN. 1967
w
~~~~N:I
~~~d 3~~~: ~~~ 4~~~~:I
m'13~~~: ~~~ 4~~~~:I
m~ 3~~~: j~~ 4~~~~: Im~ 3;~~' ~~~~~~~ ~ :L~ i 9&~~ W. ;~~g~~~ :L~ i 9&~\i.BA~ERSF I ELD, ~AL.
35 20'N_, 11~ 5'W. LOGAN, UTAH 41 040'N., 11lo53'W. LARAMIE, WYO. 41000'N., 105045'W_ LARAMIE, WYO. 41000'N., 105 045'W. LOGAN, UTMI 41040'N., 111 053'W. ALAMAGORDO, N.M. 33033'N., ID6020'W. ALAMAGORDO, N. M. 33 033'N., 106020'W. ALAMAGORDO, N.M. 33 033'N., 106 020'W ALAMAGORDO, N.M. 33 033'N-. 106020'W. A LAMAGOR 00, N. M . 33 033'N., 106 020'W. BRISTOL LAKE, CAL. 34 027'N., 115 040'W. BR I STOL LAKE, CAL. 34027'N., 115040'W BRIGGSDALE, COLO. 40041'N., 104 022'W. BRIGGSDALE, COLO. 40041'N., 104022'W. BRIGGSDALE, COLO. 40041'N_, 104022'W. BRIGGSDALE, COLO. 40041'N., ID4 022'W. BRIGGSDALE, COLO. 40'41'N-. 104'22'W. BRIGGSOALE, COLO. 40041'N., 104022'W. TALLAHASSEE, FLA. 29055'N .. R4052'W. TALLAHASSEE, FLA. 29'S5'N., 84°52 'W. 0646-0734 1146-1?26 0754-0840 1137-1225 1127-1148 1352-1415 OBI B-0839 1031-1114 0750-0818 1040-1112 1031-1114 1120-1153 0706-0749 0917-0946 1155-1231 0913-0939 1234-1257 1445-1504 1215-1241 1253-1316 1337-1354 0845-0911 0434-0957 1606-1630 1039-1109 1555-1617 850 790 820 760 1850 1850 2150 2000 2600 2600 2000 1500 1550 1550 1550 1550 640 640 3960 3050 1680 3050 2290 3050 350 350 305 335 305 150 304 350 305 240 610 850 610 850 1200 600 305 150 120 120 610 305 305 305 305 305 460 460 2320 1400 30 1370 610 1370 350 350
CON-thin cirrus was rresent, but only on fliqhts 6 and 16 was a thin veil of cirrus observed that obscured the sun.
Columns 5-7 of Table 1.5.1 give the altitude (above mean sea level) of the aircraft, the height of the air-craft above the reflectin9 surface, and the thickness of the cloud layer. For all the surfaces except stratus clouds the height of the reflecting surface was deter-mined from topoqraphic maps. The altitude of the cloud tops was usually determined by the aircraft altimeter. The thickness of the clouds was commonly determined by
knowing the height of the top of the clouds and the height of the bases as reported by nearby weather sta-tions. In the case of stratus clouds over water (11 June and 17 July 1965), one penetration of the cloud layer was made by the aircraft during each flight and the height of the top and bottom of the layer determined from the air-craft altimeter. This was not done for stratus cloud~ over land due to the low altitudes involved.
The first four flights over stratus clouds were made directly west of San Francisco from 10-30 miles offshore. Three flights were made southwest of
Bakersfield, California, over stratus clouds lying in the San Joaquin Valley. The estimated thickness of the stratus clouds is given in Column 8 of
Table 1.5.1. The variation in flight altitude above the reflecting surface shown in Column 7 for flights 5 and 6 versus 7 was due to a change in the topoqranhy
of the surface of the clouds during the intervenin~ time
period. In the intervening time the clouds were under
the influence of moderate winds for several hours. This
windy condition served to dissipate some of the cloud layer and rouqhened the surface into a "frothy, whipped
cream" aopearance. The flight altitude was subsequently
raised to allow the radiometer to integrate over as much of the surface as possible and reduce the effect that the roughened cloud surface would have on the recorded reflec-tance measurements.
Flights 8 and 11 were made in the Cache Valley in
northern Utah. They were made under identical atmospheric
conditions over locations separated by only a few miles.
Th~ northern end of the valley and the town of Logan, Utah,
were covered by a layer of stratus clouds approximately 150 meters thick underlain by snow that had been deposited
two days before. These flights provided an unusual
oppor-tunity for comparative measurements of snow and clouds. The flights near Laramie, Wyoming, were made over snow
deposited one day prior to the observations. The
homo-geneous area of snow was somewhat small; therefore, a low flight altitude of 120 meters above the surface was chosen.
All the flights over white sand were made over the area included in the White Sands Missile Range west of
Alamogordo, New Mexico. The majority of flights were
made on the west side of the area covered by the white
uniform terrain in this section of the range. The dunes to the south and east of this area were aoproximately 7 to 10 meters high and oriented northwest-southeast ner-pendicular to the prevailing winds from the southwest.
Bristol Dry Lake is located northeast of Twenty-nire
Palms, California, approximately 20-25 miles. The lake
bed is aDproximately ten miles long and five miles wide
oriented northwest-southeast. A salt-mining ooeration is
located on the northern half of the lake. The measurements
reported here were taken on the southern end of this lake
bed. The height of the airplane above the surface was
selected as 460 meters because at this height turbulence which affected the aircraft was not so objectionable as at lower altitudes and the altitude criteria mentioned earlier could still be satisfied.
The grassland-sod surface was located on the Pawnee
National Grassland in northeastern Colorado. This surface
was comprised of short native grama and buffalo grasses that were sparse enough that small areas of bare soil were
still visible. Because of this condition, the
measure-ments were an inte~rated result comprised of the vegetation
and soil surfaces. The altitudes of the flights were varied
so as to ascertain whether some variation in reflectance
was attributable to a change in flight altitude. This
point will be discussed in the next section.
The swampy, dense vegetation surface was located
Although the area was very swamny, the reflecting surface was completely composed of vepetation. These results are subsequently representative of those to be expected from vegetation as opposed to the dry desert lake bed which was devoid of any vegetation.
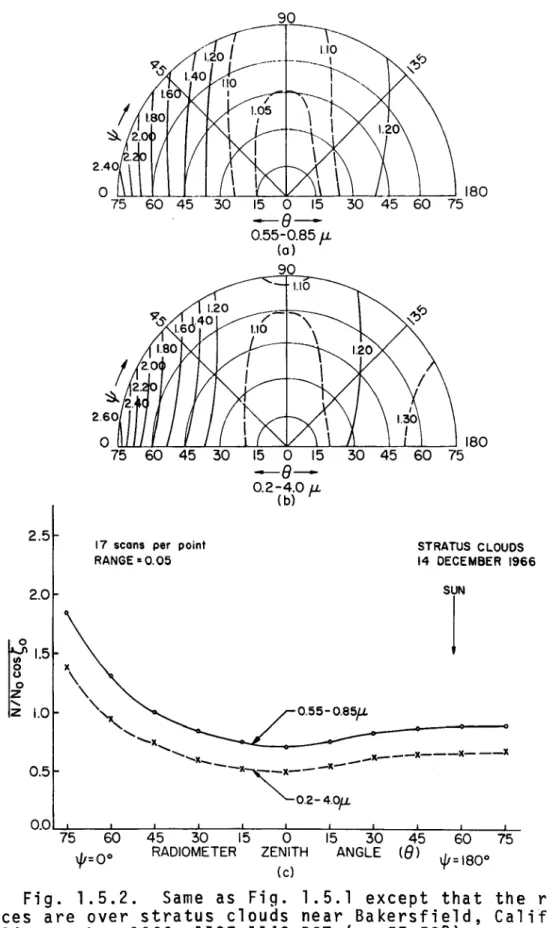
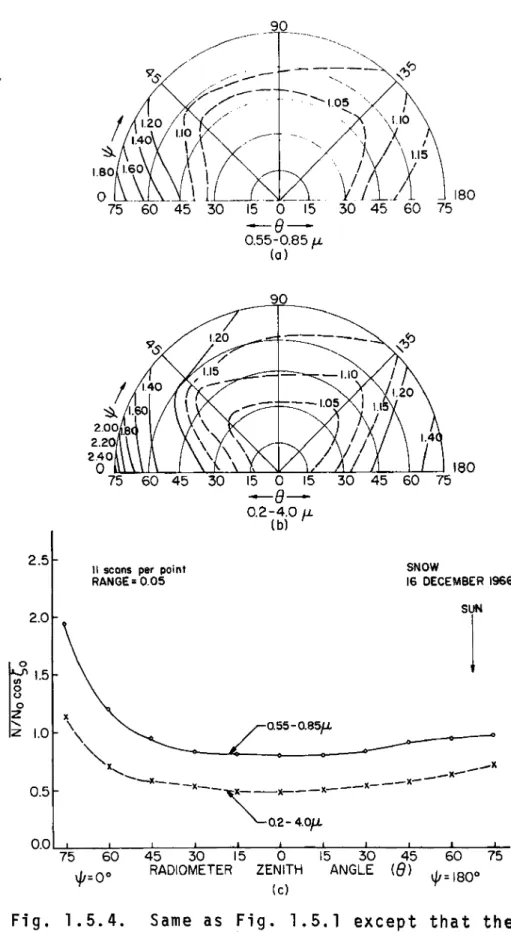
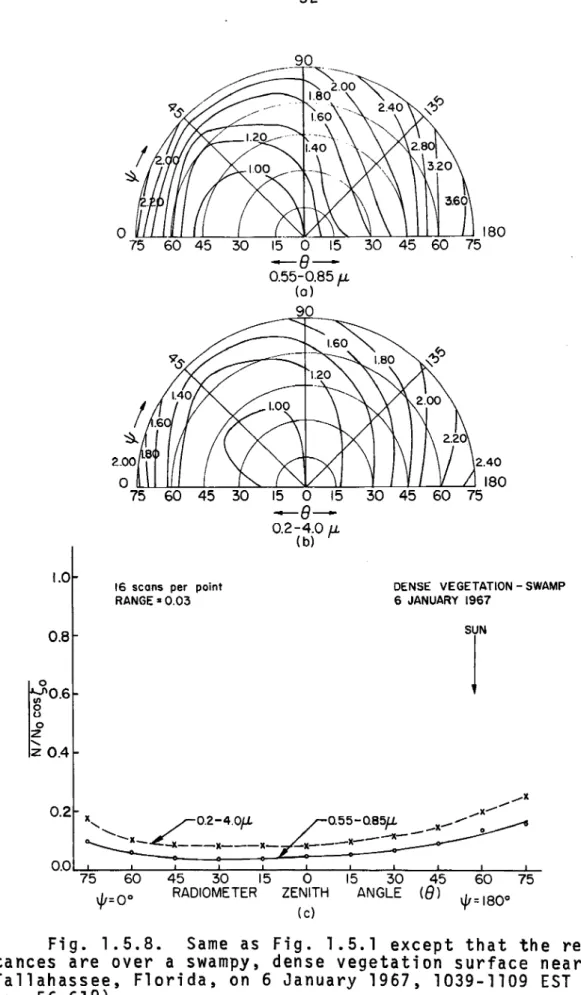
Figs. 1.5.1-3 show reflectance distributions observed over stratus clouds at three different locations under
differing conditions of illumination and underlying surface. Fig. 1.5.4-8 show representative results for the remain-in9 surfaces when the solar zenith angle was near 600• These last figures were chosen in this way so as to establish a clearer basis for comparison. Similar figures are in the appendix for all the flights in
Table 1.5.1 that are not shown in this chapter. Parts (a) and (b) of each of the figures mentioned above show the ratio of the reflectance r at prescribed intervals of
8 and ~ to the reflectance observed at 8=00 designated as
(r)o. Part (c) of each figure shows the variation of
r
for 6<750 in the principal plane. The number of read-ings comprising each plotted pOint, other than 8=00, is given also in part (c). The range given is the difference in the average values of reflectance obtained from suc-cessive passes over the reflecting surface.In Table 1.5.2 data and results are listed which serve to summarize some of the important points to be discussed in the next section. Column 4 gives the incoming solar energy as measured by the Sol-a-meter
2.5
2.0
~L5
I!
1.00.5
20 scans per point
RANGE = 0.04 8 -0.2-4.0 fJ-(b) STRATUS CLOUDS 17 JULY 1965
T
O.O~~~~~~~~ __ ~ __ ~ __ ~~~~ __ ~ __ ~ __ ~ 75 60 45 30 15 0 15 30 45 60 751/1=00 RADIOMETER ZENITH ANGLE (8) 1/1= 1800
(c)
Fiq. 1.5.1. Ref1ectances over stratus clouds near San
Francisco, California, on 17 July 1965, 0754-0840 PST (~
=45-54°), showing the hemispheric variation of ~/(~)o ve~sus
relative azimuth ~ and radiometer zenith angle B for the
wavelength intervals 0.55-0.85p(a), and for O.2-4.0p(b).
2.5 2.0
~1.5
I~
1.0 0.5 x \ \.17 scans per pOint
RANGE =0.05
""-,
90 1.10 STRATUS CLOUDS 14 DECEMBER 1966T
-x, ... x"""'- ___ x_--x---x- _-x --x~---O.2-4.0fL 0.0 '-='=:---;f:;:---7::----::'::-~:':=_-_=_-7=_-_="='-_:'::_-_!_::__~-75 60 45 30 15 0 15 30 45 60 750/=00 RADIOMETER ZENITH ANGLE (8) 1/1= 1800 (e)
Fig. 1.5.2. Same as Fig. 1.5.1 except that
tances are over stratus clouds near Bakersfield,
on 14 December 1966, 1127-1148 PST (~ =57-580 ).
o
the reflec-California,
8 -0.55-0.85 I-'-(0) 8 -0.2-4.0 I-'-(b) 2.5
i3 scans per point RANGE= 0.04 STRATUS CLOUDS 16 DECEMBER 1966 l( 2.0 \
~
15I!
1.0 0.5 \ \ \ \ \ \ \x"
"-T
0.55-0.851-'-'-.j( I~, , _x ......
, ..-x-""--~x--- --~--x---X---)(--- 02-401-'-0.0 L...::c1:::--~t"-~-::----=~-:'=----=---:-'=---='"=----L----L..---L-75 6 45 30 15 0 15 30 45 60 75
\f;=00 RADIOMETER ZENITH ANGLE (8) \f;= 1800
( c)
Fig. 1.5.3. Same as Fig. 1.5.1 exceot that
tances are over stratus clouds near Loqan~ Utah, December 1966, 1031-1114 MST (~ =66-700 ).
o
the reflec-on 16
2.5 2.0
~'5
I~
1.0 0.5 xII scans per point RANGE" 0.05 90
--
'-,--1.05 " " , I , \ LlO ", ' /"'~' /\~.I~
I \/ j ./ 30 45 60 180 75 SNOW 16 DECEMBER 1966T
\ , 055 -O.85fL""
~ -~-
----x--~X---X---X---)(- ---0.2- 4.0fL 0.0 L...L_---J'--_-'---_-:::'-::-_---=_~-___:_':=____:~-_:'=_-~:___=_.::_ 75 60 45 30 15 0 15 30 45 60 751/1=00 RADIOMETER ZENITH ANGLE (8) 1/1= 1800
(c)
Fig. 1.5.4. Same as Fig. 1.5.1 except that the ref1ec-tances are over snow near Logan, Utah, on 16 December 1966, 1031-1114 MST (~ o =66-70°).
2.5
2.0
~1.5
I~
1.0-20 scans per point
RANGE=0.03 90
.--
---. WHITE SAND 29 OCTOBER 1966 SUN1
__~~
______.~~~
__O-.5-5-_0-.85-~----~--~
x---x-_ ._-x--_·
0.5 - X ... --X-~--X---X--I(-O.2-4.0fL 0.0 L...I.--l.,..----..,~-~--:'::--~---::=---=,,=' --:,::' =--='-::----::=-' 75 60 45 30 15 0 15 30 45 60 75RADIOMETER ZE.NITH ANGLE (8)
IJ!=O° IJ!= 1800
(c)
Fig. 1.5.5. Same as Fig. 1.5.1 except that the reflec-tances are over white gyp;um sand near Alamogordo, New
Mexico, on 29 October 1966, 0917-0946 MST (s =57-61°).
1.0
0.8
0.2
20 scans per point
RANGE =0_03 8 -0.55-0.85 fL (0 ) 8 -0.2-4.0 fL (b)
DRY DESERT LAKE BED 15 DECEMBER 1966
i
0.0
,-:,:::---~=----:=---::~---::,=---=---:,=----:!-:---:,::---::,-::,--.J..:-75 60 45 30 15 0 15 30 45 60 75 ~=00 RADIOMETER ZENITH ANGLE (8) ~= 1800
(c)
Fig. 1.5.6. Same as Fig. 1.5.1 except that the reflec-tances are over Bristol Lake, northeast of Twenty-nine Palms,
California, on 15 December 1966, 1234-1257 PST (~ =58-590 ).
1.0
O.S
20 scans per point
RANGE =0.02 8 -0.55-0.85 f1-(o ) 8 -0.2-4.0 fL (b) GRASS LAND 4 NOVEMBER 1965
T
~L
O.2- 4'0f1- .--:,.,; &]
,~-=--
:---:-
-~-::';~.~;:--,~
, , ,
75 60 45 30 15 0 15 30 45 60 751/1=00 RADIOMETER ZENITH ANGLE (8) 1/1= 1800
(e)
Fig. 1.5.7. Same as Fig. 1.S.1 except that the
reflec-tances are over a grassland-sod surface near Briggsdale,
Colorado, on 4 November 1965t 121S-1241 MST (~ =S9-630 ).
1.0 0.8
~O.6
I~
0.4 90 2.40 _~~~~~~~~~~~~~~~~~ 180 7516 scans per point RANGE =0.03
8 -0.2-4.0 fL
(b)
DENSE VEGETATION - SWAMP 6 JANUARY 1967
r
... 11 Q2 ~--II,... /0.2-4.0fL kO.55-0.S5fL _ _ ... 11-....- o~ ~ - I I L.__ _ - - ____ - - - . . - - I ' . - - - X - - - I I - 1 1 -= a 0.0 '-::':::---==::---::::----=-.=---:':=--~:__~~~'::_____='::___::~__::=_ 75 60 45 30 15 0 15 30 45 60 750/=00
RADIOMETER ZENITH ANGLE (8)"'=
1800
( c)
Fig. 1.5.8. Same as Fig. 1.5.1 except that the reflec-tances are over a swampy, dense vegetation surface near Tallahassee, Florida, on 6 January 1967, 1039-1109 EST
(7; =56-61°).
at the top of the airplane. These values of incoming energy were used to correct the integrated directional reflectance values measured in the broad bandpass (Column
7) for the effect of atmospheric attenuation. This
cor-rection is necessary in that the broad bandpass reflectances are derived from a comparison to values resulting when the energy in the incident beam is equivalent to the solar
con-stant. Furthermore, the values are affected by the
dif-ferences in the attenuating air mass at different locations. The correction can mathematically be expressed as
1.5(1)
The results are given in Column 9. S· is the total
incom-ing energy measured by the Sol-a-meter and S is the normal
component of the solar constant. For solar zenith angles
o
exceeding 70 , the Sol-a-meter measurements are not reliable
and are not presented. Other missing data in Columns 7 and
9 resulted from the Sol-a-meter being inoperative. Columns 6 and 8 give the ratio of the integrated directional reflectance to the average value of
reflec-tance observed at e=oo. These results give an idea of the
error that one could make in an estimate of albedo utilizing only one reading of reflectance of the MRIR at one radio-meter zenith angle (e=oo) and ignoring the anisotropy in
as the relative anisotropy. Values of rD/(r)o are given
for both the broad and narrow bandpasses. (r)o represents
an average of as many as 130 values per flight.
Column 10 (Column 5 minus Column 7) illustrates the combined effect of atmospheric attenuation and the spec-tral characteristics of surface reflectivity, incoming energy, and bandpass filters on the integrated directional reflectances measured by the narrow and broad bandpasses.
1.6. Discussion of the Results
Several features in Figs. 1.5.1-3 showing the observed
scattering from stratus clouds are of importance. The
most obvious features are the strong forward scattering
and the lesser backscattering. As the solar zenith angle
increases in Figs. 1.5J-3 one can see increased reflectances
in the forward direction. This result occurs because more
and more of the forward scattering peak suggested by scat-tering theory (to be outlined in Chapter II) can be observed. The minimum reflectance occurs when the radiometer zenith
angle is near zero degrees. The degree of forward and
back-scattering is not as large as that predicted by theoretical rC3ults involving single scattering such as those given by
D~irmendjian (1964). Differences are certainly to be
e~occted, however, since the experimental results represent iri~!grated effects over a range of wavelengths accompanied
by multiple scattering, varying drop size distribution, an
gives some discussion of the relative importance of these
factors. Further discussion of these matters will be
pre-sented in Chapter III as the processes resulting in the observed reflectance distributions are examined in more
detail. In particular, it will be shown that when multiple
scattering is included, computed results agree rather well with the observed reflectances.
The reflection from the other highly reflective surfaces (snow and white gypsum sand) was not observed
to be as anisotropic as that from stratus clouds. In
Fig. 1.5.4 it can be seen that at a solar zenith angle between 66 and 70 degrees, the reflection from snow has a quasi-specular peak in the forward direction while the reflection in other directions tends to be isotropic.
The peak in the forward direction is termed "quasi-specular" because it occurs at an angle exceeding the angle of
inci-dence. This forward peak disappears rapidly as the solar
zenith angle becomes smaller. These results are in general
agreement with those of Middleton and Mungall (1952) and Griggs and Marggraf (1967).
The reclection from white sand was the most isotropic
of any observed. There was a slight increase in reflection
rack toward the sun (Fig. 1.5.5). Only when the sun was very near the horizon was any specular component observed. These results agree in substance with those published by Chen, et al. (1967) where the reflectance characteristics
difference exists, however, in that the maximum in reflectance back toward the sun in the principal plane
does not occur at e=~ as it appears to do in Chen's
o
results. No definite explanation for this difference
can be offered at this time; however, it is felt that the difference lies in the contrasting environmental conditions surrounding the two sets of measurements.
The existence of a combined beam and diffuse illumination condition in the situation surrounding the measurements reported here and the illumination by a beam of light only in the laboratory case should be part of the explanation. Also the portion of the incoming solar radiation reflected
by the atmosphere itself must be considered since this component has an increased influence as one scans toward
the horizons (Coulson, et al., 1966). Several checks were
made of the data presented here to see whether a mistake in the positioning of the reflectance curves might have been made, but no such mistake was found.
In Figs. 1.5.6-8 one can observe the changes in reflectance observed for surface conditions which go from a surface without any vegetation to a surface
com-pletely covered by vegetation. In all cases the
pre-dominant feature is increased reflection back toward the
sun. The minimum for all surfaces occurs in the principal
plane in the ~=Oo direction gOing from a radiometer zenith
angle near 750 in the case of a dry desert lake bed to an
This occurrence can be described qualitatively as a shadow effect that appears to be related to the size of the elements creating the reflection.
The results over the dry desert lake bed are
particularly noteworthy in that the reflection back toward the sun was very noticeable even when observed with the naked eye or in photographs taken at various angles with
respect to the sun. Although there is some resemblance,
these results should not be construed as typical of a desert
condition. It is felt that the degree of reflection back
toward the sun in this case is more than that to be expected
over desert sand. A desert sand reflectance distribution
would be more likely to have a minimum in reflectance nearer e=Oo and a less pronounced increase in reflectance back toward the sun.
In Table 1.5.2 the results gi~en in Column 9 will be
discussed first. As pointed out earlier in the chapter,
the spectral response of the Sol-a-meter lies in a narrow
band from 0.3-l.l5~. The Sol-a-meters are commonly
cali-brated against an Eppley pyrheliometer which has broader
(O.2-3.0~) and flatter response characteristics (MacDonald,
1951). This procedure, under static atmospheric conditions,
enables one to get accurate measurements of the total
incom-ing solar energy from the Sol-a-meter. It is clear, however,
~hat this calibration will change as the interveninq air ~ass channes since the Sol-a-meter does not respond to the 1Q~rer wave1enqths of solar radiation (1-3~) where, for