1fll1
~~ ~
ANALYSIS OF A DATA COLLECTION AND PROCESSING SYSTEMQ_f)2
-1~ '8[, -~ S>
FOR BEAVER CREEK WATERSHED, ARIZONACOPY
2
Prepared for USDA Forest Service
Rocky Mountain Forest and Range Experiment Station Flagstaff, Arizona
Cooperative Agreement 16-762-CA
Civil Engineering Department Engineering Research Center Colorado State University Fort Collins, Colorado
Prepared by December 1981 D. B. Simons R. M. Li T. J. Ward CER79-80DBS-RML~TJW68
ANALYSIS OF DATA COLLECTION AND
PROCESSING SYSTEM FOR BEAVER CREEK WATERSHED, ARIZONA
Prepared for USDA Forest Service
Rocky Mountain Forest and Range Experiment Station
Flagstaff, Arizona
Civil Engineering Department Engineering Research Center Colorado State University Fort Collins, Colorado
Prepared by December 1981 D. B. Simons
R. M.
Li T. J. Ward UlllfDl 0075511.ACKNOWLEDGMENTS
The authors wish to thank the staff of the Rocky Mountain Forest and Range Experiment Station in Flagstaff and Tempe for their time and effort in furnishing information pertaining to the data collection and analysis system. Without their consultations and interest this study could not be conducted.
ANALYSIS OF DATA COLLECTION AND
PROCESSING SYSTEM FOR BEAVER CREEK WATERSHED, ARIZONA
INTRODUCTION
Accurate, quantitative analysis of ecosystems is dependent on the quality of data used to describe the environment. Data quality is a
major concern for the Multi-resource Management Planning Research Project, referred to as the Beaver Creek Project, administered by the Rocky
Mountain Forest and Range Experiment Station, United States Department of Agriculture Forest Service, Flagstaff, Arizona. The goals of the Beaver Creek Project are centered on development and testing of method-ologies for management decision making in forested watersheds. In order to meet these goals, large amounts of data from climatic, biologic, hydrologic, geologic and hydraulic measurements must be obtained. The eventual success of the Beaver Creek Project in providing accurate analysis methods is dependent on the realiabiity and validity of the measured data.
This report outlines the current data collection and analysis system used in the Beaver Creek Project. Analysis is limited to climatic input, water, sediment and water quality data collection. In addition, this report presents a review of the adequacy and quality of the available data base. Recommendations for long and short term data needs, and modifications
2
METHODS OF DATA COLLECTION AND ANALYSIS
Central to the review of the present data base and data collection and analysis system was the consultation and discussion with key project
personnel, from field technicians to the principal investigators. Through these consultations and discussions, data tabulations, maps, drawings and first hand experiences were gathered. This information was studied with respect to characteristics needed for evaluating the usefulness of the data. Determinations were made with respect to the necessity of collecting specific data, the throughness of the data and whether or not the data was accurate and representative of the system being studied. Consultations and discussions also provided insights into the desirable and undesirable aspects of the current data organization. All of the available information was incorporated into the analysis which is discussed in Section III.
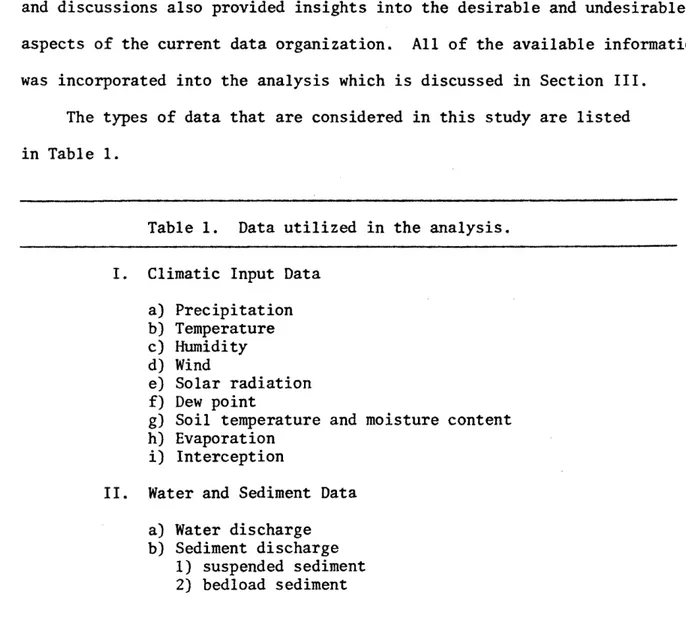
The types of data that are considered in this study are listed in Table 1.
Table 1. Data utilized in the analysis.
I. Climatic Input Data a) Precipitation b) Temperature c) Humidity d) Wind e) Solar radiation f) Dew point
g) Soil temperature and moisture content h) Evaporation
i) Interception
II. Water and Sediment Data a) Water discharge b) Sediment discharge
I) suspended sediment 2) bedload sediment
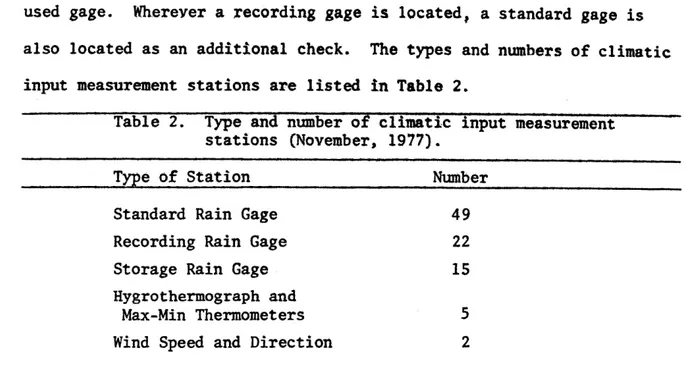
used gage. Wherever a recording gage is located, a standard gage is also located as an additional check. The types and numbers of climatic input measurement stations are listed in Table 2.
Table 2. Type
and
number of climatic input measurement stations (November~ 1977).Type
of
Station Standard Rain Gage Recording Rain Gage Storage Rain Gage Hygrothermograph andMax-Min Thermometers Wind Speed and Direction
Nwnber 49 22 15 5 2
If returned to full service, the Schnebly Bill Highway Camp loaction (Woods Weather Station) would provide.information on soil temperatures, wind speed and direction, dew point, precipitation and temperature. Solar input will be measured on the campus of Northern Arizona University in Flagstaff.
PRECIPITATION DATA COLLECTION
As Table 2 indicates, the predominant climatic input measurement is for precipitation. Three types of precipitation gages were used including standard can, recording and storage gages. As previously mentioned, each recording gage is paired with a standard can. Weighing
recording rain gages and standard cans are checked and serviced approximately every three to four weeks depending on accessibility and amount of preci-pitation occurring since the last service. Standard gages are also checked on the same schedule while storage gages are checked twice a year, once
4
Table 1. Data utilized in the analysis (continued).
3) organic debris
4) aggradation and degradation 5) soil erosion
III.
Water Quality Dataa) Precipitation input b) Surface water samples
Data related to timber and wildlife are not considered.
Generally, data collected for climatic input, water, sediment and water quality is necessary, adequate and of high quality. Each of these
four data groups is described below. It must be recognized, however, that each group is interrelated so some repetition of data in more than one group is inevitable.
CLIMAIIC INPUT
Climatic input that must be considered when investigating environ-mental conditions includes air temperature, humidity, solar radiation, evaporation, wind speed and direction. precipitation, dew point, inter-ception, and soil temperature and moisture content. Soil temperature and moisture content are included under climatic input since they are often recorded at cl±matologic stations. As of February 1978 there were 59 stations where measurements of climatologic input were being taken. Twenty four stations were placed in or near Woods Canyon and Bar M Watersheds.
The most common type of recording device at these stations is a standard can rain gage. A recording rain gage is the next most commonly
5
at the end of the winter precipitation period (about May 1), and once at the end of the summer precipitation period (about October 1). A field data recording form for a standard rain gage is shown in Figure 1.
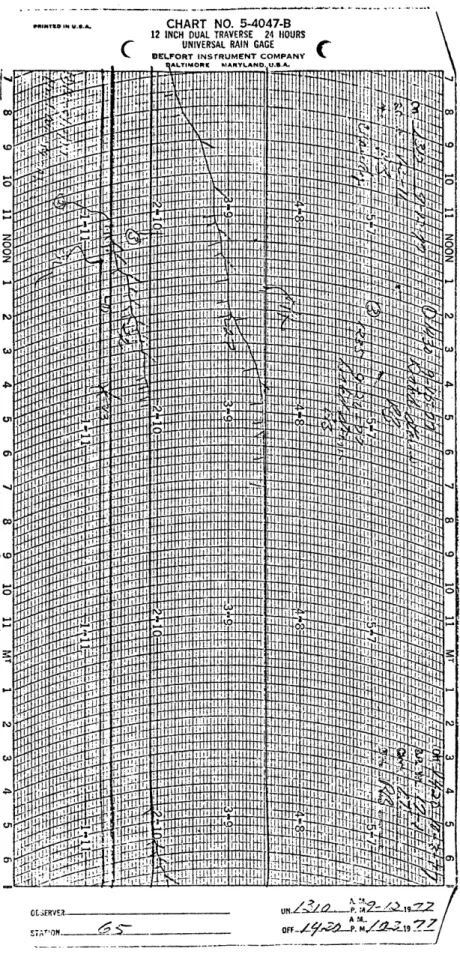
Recording rain gages reqUire more service due to the complexity of the data collection. These gages include a battery powered clock which drives a 24 hour recording chart as shown in Figure 2. These charts indicate the beginning and end of a precipitation event and the accumu-lated precipitation. At the time of data collection, the chart is inspected for timing errors and the accumulated volume is adjusted to the nearby standard gage. The strip charts or analog charts are final in final form in the office after each run. The flow chart in Figure 3 show the sequence for rainfall data collection and processing. Every other month the recording gage strip charts are digitized using a
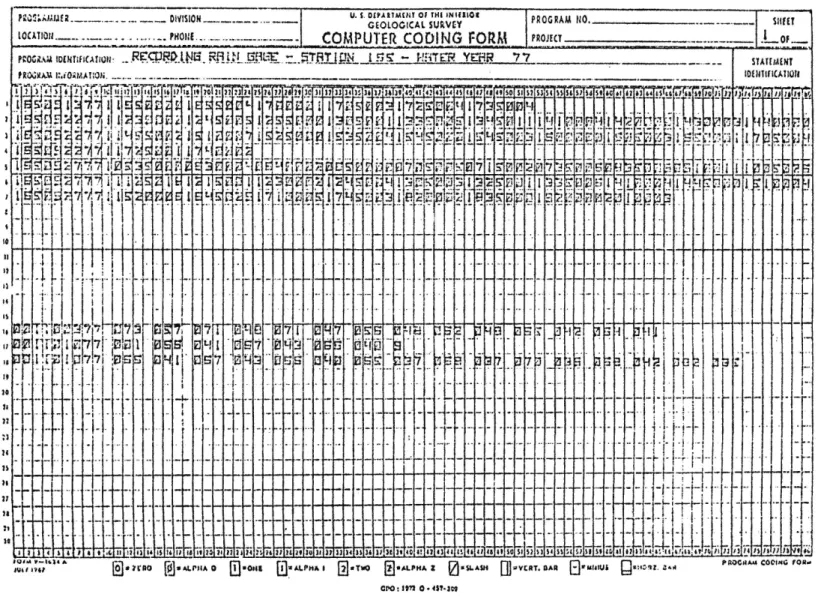
Hewlett-Packard HP9820A calculator with peripherals of a Hewlett-Packard 9864A digitizer and HP9862A plotter. The digitized data is taken at break points on the accumulant curve as seen in Figure 2 and plotted onto coding forms as shown in Figure 4. These coding forms are key-punched and the data added to the data base.
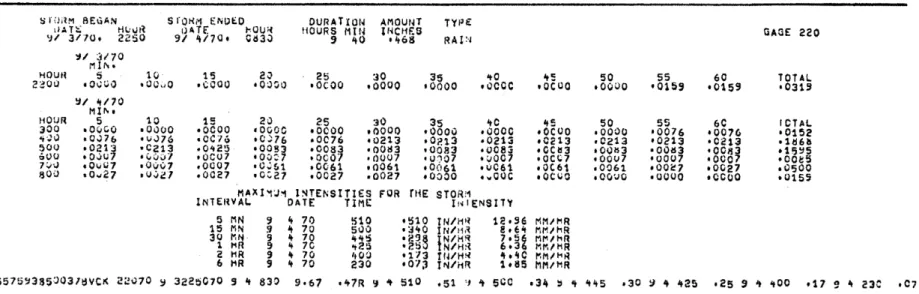
In May and June a semi-annual data edit and report is prepared using existing data manipulation programs. At this time, standard can amounts are reported and used to prorate the recording gage volumes. Discrepencies between gages and missing data is also checked. Each individual storm is analyzed and presented in time-accumulation form on five minute intervals with maximum intensitites for five, fifteen and thirty minutes and one, two and six hours as shown in Figure 5. Every October and November, a final annual edit of all precipitation data for the previous water year is conducted and the annual report is
Gage
No Date
6
FIELD RECORD OF STANDARD GAGE PRECIPITATION
eiqht \~eight
Tim • oz. lb. oz.
Charge \~eight
lb. oz.
Observer: Snow
Precip. Depth Gage Weather
I
.
Jeviou;-r Current( 1) t==::==i=:=.:=:::::.:::==J::==:: , . - I t
-{2) ~--~---+-- ~,---+---~~--~--~~·--~----+---~---~----~·
Type {Inches) Info. Conditions :;::.:::=:t===:::;::===--:::;-=.==~-=----==
=--=====:::::-::.=
(3) ~----~----+---· il
(4} ~----~---+---4---+-~---~'---r--~'~~----~----~---+---r---l (5) ~---~---~---~--+---~--r-'--r---~'--+---~----~----~----~---1 (6) ~--~---~---4---+ 1 ---r---r-1 --~--~1 --+---~----~---~----~---i (l)r----r---r---~~--~~~---~--~~--;---~----+---+---+---1 (8) ~--~---+---~--~--+---~'--~---~'~--~----~---+---+---+---1 (16~ l---~---~---r--~--~--~:---+--~:---+----~~----+---+---~---1 (11) r---+---·~·---~--·--~--~--~'---r---~'--~----~----~--~---+---~ (12) ~---r---+----~----ll---+--_.1 __ -+--~l---+---4---~----+---r---l (lJ)r---~---~----~---+-~--_.l __ -+---r-'~----~----~r---~----~---1 (14) r---+---+---~--T--4~--~---+--~'---+---+---4----~---+---l (15)t:::::::=====--:=====-::~:-.::::::========='::::::===1========::::::============:::=::.::=::.::=__.
Footnote~_{ j_-·~ .. ·--.. ----·~--·---~---LEGEND:---.-·-··----·-·---·---Precip. Type: N
=
None R = Rain S=
Snow M = Mixed Gage Info:Foot Notes:
0
=
Oil B=
Both Oil and Antifreeze L=
Leak F = Foreign ObjectExplain any discrepancy. Example: If previous weight is greater than current weight.
Figure 1. Recording form for standard rain gage precipitation measurements.
7
·-·---·-·---· _
... ---4--·-···--...
~-... ·-·--··
PWUUkOINU .•. &,.
(
CHART NO. 5-4047-B
12 INCH DUAL TRAVERSE 24 !lOURS UNIVERSAL RAIN GAGE r
BEL.FORT INSfRUMENT COMPANY '-.
,---·---·---~----~U.~S.~D(~P!~I~lM~U71T~OI~J~HI~IN~I~fl~l0~1---r----..---·~:l----~
P~~~~i.W.I£il. ____________ - - -DI'I'ISION ________ .. ___ GEOLOCICAL SUIWn PROGRAM 110. _______________ l SIIHT lOO.TIQII ____ • --- -· ... -· PHOJ:E .... -~· ·::-···.:.·· ·::···:.:· :.::-·::;···.:;.;·· =:.:·:.1-..;C:!;O:!.J.;~~ P~U:!.l!..!'E:!!R~C~O~D~I f~-4 G~F:!:O~R.::.!J..!l' -l.~PR~OJE~CT:.=======·-.:.;--;,;;;·--~· =..L.;·~O~f ·;;;· =~
~---w--~~~~~~
tUliA ·-l•l• 1>
""'
..
,.,
@)•:ruo @)•4LrHAO (!]•on& [i]~.-.LPHAI [?]•TWO [!}•~LPHAI lZ)•SLASH DJ .. vuT.llAA t]"'MI••U' Qc:t:·U.I!411cro: lt12 o. •Sf·JC9
S fililM AE\1AN SfOHM ENOt:O DURATION AMOUNT TYPf
IIATl:;; t-lvvtl !)ATE 1'<0\J~ t10URS MIN INCt1F.S GAGE 2ZO
')I 3/70• 2250 91 lt/10 • Cl:i3J 9 ItO •lt68 RA I!·l
'II ~1170
Mll'u
HOUI~ 5 10 15 2J 25 30 35 ItO 't~ 50 55 60 TOTAl
2~0u •O..:UO •Oi.h,O t\;000 •O:JOI) •0<:00 •0000 •0000 •uCCC •OCIJO tOOUO •015, •0159 •03U
'J/ 1!170
Hlflt•
HOtJR 5 10 15 20 25 30 35 ltC 'IS 50 55 6C ICTAL
;300 •OvCO •OuOO •OCOO •OCiOO •OCOO •0000 •OOOu •0000 •QCOO •0000 •0076 •OO?~ •0152
-.·Jv •OJ76 •VJ76 •OC76 •0;;76 oOC76 •0213 •0?.13 •0213 •0213 ·021.3 •0213 •0213 •1t16&
500 •021, •C213 ·0~+25 •00!3 •0083 •OO!t3 •0083 •008l •CC!!3 t00M3 •00l:S3 •0081 •15~5
oOO •O..JU •f.;(J\)1 •OCQ7 •00'::7 •OC07 •0007 •()')07 •;;OC7 •OC1;7 •001.17 •OOU7 •OCO •0085
]'.)\) tOI.i07 •Ovv7 .0007 •0,;!.1 o0Ci61 •0061 t0061 •VC61. •Ot61 ·0061 •00~1 •0027 •0500
aoo oO.w27 tV:Ji!.l oOC27 .c::;z7 ·0027 ·0027 •0000 .... ouc •OC:wO .oovo •0000 tCCoO •015,
MAX I '1'J~ l~TENSITI€S FOR rHE STOR:1
I Ni EltVAt. DATE TIME: It~ I ENSITY
5 MN ~ It 70 !;10 •!SlO TIUH•~ 12·36 MMIHR '15 MN 9 ~ 70 suo •::J40 lN/ll•~ 8tf:"t r,MihR
JCJ MN g It 70 'tit~ •?.9S puHR 7•5t MI"'/I'IR ...
1 HR !) 4 7C <t2:3 •?.ti· N/rl:~ 6•3 MM!HR 2 HR g It 70 ltOO •113 TIUH!'l 1t.'t0 MM/M~ 0 6 I'IR 9 '+ 70 230 •07;l lN/r1R 1•85 MM/HR ~5575~385003/~VC~ 2~v10 !I 322t:i070
'
'+ 830 9·67 •+7R 'I "t 510 ·51,,
"t sec •34 !:1"'
HS .ao ~ '+ lt25 •25 9 "t ~~tOO •17 g It 23C t0711
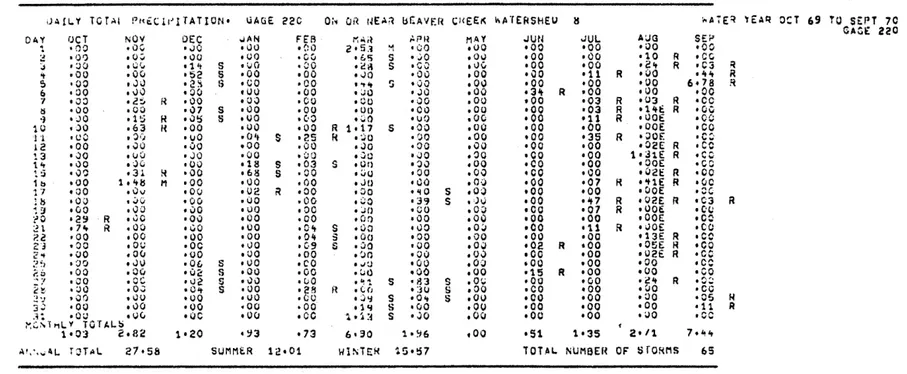
prepared. The report summarizes the precipitation record on a day-by-day basis as well as with selected individual storms. An update of
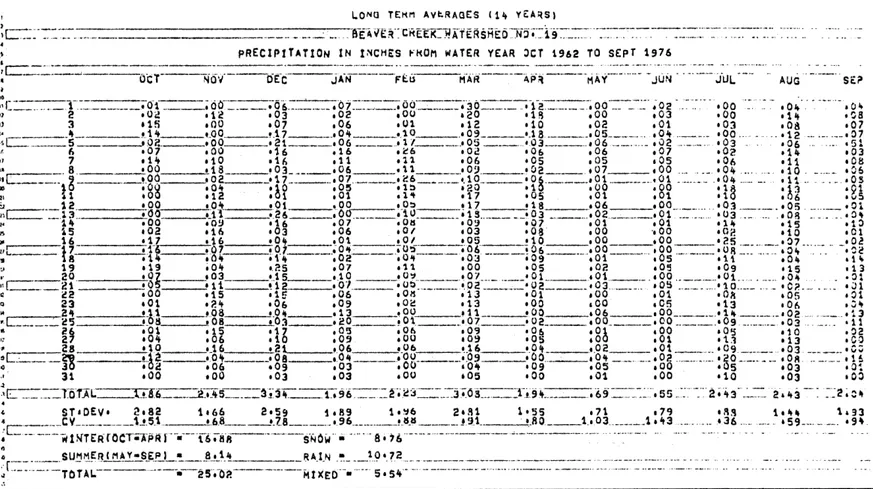
long-term averages is also prepared for each watershed.. Sample summary reports are shown in Figures 6 and 7. Apparently there were no snow course measurements taken in the Beaver Creek Watershed. If this data is available it should be included in the data base. If not, snow course measurements may need to be taken for use in snowmelt runoff studies. QUALITY OF PRECIPITATION DATA
The accuracy of the precipitation data appears to be quite good. Errors do occur from clock malfunctions, mistakes in servicing and improper digitizing. At present, rainfall records are output at five minute intervals. For large watersheds this time interval is probably adequate. For smaller watersheds, a five minute interval may be too
long; consequently, important perturbations that would affect the runoff hydrograph might be missed. The choice of a five minute interval coin-cides with the water level stage recordings taken every five minutes at the various discharge measurement stations. Fortunately, the raw digitized rainfall data is in such a form that values of accumulated rainfall for intervals other than five minutes can be readily obtained.
Coverage of precipitation gages has improved greatly over the 1977 summer period with the addition of ten new gages installed in Woods Canyon and Bar M Watersheds. Although the total coverage has been improved, there are still areas that are not adequately covered by recording rain gages due to inaccessibility of sites and lack of avail-ability of recording rain gages. One possible solution for better coverage is to separate some recording and standard rain gage pairs and place the removed gage in a new location. This should be done only after careful comparisons of the consistency between the measurements
i)A {L. 't' TC T ><I !'' tc t: C ltJ l TAT I 0 N • UACiE i.'2C Oi~ CJil !~Eo\~ bi:AVF:I~ CI<EEI< V./1 IERSHEU M ;..AT(~ 'I'EAQ OCT
,,
TO S£PT 7004'1' r;cT NOV oe:c .JAN FtB r: "il ~PI~ MA'f' JUN JUL A~CJ SE? GACE 220
t •00 .ac, •.JO o\JO •011 2 •5.1 M •CO oOO •00 •00 ti)Q •00
;:! •O') .o;-; oi)Q oOO •CCI •€.5 s • .:.o .ou •00 •00 •10 R •CC
;J •:J{J oU1.t
11, 1t s t\.10 •00 •«!" s •CO tV<i •00 •00
.a,.
R •C3 R't •00 oOv •52 s •00 •00 •.JO •Ou .oo •00 •11 R •00 tltlt R
~ •00 tJJ •2S I) •00 •00 I "tit ~ •'JO .01,) •00 •00 t\JO 6•78 R
6 •00 ovv •OCI tUO •00 •~0 •JO .oo •31!: R •00 •i.lO •00
1 •00 ,z:, R •00 •00 •CO •CO •00 .oo tOO •03 R •U3 R •CO
1:1 •00 oOO •v7 s •00 •00 •0() •00 .co •00 •03 R •1H. R •00
•) •JO ·1!;; R •v~ s oUO • C:O .;:.o •UO .oo •00 •11 R •OOE •00
10 ,.)Q ·63 H •00 •UO •00 R 1•17 s •00 .oo •00 •00 •OOE •CO
n •UO • 'J(j •VO ·0'• s •25 k ,·,;;o •00 .. oo •00 •35 R •JOE •C::
12 •00 o\:lO •00 tOO .oo •JO •00 .oo •00 •00 •02E R •Ct:
!3 •JO ev\J •JO •UO •UO •Jtl •<JO .~o •CO •00 1•J1E R fcc
t'r •vO oJ(.; •00 •18 s •03 s oOf) ·~O .oo •00 •00 •00£ •CO
15 •00 •31 !i •00 •68 s •00 •:.iO •00 .oo •CO •00 t02t R •00
1b •00 ltltl$ M •00 o\.)Q .oo eJ!) q}Q ,Qij •00 •07 R •'t1E R •OC
p •00 oUv •Oo •U2 i( oOO •00 • 'I 0 s .oo •00 •00 •:JOE •OC
l~ •OJ ,.;,c;, •00 •UO .oc .;;;o ·3~ s • 'Jv •00 ·~7 R •02£ R •CJ R
;;, •CiO .uo •vO •00 • 00 • ;J() •00 .oo •00 •01 R tUOE: •CI.i ...
~0 •2!1 R .0c •00 •00 ·00 o(H) •00 .oo •00 •00 •OOE •CO N
21.
.,
.. R .oo ol,jQ •00 •O't s •00 •uo .o:; •00 •'11 R •JO£ •CO?.a •00 .oo •00 •00 •01+ s •00 •00 .oo •00 •00 •13E R •CO
23 •00 .o~ •OC t\,)0 •C·9 s .oo •00 .o.;; •02 R •00 •05£ R •CO
Z'+ •00 .ou •00 •00 •00 o()Cl •Ov ,Q.) •CO •00 •U2E R •CC
=~~1 •00 o,J\) ·0£. s •00 •CO o.J:i •00 .oo •00 •00 •Oo •CC
t!,i> •00 ,Q(J •vi! s •00 ·00 • tit) •00 .oo •'15 R •00 •00 •CO
~ .. "'I •CO .oc nJi? s •vO o(.;Q ·~t s •83 s 0'' •00 •00 •cit R • f'\~t
~~· .;;o .o..::; •04t s •00 •28 ft
.
(;(; •:HJ s.
.oo ., •CO •00 •VO •CO~; •00 ouO •UO •UO •CO •J':f s •O't s .ou •00 •00 •00 •05 N
~:' •00 .oo •00 •00 •00 t'l'J s •00 .ou •00 •00 •CO •11 R
·'. •0:.1 o\)C., •OC • \HJ .oc 1. ~ =~ s •JO .oo •00 •00 oi.>O •CC
~G:".1Ml.Y TOTAL~
1•03 2•82 1•20 ·~3 •73 6•30 1•!'16 .oo •51 1•35 21/1 7•~lt
"'·',,;-'L roTAL. 27•58 SUMMER 1i!•01 Wll'\TEH 15•!57 TOTAL. NUMBER OF' SfORMS 65
1 ~ONO TE~M AV~RAQ~S 114 YEA~Sl
~c
..
~~--=-=·:._-.-__ -__ -_-_-_---:::.:.-:.:..:_-_-_-_-_-__ -_-_-._-_-__ -__
~_-__ -_
·a£4v£;r· c'i~tE'iC1~AtfRsRE:o~}E:r;·~1·g-:-:..-::~: ----~---· .. ----.. ---·-··PRECIPITATION lN l~CHES f~OM WATER YEAR ~CT 1962 TO SEPT 1976
~c:-_-:-_:::=-....=---(fcT:-
__
;dv·---ort=-
J-~-~==-=~t~_:----~:~R·==--.-:--_:-~P:~ -==~~~4'1'_::~.~-~:-:.: J~~~·:·: .:.::~J~L SE?14
of the two gages. A gage may be moyed to another location if it is found that nearby gages can accurately determine the rainfall at the present site. These approaches should be considered in order to optimize available equipment and manpower. Another approach to solve this problem is to place more standard raingages and to describe the spatial and
temporal variations by interpolation using records from recording rain-gages.
ADDITIONAL CLIMATIC INPUTS
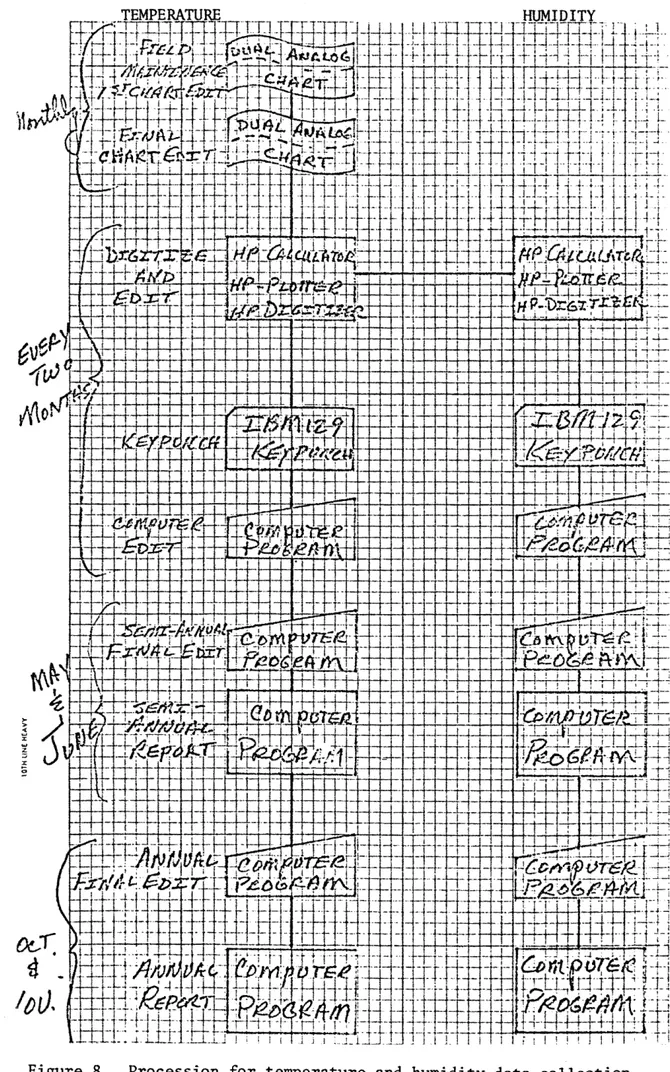
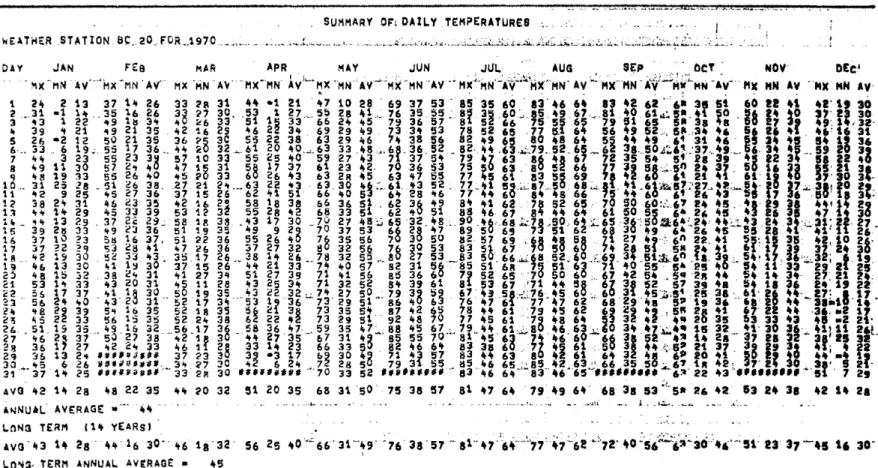
Temperature, humidity and wind data are collected and analyzed in the same manner as the precipitation data shown in Figures 8 and 9. A typical hygrothermograph chart is shown in Figure 10. These charts are edited in the field and by office staff every month and digitized every two months. Semi-annual and annual editing and summarization of results into reports are conducted. Sample summaries are shown in Figures 11 and 12 for temperature and humidity, respectively. Wind
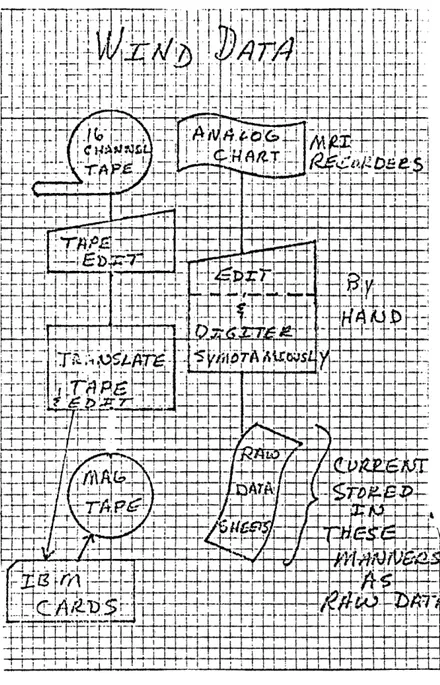
data is a newer addition to climatic input measurements. Data processing, as shown in Figure 9, is also similar to the other climatic inputs.
Information obtained from the field strip charts include wind direction, velocity and temperature at a height of ten meters. Presently, wind data has not been reduced for computer analysis.
Possible errors in temperature, humidity and wind data result from equipment malfunctions, mistakes in servicing the equipment and improper digitizing. For example, equipment malfunction is believed to be parti-ally responsible for the high maximum humidities continuously recorded throughout the year. These malfunctions probably result from the need for constant calibration of humidity measurement devices. If humidity data is deemed important, more effort must be expended in equipment
lS
maintenance. Sensitivity of the maxiJ:Jn.ml...minimum thenno.meters to move-ment can also cause readings with errors of a few degrees. It should be noted that for a period of three to four years, the minimum temper-ature was assumed as occurring previous to the maximum tempertemper-ature, not the minimum temperature recorded for a 24 hour period.
Temperature data appears to be good but humidity~and wind data
seem to be less reliable. At this time missing climatic inputs include soil temperatures and moisture content, dew point, solar radiation, evaporation, and interception. Reconstruction of the Woods Weather Station will provide soil temperature information and dew point data, but there are no installations for 1neasuring soil moisture, evaporation or interception. These last two measurements are important for an accurate portrayal of the water balance in a forested watershed. WATER AND SEDIMENT DATA
Water and sediment data are grouped together since they are collected at the same installation.. There are 20 watersheds in the Beaver Creek Watershed proper, numbers 1 to 18 plus Woods Canyon and Bar M. Three subwatersheds, 85, 86 and 87 are located within Woods
Canyon. Measurements were suspended on Watersheds 1, 4, S and 7 after
the 1973 water year. Each watershed has either a flume or control section where water discharge is measured and sediment is sampled. All facilities are self contained in permanent structures. For Watersheds 1 through 18, runoff passes through an extended concrete trapezoidal weir as shown in Figure 13. Water levels are recorded with FWI or Stevens A35 water level recorders on strip charts and punched on 16 track paper tape1 Figure 14. Strip charts are continuous but the tape
Figure 8. Procession for temperature and humidity data collection and analysis.
17
Figure 9. Procession for wind data collection and analysis.
Figure 10.
18
Example of hygrothermograph strip chart.
ANNUAL~ AVERAGE •. -...~ 44 ~-u·'"'· ~-··- •· . . ' ... ~,~. ' ·--~ -.. ·~·'-lti -·.. 1 .. "'·~~ •. _...._ .. : ,... ...~; ...
\.nNB TERM t1lt YEARS) "'
.wa·lt3 1+ aa· •••16 30~·,.6 1.a·3a· 56 2s .. o·~:66·u--.,.:76·3a·s7-·at·: .. ,.l,~
....
!..7·,· ..
·~-::..~2.;.i.,z·'o~~,~i:t.:..;(F..
,·.;.;st.:ea·a7~,5 '' ao·l
\.n~3· TERM ANNUAL AVERAG£ • 45
Figure 12. Example of annual daily humidity summary.
w
21
have special rating sections because of their larger flows. Both sections are composed of broad, slightly V-shaped sections as shown
in Figure 15. Further details
may
be found in Brown (1969). Ea£hof the Watersheds 85, 86 and 87 have a Soil Conservation Service two foot H-flumes for runoff measurement. Dimensions of the H-flumes are shown in Figure 16.
Raw data of water level recordings follow much the same analysis sequence as climatologic data. The data processing sequence for runoff data is shown in Figure 17. Again, field data is edited at collection time and in the office. Strip charts are used as a backup and check against the punched tape. The 16 track punched tape is translated into stage heights and the stage data punched onto computer cards. These computer cards constitute the raw data file which is edited in May and June for the semi-annual report and again after September 30
for the annual water year report. The annual report consists of several different but related presentations of the raw data.
These will include the annual summary, a file listing daily runoff
and peaks, a cfs file listing hygrograph values at selected break points, and an event file listing runoff volume and peaks for discharge events. These listings are shown in Figures 18 thorugh 21, respectively. In addition, other summary and work sheets are provided from the raw data file.
Equipment malfunctions often produce many of the problems in flow records. Freezing of water, clogging of intake pipes, debris blocking the section and failure of the heating systems produce errors or breaks in the recorded data.
22 ---6·-<r •· +··--s··o··--··--o1 .SECTION A·A
A-,
l
L~--i+---1---L..J...--...s...,....I--L.;;.._s.._....J
FRONT ELEVATION (}.DOKII'Itl QP4TIII!II/If)Figure 13. Drawings of extended trapezoidal flumes.
23
Figure 14. Portion of 16 track puneh tape for stage measurements.
24
Stlllfnl Will
._,_. _ _..""· Concrete 1oM • ~
"'• •.-.,.~ ( 4 Perforated ~ Pipe placed level tO below
!.Odder +,..Jo cllonnel vrode ond
~~. backfilled with 9'odtd
.,.+
oweoot•.s .. Note A110¥t ~----~ l B ... Nott A&ow
1" Coble ~~~~
\
\
~
\ i A("Bock filled Alto_) ( Boekfilled Atto) :: • • Expontlon i! JOint
..
:: ),-if
Conc:ret t Slob::
B PLAN VIEW I t I I I ' I I I I I I t I I I I I I I I I I I I I I I I I I I I I I I I I I I I I I • t I I ' I I I I I I I t I f I • I I I I I ~ ~ ~ ~ w ~ o ~ ~ ~ ~ ~ e DISTANCE IN FEET _ ... ___ ----~~-E_y~ION _.Y!!!... ---·---··· Figure 15. Woods Canyon gaging installation.25
26
Sediment samples are obtained at selected discharge measurement stations by either a sediment basin and Barnes splitter, or a PS-69 pump sampler. The sediment basin and Barnes splitter (Brown et al., 1970) are installed on Watersheds 1, 3, 4, 9. 10, 12~ 14~ 16 and 17. Pump samplers are installed at Watersheds 8, 12, 13 and 14, Woods Canyon, Bar M and Sub-watersheds 85, 86 and 87. In the sediment basin and Barnes splitter installation, suspended sediments are sampled on about a 1:60,000 ratio of the flow over a broad crest weir. Bed load samples are collected behind the weir in a settling basin. Brown et al., (1970) demonstrated the accuracy of this system with field tests, showing a probable error of less than 18 percent. The PS~69 pump samplers have a fixed position intake port which samples sediment from a region where turbulence is articifically created in order to produce a depth constant concentration profile. This concentration profile allows placement of the pump intake in a fixed position. Pump samplers are activated by water level variations.
Sediments trapped in the settling basins are either directly weighed or surveyed to determine the total sediment yield. The volume of organic debris present in the bed load is determined by burning a portion of the trapped sample and noting the weight loss. This allows for determination of the total sediment yield withoutthe organic debris. Measurements of channel aggradation and degradation have not been conducted. These measurements should be taken to provide base line data for long term watershed changes. This is particularly important in order to differen-tiate between sediment yield derived from overland erosion and that derived form channel storage. Suspended sediment samples from the splitters and pump samplers are filtered, dried and weighed at the
. ·'• > .. ~ ,1,,r:.;;;.f_.::":'"~~:"'":·_rr-r",~~""'··rr·,~···~'> ... ,. •· ···•·::t·" . ~ ,.~ . · ,., ... .... '-:"·~.: ·7"* ·,·.•;·~ r;.;1~~~.~ ... :• · J, ..
. . .... "··· ... , .. -, .•. ,...r,1..,.,.,_.~ .. ~ ANNUALr. STAEAHFLO~LSOHMARV tN ACR~·.1FEET. FOR WA !ER YEAR .. ~'60 .~ ... ,., .. -~ ... ,.~~~.-.~... "<:'· .• ~··· . .
,.,.-.. . ., ,.,.-.. , • ." :.~·:-·~-- _BEAVER CREEl<:. WATERSHED NO • 013 . . 91~• ~ ACR~S . . .· . ..
PEAIC FL0~8 FROH11gct
0
1··T~RSE~1~~-~N.CUBI~L~~ET_ PER11gEcg~o yR· TtMr:·:·:~·~:'"'r-:r·FLOW··r:,::'"': HO ··oj>'ylt'"T!Ht:"'' ., ... ~.FlOwWJNTEit flt12 25 59 115 22•00 . f2) 3 .. g 60
0 .. 111.0 .. 18t10 .-... ,3) 3 1 60 119~0 .. . 16•7 .. SUHMEit 1t 5 5 60 1020 •Ota 2) S 4 · 6 2HO •OS ~ · 31 S 1 60 030 •Oi
OCT ; ' .. NOV DEC .. :····:JAN -~ ... FE a:~·:· ~-MAR ·. ··:.•;:·· APR . MAY . JUN ... , JilL ... AUQ .... ,_, S£p -~~.-.
o:'t
aOO tOO iOO ·-;~~:-~:~·· •21 S9 ·~:,.~2•41 ·u· t1.3 SA·'·7'''' t2? 9 :., ... ,.t07 S .· t01 Q 00 -~~:··:tOg ., tOO~
:88
:~~
1
1:88·-,~~y~~:~t ~~···r:·l:~r ~~ -.,:~a l
5·~~;r:~f I~-~~·· :831·-~:e!""
:81
g ..
,~~:·.~
:gg
a .. ,.: ..:~:
:8o :-:-· ·· :88 ..
;
:88
:ot
X : ... :&8 ....
7~~:·':~~ ~~ .. , :v. ::~s
~ a:~~I
a~I
-~~ :~8I ... -.... :8i g
:88 g
:gg ·
:88
, .oo ·.ot s ·::·too· ... .,.,_..,s,·s,·"::···taB s s.os s .... .,•13 s. ·.o? a·· ··•oo .oo
1 tOO , . . . • • 0 0
00 S. _ _., •. tOO . ...,. ... ". •56 SA ww1•02 S 17•77 S ti3 S ... ,,.. tO? !
•,88
eOOa··:··:. t01 G .oo
t01 tOO
R tOO S :•: ·tOO • . · •5ta SA . 1t90 S 20•98 S ti3 S ·.. e06 ~ ,oo , .oo -·· .... ·~ .oo. s ··~~~·· .oa ... ...,""" ... ~ •56 SA.,., .• 2•70
8 s. ·~ 19•2g 9 s ···"'·'.·.· ,•J3 3 8s ... 0o5s ! .... _ ... ·.·· ,.0o0o . ,oo
I
B..
•01 Q tOO aOi .oo10 tOO 100 S . : aOO .. : ·. ·. •56 SA·.· 1•55 15•31 .. s s t01 B Q. .oo u tOO
1t aOO ~ tOO ··.···~oo:··;" .. ,;. •56.SA '1•13 $ '1.2•64 S ·., 't1.3 S . a04 tOO B tOO .oo
li
:88 ·;" ;-· •• :88 ····
.,.~~~:gg
·--:""·~·..
:tf ~~
•-. ··
:;5
! .
"'li::t
~ ··q-,•• :1~ ~ --c··.~· :8~:88 : ... :88
. :88
s '• •01 0 •01 s G 1' •00 ... tOO ••.•og . .
t66 SA ... •551 SS .. ,r.., S8ttOO! SS. . .. •06 S ..•. ,. t003 tOO tOO tOO
1! tOO tOO aO . , .... ,. i6(a SA •s co tOS S · • 3 aOD eOO aOO
s a01. B
s tOO G
s tOO B
1 '"
:g8
:88
···~·:u r···
:tt
1r ..
_,y, :~= ii·.~- ~:~~1 · '
05 s ·:s~ .oo1~ tOO 00. •U S ... •66 SA '. •!1 SA . 3•53 9 . :8~ :3·~··· .. a02
:gg
s ' ... ~" l tOO G s .. tOO G tOO tOO ... tOO .oo tOO tOO tOO
~3
:88
· !88· · ·.
:~~
3
r.-~;· 1:a~ ~~
·-·#
!11
~~
t:18 I
:8~
It
·~
:·
:8~
s s tOO B G:88
8 .oo G .oo tOO R
•08
•021 aOO
··.88
:'·•-::···-·1·11· S ''"""~1.t02 SA'""-~'•21 SA 5t?1 B.·:··•84
SA'"~-:··~,02 S ... ,_ .. ,oo G. aOO~!
!gg
··~·- .oo ~-... 7,,1:§J
1·
~..
}!g~ ~~·r·· ..·:rl
~~..
,·i:;~!... ·
!8!
li
:811 ... , ..
:gg
a
...
!gg·-tOO
"
•gotOO R • 0
tOO R ~ ... - t 00
2s tOO
:88
···<~'"ei:~a S .,_1•02 SA. 113 SA ·. 3•50 S tOo\ S5 t01 ~--.. ~ ....:88
Q .oo tOO R R •00 tOO ,oo2A: tOO ._. .. tOO :~~··;"·6·~· s···5:"'1i02 .. SA'T : .. ,13 SA~· 1.t93 S tOta S t01 G -··· . aOO B ··,oo
1:·
:88
·
:88~. ~· 2!s~ I~~;·~,:·~:~~ ~t·..,:··a~ ~~·:·..
1.:~~ ~:831 ....
:8~:· :88
g
.oo:gg
.. •00
.oo . •00
tOO •00
13
:88
:88 ..
3:~~ i~ -~~~:3~ ~;~·':7"~.·:&! SA .. , ~:uI ; :89
l·-~w:8l :·:•".-· :88
a
. tOO .oo ... •OO tOO:88
31 eOO ,oo 6a74 SA""''2i94 s··~~ . •OO ... . t33 8 "100 . a01 Ci .· aOO. tOO •00 tOO MONfHL. y TOTALS . I ' . , • ' • · - . . ... . • . .
AC::tFf• tOO t49 . 154•86 . . . . 29•63 ·~ .... 21•t!! 184•41 2t9g t.t07 t1.6 tOP •00 aOO
INt tOO t01 a72 . . · t39 r;., 2•+3 a04 t01 tOO tOO tOO ,oo
SEASONAL TOTALS • ... - . ANNUAl TDTAbf
yf':AR 40CT•S£P)•
Figure 18. Example of annual streamflow summary.
295•3! &C•VT•
29
31
32
Flagstaff office to determine the concentration. Although sediment concentration data is being c·oded, apparently there is no completed computer data data base for sediment data.
Settling basin and Barnes splitter installations provide adequate data for total yield when the splitter is not affected by water borne debris. These installations do not provide any information about the sediment flow hydrograph from the watershed. The pump sampling, on the other hand, provides sediment discharge versus time data but does not sample large bedload materials. This problem is alleviated at some installations where a pump sampler and settling basin exist. Not only are equipment malfunctions a problem with pump samplers, so is the plastic tubing which contains chemicals that attract small rodents such as rats and squirrels who eat the tubing. A major concern with the splitter sampler and the pump sampler is whether the sample taken is representative of the sediment being transported. Brown et al.,
(1970) showed that the sample was representative for the splitter and Norman Champagne (personal communication, 1977) reported that his tests show that pump samples are representative of suspended sediment discharge.
Some concern has been expressed over the sediment samples taken on Subwatersheds 85, 86 and 87. Problems arise when bed load sediments deposit in the H-flume throat causing perturbations in the flow record. These deposits also provide a continuous source of sediment that is not representative of the sediment transport. For example, sediment is transported into the flume during the rising limb of the hydrograph
where some settles out in the backwater of the flume. As flow decreases, the previously deposited sediments are entrained by the flow causing
33
sampled sediment concentration to be higher than the actual inflow concentrations. Another problem may also arise when sediment in the turbulent mixing sediment sampling box is resuspended by flowing water. There may be some enrichment or increase in concentration if there is resuspension or if there is not a complete exchange of water through the box. These problems will be analyzed in more detail in the final report.
Two other types of sediment collection devices have been installed in Woods Canyon by Burchard Heede. One device is a bed load sampler consisting of a metal lined trench that corsses Woods Canyon Creek. The trench is approximately 18 inches wide, 2 1/2 feet deep and 50 feet
long. The sampler trench is slightly below the streambed level. If a moderate to large runoff event occurs in Woods Canyon, this trench may rapidly fill and not i-dicate the total sediment transported. The collection trench completely filled during the 1978 runoff period indi-cating that it was undersized for the amount of bedload. If a smaller runoff occurs that partially fills the trench, removal of the trapped sediment may become a problem. The other type of device installed by Heede is an overland flow sediment trap. This device consists of a trench and collection barrel for catching water and sediment from small water plots. A problem that is noted with these plots is that their boundaries are not well defined and extraneous flow may enter the small drainage changing the contributing drainage area. A solution to this would be to place a metal edge barrier or a covered earthern berm around the watershed boundary. Another problem that may occur is inadequate storage in the barrel collectors. Runoff during 1978 showed that over-land flow did occur. However, some of the collection barrels floated
34
out of the ground with the bankfill material became saturated around them. Both types of sampling installations must be redesigned or reevaluated to overcome these problems.
WATER QUALITY DATA
Besides a lack of sediment data, there is a lack of long term water quality data for watersheds in the Beaver Creek area. Presently, some data is being collected for major cations and ammonia nitrogen precipita-tion by Ralph Campbell (personal communcaprecipita-tion, 1977). Analysis equip-ment capable of detecting major cations, and nutrients has been purchased for site productivity analysis. This equipment, including a Techican Auto Analyzer II, can provide in-house analysis of water if necessary.
DATA EVALUATION
TIME AND EFFORT REQUIREMENTS OF DATA COLLECTION AND ANALYSIS
The mechanics of data collection and processing are just one part of the entire system. Another important part is the time required for the actual collection and analysis. Office analysis of recording charts occupies about one week for checking and digitizing. Most of the time and effort is collecting data and servicing measuremement devices. A primary constraint is the accessibility of installations. During the dry months, installations are reached by foot or by tracked sno-cats. During these cold and wet months, equipment malfunctions increase be-cause of the harsh weather which further slows collection efforts. When malfunctions occur, the problem unit is returned to the shop where it is repaired before being reinstalled. By servicing the measurement equip-ment, its reliability is increased by the time it is needed for collection.
The time needed to reach and service the recording installations is dependent upon access conditions from the main highways into the watersheds.
35
During the summer if all goes well, it takes about one week to collect data from seven different routes (Table 3).
Table 3. Time Needed for Collecting Data and Servicing Installations.
Route Stops1) Time in Days 2)
1
2 3
Watersheds 15, 16, 17, 18, Bar M, Woods Canyon plus Rocky Park Precipitation
Watersheds 1 to 10, two subwatersheds in Watershed 8
Woods Canyon Subwatersheds 85, 86 and
87
1-3
1-2
1-4
4 Watersheds 11, 12, 13 and 14, one sub- 1-2 watershed in Watershed 8 and one extra
precipitation gage
5 Burchard Heede bedload sampler 1-2
6 Rattleburn (summer only) 1
7 Other precipitation gages 2
!)Includes nearby precipitation gages
2) h S orter 1n summer, . 1 onger 1n w1nter • .
During the winter months when access to the watershed is extremely difficult, completion of the sampling routs can take up to two weeks for one person. More time is spent when vehicles breakdown or recording equipment malfunctions and needs to be repaired or replaced. Because of a lack of space, tools are left off the snowcats to allow hauling of more samples. If the snowcat or a piece of equipment malfunctions, the field person must either walk out or abandon the malfunctioning equipment before he can return to fix it. The age of the over snow vehicles is also leading to lower reliability. If the watershed is going to be instrumented at the same level as it is now, then the travel equipment must be replaced or upgraded. In addition sampling by lone members is to be discouraged for sake of safety. The numerous sampling sites to be serviced not only cost personnel hours they also create financial burden in terms of vehicle operation and upkeep. Table 4 is a brief
is a brief list of the good weather travel times and distances that field personnel confront.
Table 4
Distances from Watershed Base Camp to Selected Watersheds and Precipitation Gages
Shortest or best
Destination route in miles
Subwatershed (SWS) 85 12
SWS87 17
Lee Butte wind tower 15 Recording Raingage (RRG) 65 14 RRG 51 11
sws
82 8sws
83 8 RRG 20 7 Watershed (WS) 14 7 RRG 26 8 RRG 27 12ws
12 6Standard Rain Gage (SRG)
so
10ws
3 10Ratt1eburn (Summer only) 71
RRG 18 8 SRG 69 9
sws
86 13 RRG 53 16 RRG 73 19 SRG 72 7* RRG 55 8* SRG 40 (Lee Spring) 14* RRG 35 4* RRG 64 4**Distance from Interstate Highway 17 not Watershed Camp
Travel time fair weather (minutes)
so
70 60 60 40 30 30 25 25 25 35 20 30 30 180 30 20 55 60 75so
55 90 40 40The distance and travel times in Table 4 give an average rate of 17 miles per hour over watershed roads. Some portions will be faster, however, and some much slower. Winter travel times are considerably slower as the time to get to SWS 87 is about three hours.
Another factor besides time is the increasing cost of fuel. All the trucks are estimated to accumulate 3000 miles per month. At five miles per gallon consumption, gas usage is 600 gallons per month. With current gas prices this is a substantial cost.
The current collection routes appear to be the best for efficient use of personnel and time. As the network changes, so will the data collection routes
3.2 ]uality of Data
As previously explained, the accuracy and quality of data is constantly checked in the field and in the office. In the field, the technician checks the timing and measurement settings when a chart is removed and replaced. The technicians have been trained in proper chart positioning and timing, as well as- noting any abnormal situations which may affect the data. In the office the data is further checked to see
if it is consistent and does not contain any inexplainable perturbations. When questions arise over irregularities in the data that cannot be
resolved by cross checking with backup records or nearby gages, consul~
tation with office and field personnel is used to determine how to avoid such problems in the future. These consultations are necessary so that both field and office personnel recognize each others concerns about the raw data and so that future problems can be avoided.
3.3 Data Accuracy
Data quality and data accuracy are strongly related. Quality cannot be high if accuracy is low, and vice versa. Therefore, to be most
useful data must be both accurate and of high quality. Data is accurate if it provides a truly representative value of the item being measured at a correct location and at a time interval that is characteristic of the value being measured. For example, a stream gaging system may take automatic readings every five minutes. This interval may be adequate for large watershed with response times of several hours, but inadequate for smaller subwatersheds with rapid response times of a few minutes.
The example presented above leads to the concept of temporal and spatial variability in the physical system being sampled. Data collection networks are set up to sample data and try to define this variability. However, it is the variability and sometimes the lack of understanding of it that creates inadequate or inaccurate data. Therefore a physical system should be continuously studied or evaluated to recognize its variability and adjust the sampling program to better represent the system. Examples of these concepts as they apply to the Beaver Creek data collection system, or other systems, are numerous.
One example is the type and placement of raingages in a watershed. Initial placement should be based on, among other things, available funding, personnel, topographic considerations, and the size of the sampling area. After some data is collected it should be checked for redundancy between the gages. If the gages exhibit similar response to storms in terms of total precipitation and nondimensional time-accumulation
(Figure 8), then fewer gages may be warranted. This is often the case in general frontal storms and the sampling interval is on the order of
0
Figure 22.
T* 1.0
Accumulated Nondimensional Time
Nondimensional mass rainfall curve showing different pattern types.
one hour. However, if storms are extremely localized then volumes and timing can be quite different (Figure 9). Noting this type of variability can allow opening and closing of certain gages depending on the storm type season. Another example is the selection of sampling intervals that portray the item being measured. As previously mentioned, too long or too short a sampling interval at a stream gage may lead to missing information or excess redundancy in the data. Too long a sampling
interval can miss important information as a quickly responding watershed, while too short an interval will oversample the item producing excess information. Therefore continuous gage record strip charts must be examined to see the response of the system, or mathematical analyses made to estimate the response time of a watershed. A third example is coinciding records between input and output. A classic example is the weighing recording raingage used for a small watershed. The continuous strip chart recorder often used in this raingage can be read accurately to about 5 to 7.5 minutes and 0.025 inches. Because of this inherent accuracy, errors in computing intensities for short durations and small rainfall increments can be quite high. Also the timing of five minutes can be much more than the time of concentration of a small runoff area. This means that the volume measured by the raingage is out of the watershed within the time accuracy limits. In addition, time increments of five minutes may be too short for a basin with response times of hours. Other types of errors that affect accuracy are also possible, such as timing shifts between rainfall clocks and runoff clocks. However, personnel responsible for data collection, analysis, and use are cognizant of
these rainfall problems and are trying to alleviate them as much as possible. Another source of data error is in the sampling device used. In
atershed
Storm Movement
0 L---~
0 General storm-similar patterns
T*
Watershed Boundary
0 0 Localized storm-dissimilar patterns
Figure 23. Storms over a watershed with three gages and effects on patterns.
T*
1.0
conditions where water level heights can be measured. The relationship between discharge Q and gage height or stage S is usually of the form
(1)
where a and b are empirically determined or are characteristic of the device. The value a can vary widely while b is almost always greater than 1 and often in the range of 2 to 4. If b is, for example, equal to 3 then a simple error analysis shows the accuracy of discharge measurements. Linearizing equation 1 yields
lnQ
=
lna tblnS (2)and differentiating gives
(3) Because a is constant as well as b they do not introduce any error into the discharge. However equation 3 shows that if the error in the stage is 9 percent when b is 3. Storage measurement errors of this magnitude are realistic and usually cannot be avoided. However, it should be recognized that they can and do produce errors in discharge computations.
Accuracy of sediment samples may also be affected by the sampler type. For example, if a splitter with a 1/10,000 split is used, a small error of 1 percent may translate to several tons of sediment. Accuracy of pump samplers is dependent on many factors. One key element is
locations of sampler intake with respect to flow depth. Sediment con-centration for finer particle sizes (silts and ckys) is usually constant with depth. For sand sizes, there is a decrease in concentration nearer the water surface and increase near the bottom. If the sampler intake is not placed at the exact point of average concentration (which is nearly impossible) then the pumped sample may not represent the actual
sediment concentration. These values can be theoretically adjusted if particle size, water temperature, and flow characteristics are known. Samplers located in mixing sections can alleviate this problem and provide more accuracy.
As with the rainfall data, the accuracy and representiveness of the other climatologic, sediment, and discharge information is a primary concern of personnel connected with the Beaver Creek Project. These individuals are doing all they can under present conditions to assure that high quality, accurate, representative data is available for analysis and use by watershed scientists.
IV RECOMMENDATIONS
Long and Short Term Goals
The long and short term goals for water, sediment, and climatic data collection focus on several types of studies. These include
development of generalized water balance models, sediment yield studies associated models, studies of nutrient losses with runoff and sediment, and on watershed classification. The more specific studies are usually related with short term goals. The long term studies would be develop-ment of generalized water balance model and watershed inventory and classification.
Long term needs
Long term needs should include acquisition of accurate humidity data for at least three representative sites in the study area such as one on the west side, one on the east side, and one in the southern part. Soil temperature and soil moisture data that is representative of the watershed should be maintained.
Reevaluation of all raingage sites should be made with respect to spatial and temporal variations. Such a study may indicate redundancy
of information during certain seasons that would allow elimination of gages for at least part of the year. Consolidation or closing of some watersheds is another decision that may cut costs and allow more effective use of time.
Development and use of a data bank information storage system is strongly recommended to facilitate rapid analyses of the existing collection system in order to make it more efficient. In addition, expanded computer availability through acquisition of a mini computer is strongly recommended to help long term needs of the system.
One other long term need is a complete, up to date classification of each watershed based on additional field surveys and previous data. The watersheds should be classified as to geometric measures, vegetation, soils, hydrology and hydraulics, climatic conditions, and sediment yield characteristics. Such a study may reveal that some watersheds are
identical and can be eliminated. One task in such a study would be a channel type inventory including bed material samples and cross section measurements.
Short term
Short term needs would also follow those suggested for long term needs except for a more intensive study of other concerns. One of these is the design and use of time sediment sampling devices. As previously discussed, placement and operation of these devices may be inducing error into the data. A study of these devices should be con-ducted to determine their effectiveness and accuracy with respect to prevailing conditions.
One short term need that should be recognized is better development of water and sediment studies. Use of available mathematical models would show the magnitude and duration of sediment and water discharges
from watersheds in order to better design sampling facilities. A better design based on mathematical model results would help avoid overloading the sampling system that usually results in lost data and lost time.
Another short term and long term need is a better characterization of the physical and engineering properties of the soils in the watershed. Such information would benefit all those involved in site studies and modeling.
Although other needs exist, these are the primary. As goals change~ so will the needs and the data collection system.
IMPROVED EFFECTIVENESS OF COLLECTION SYSTEM
The biggest and hardest to solve problem is the immense size of the data collection system. Most time, errors, and lost data occur in the collection phase. Analysis of the spatial and temporal variability of the system may indicate redundancy in sampling and allow removal of unneeded gages. Such a study will involve analysis of the entire watershed data base for rainfall, runoff, climatic, and sediment data. However, such a study may lead to a more streamlined system. Another hard question is what watersheds to eliminate. This task is left to future discussion.
V. CONCLUSIONS
The data collection system for the Beaver Creek Watershed is large and complicated. In spite of this, the quantity and quality of data appears to be good. Data being collected on the Beaver Creek Watershed is necessary for present and future studies. One major weak link in data acquisition is the lack of sufficient field personnel to complete the immense task of servicing all installations, particularly during the winter months. Lack of easy access is a major problem in the winter, one that cannot easily be solved. Problems with the number and access-ibility of gages may be resolved by a more complete study of the avail-able data. If indicated some sites may need to be closed. Office analysis of data seems as efficient as possible when using a chart
digitizer and punched tape reader. Programming personnel appear to have the capability of creating computer programs necessary for checking, analyzing and outputing information in useable forms. There appears to be a lack of a suitable sediment data base in the computer system
similar to that of climatic input and streamflow. An adequate sediment data base stored in the computer should be developed if it does not exist. More effort should be expended in building a water quality data base. Additional studies on soil properties and collection of soil cli-mate data are needed. Additional investigation of sediment samplers is needed. Every effort is being made in the field and in the office to assure that accurate, high quality data is available to the research scientist.
REFERENCES
Brown, H. E., 1969. "A Combined Control-Metering Section for Gaging Large Streams," Water Resources Research, Vol. 5, No. 4 ..
Brown, H. E., E. A. Hansen, and N. E. Champagne, Jr., 1970. "A System for Measuring Total Sediment Yield from Small Watersheds," Water Resources Research, Vol. 6, No. 3.