Department of Science and Technology Institutionen för teknik och naturvetenskap
Linköping University Linköpings universitet
g n i p ö k r r o N 4 7 1 0 6 n e d e w S , g n i p ö k r r o N 4 7 1 0 6 -E S
Analysis of GHG emissions
reduction from road transport:
a case study of the German
passenger vehicles
Khaled Al-Dabbas
2018-06-15
Analysis of GHG emissions
reduction from road transport:
a case study of the German
passenger vehicles
Examensarbete utfört i Transportsystem
vid Tekniska högskolan vid
Linköpings universitet
Khaled Al-Dabbas
Handledare Carl-Henrik Häll
Examinator Clas Rydergren
Detta dokument hålls tillgängligt på Internet – eller dess framtida ersättare –
under en längre tid från publiceringsdatum under förutsättning att inga
extra-ordinära omständigheter uppstår.
Tillgång till dokumentet innebär tillstånd för var och en att läsa, ladda ner,
skriva ut enstaka kopior för enskilt bruk och att använda det oförändrat för
ickekommersiell forskning och för undervisning. Överföring av upphovsrätten
vid en senare tidpunkt kan inte upphäva detta tillstånd. All annan användning av
dokumentet kräver upphovsmannens medgivande. För att garantera äktheten,
säkerheten och tillgängligheten finns det lösningar av teknisk och administrativ
art.
Upphovsmannens ideella rätt innefattar rätt att bli nämnd som upphovsman i
den omfattning som god sed kräver vid användning av dokumentet på ovan
beskrivna sätt samt skydd mot att dokumentet ändras eller presenteras i sådan
form eller i sådant sammanhang som är kränkande för upphovsmannens litterära
eller konstnärliga anseende eller egenart.
För ytterligare information om Linköping University Electronic Press se
förlagets hemsida
http://www.ep.liu.se/Copyright
The publishers will keep this document online on the Internet - or its possible
replacement - for a considerable time from the date of publication barring
exceptional circumstances.
The online availability of the document implies a permanent permission for
anyone to read, to download, to print out single copies for your own use and to
use it unchanged for any non-commercial research and educational purpose.
Subsequent transfers of copyright cannot revoke this permission. All other uses
of the document are conditional on the consent of the copyright owner. The
publisher has taken technical and administrative measures to assure authenticity,
security and accessibility.
According to intellectual property law the author has the right to be
mentioned when his/her work is accessed as described above and to be protected
against infringement.
For additional information about the Linköping University Electronic Press
and its procedures for publication and for assurance of document integrity,
please refer to its WWW home page:
http://www.ep.liu.se/Master of science|Intelligent transport system and logistics
Spring or Autumn term 2018
Master Thesis carried out at Division of Communication and Transport systems
Institute of Technology, Department of Science and Technology Linköping, Sweden
Analysis of GHG emissions reduction
from road transport:
A case study of the German passenger vehicles
ii
Copyright
The publishers will keep this document online on the Internet – or its possible replacement – for a period of 25 years starting from the date of publication barring exceptional circumstances.
The online availability of the document implies permanent permission for anyone to read, to download, or to print out single copies for his/hers own use and to use it unchanged for non-commercial research and educational purpose. Subsequent transfers of copyright cannot revoke this permission. All other uses of the document are conditional upon the consent of the copyright owner. The publisher has taken technical and administrative measures to assure authenticity, security and accessibility.
According to intellectual property law the author has the right to be mentioned when his/her work is accessed as described above and to be protected against infringement.
For additional information about the Linköping University Electronic Press and its procedures for publication and for assurance of document integrity, please refer to its www home page:
http://www.ep.liu.se/
iii
Abstract
Transportation and energy play an essential role in modern society. Since the Industrial Revolution, fossil fuels have enabled great advancements in human society. Within this process, Internal Combustion Engines Vehicles (ICEVs) played a significant role in guaranteeing reliable and affordable long-distance transportation. However, the subsequent increase of the Motorized Private Transport resulted in undesired effects such as pollution. One instrument in reducing the Greenhouse Gas (GHG) emissions of the transport sector is to shift from the conventional ICEVs toward zero local emission vehicles. Electric Vehicles (EVs) are being promoted worldwide as a suitable powertrain technology that could replace the ICEVs. However, unless combined with electricity from renewable generation technologies the EVs will not effectively reduce GHG emissions.
Through the simulation of future transport and energy sector scenarios in Germany, the GHG emission reductions have been analyzed. Techno-economic and environmental characteristics for several powertrain technologies under several vehicles charging strategies are evaluated. The thesis explores the impact of charging EVs on the electrical grid. The result show that EVs using smart charging strategies that support Vehicle-to-grid (V2G) are capable of fulfilling mobility needs of users while providing substantial flexibility to the electrical grid. Such flexibility can facilitate the future expansion of non-dispatchable Renewable Energy Sources (RES).
Keywords: Powertrain technologies, Electric vehicles (EVs), High renewable penetration,
iv
Acknowledgement
First, I would like to thank Dr. Andreas Plazer for making this thesis possible and for the advice. Thanks so much, Philip Sterchele for the personal and scientific advice as well as the patient and trust that paved the road to complete this thesis. Thanks for teaching me research and being kind and understanding supervisors!
To my supervisor Carl Henrik Häll and Examiner Clas Rydergren at Linköping University many thanks for the guidance. I want to thank my supervisor Prof. Juliane Stark at the University of Applied Science Technikum Wien, for your comments and valuable input. Thanks to my friends and colleagues from the Inter-Sectoral Energy System Department at Fraunhofer ISE, especially Lucas, Reinhild, Florian, Annelise, Judith, Vicente, Nino, Laurent and Davina for the endless discussions, advice and nonsense lunch conversations
To my WG, Michaela, Patricia, Silvi, Clause, Konstantin, Vero, Kira, July and Jan you made my stay in Freiburg feel like home, the hiking trips, dinners, parties and unending discussions, support, general help and friendship are all greatly appreciated. My Classmates in Linköping, Norrköping, and Vienna for the inspiration, debates, dinners and the fun to travel and party with them. Special thanks to Britton Hammit for the input, and Mahdi Abirshami for the support.
Finally, I would like to thank my family for decades of unconditional love and support without their trust this journey would not have been possible. I am especially grateful to my parents for encouraging me in all of my pursuits and inspiring me to follow my dream. I always knew that you believed in me and wanted the best for me.
v
List of abbreviations
BEVs Battery-Electric vehicles ELV End-of-Life Vehicle
EREV Extended Range Electric Vehicle EU European union
EVs Electric Vehicles
FCEVs Fuel Cell Electric Vehicles FEC Final Energy Consumption GHG Greenhouse Gas
HH Household
H-W Home-work
ICEVs Internal Combustion Engines vehicles IEK Integrated Energy Concept
Intergovernmental Panel on Climate Change MID Mobility in Germany
MOP German Mobility Panel MPT Motorized Private Transport NTS National Travel Surveys
PHEVs Plug-in Hybrid Electric vehicles PLDVs passenger light-duty vehicles PSO Particle Swarm Optimization PtG Power-to-Gas
PtX Power-to-X
REMod-D Renewable Energy Model – Germany RES Renewable Energy Sources
SMR Steam Methane Reformation SOC State Of Charge
TKM Tonne-kilometer TTW Tank-to-Wheel
UNFCCC United Nation Framework Convention on Climate Change V2G Vehicle-to-grid
VKM Vehicle-kilometer VP Vehicles Profile WTT Well-to-Tank WTW Well-to-Wheel
vi
Terminology
Curtailment: The electricity that is not utilized because of the lack of
demand and storage.
Fuel pathway Is the process of to convert a raw material, it into a final
fuel product.
Non-dispatchable: Electricity sources that cannot supply the electrical grid
according to the market need.
Peak Load: The maximum power during a period of time.
Power-to-X (PtX): Identifies technologies that transform surplus electricity
from renewable energy sources into energy carriers. The X refer to the energy converted to for example power-to-Gas, power-to-liquid, and power-to-fuel.
Powertrain The term powertrain describes the vehicle components
that generate power and deliver it to the road.
Residual load: Refers to the difference between the actual grid power
demand and the feed-in of non-dispatchable generators
State Of Charge (SOC): The ratio of available energy in the BEV battery to the
maximum storable energy in the battery
Trip chain: All the trips completed by a person during a day.
Trip: One-way movement from the origin to the destination.
Vehicle profile Is a profile that describes the usage patterns of the
vehicles. The profile provide the model with the number of vehicles connected to the grid.
Vehicle-to-grid (V2G): A two-way connection through which power can flow
from the electrical grid to a vehicle and from a vehicle back to the electrical grid
vii
T
ABLE OFC
ONTENTSINTRODUCTION ... 1
1.1 Problem statement and aim ... 2
1.2 Methodology ... 2
1.3 Thesis structure ... 4
BACKGROUND ... 6
2.1 Greenhouse Gas Emissions (GHG) ... 8
2.1.1 Sources ... 8
2.1.2 Mitigation ... 9
2.2 Energy ... 10
2.3 Electric vehicles (EVs) ... 11
2.4 German vehicle fleet ... 12
RENEWABLE ENERGY MODEL – GERMANY (REMOD-D) ... 14
3.1 Model Components ... 15
3.2 Operational management of the power system ... 18
3.3 Simulation ... 21
3.4 Model development ... 22
INPUT PARAMETERS ... 24
4.1 Vehicle cost ... 24
4.2 Vehicles profile ... 27
4.2.1 German National Travel Survey (NTS) ... 28
4.2.2 MID Data description ... 29
4.2.3 Creating trip chains ... 30
4.2.4 Identifying the charging opportunity ... 32
4.2.5 Home-work profile ... 35
4.2.6 Mixed-use profile ... 38
4.3 Charging strategies ... 39
SCENARIOS ... 42
5.1 Transport sector assumption ... 42
viii
5.3 Scenario definition ... 46
POWERTRAIN TECHNOLOGIES ... 48
6.1 Fuel pathways... 50
6.1.1 Carbon intensity of the energy carriers ... 50
6.1.2 Energy intensity ... 52
6.2 Sensitivity analysis ... 53
6.2.1 Fuel Cell Electric vehicles (FCEV) fuel pathway ... 54
6.2.2 Battery-Electric vehicles (BEV) battery price ... 55
ELECTRIC VEHICLE CHARGING ... 58
7.1 Vehicle profiles ... 58
7.2 Charging strategies ... 61
DISCUSSION AND CONCLUSIONS ... 68
8.1 Limitations ... 69
ix
List of Figures
Figure 2.1: Development of GHG in Mio. T CO2 Equiv. based on historical data and
Klimaschutzplan 2050 targets. Germany data from [9, Table (GHG_CO2 eq)]. ... 8 Figure 2.2: GHG emissions by sector from 1990-2015 data from [9, Table (GHG_CO2 eq)], and reduction target based on [10, 11]... 9 Figure 2.3: Final energy consumption in Germany by sector in 2016 [14, Table 5]. ... 10 Figure 2.4: German vehicle fleet composition for private passenger light-duty vehicles [26]. .... 13 Figure 3.1: Scheme of the energy system as presented in the REMod-D. The schematic shows some of the most relevant conversion pathways of fossil primary energy and/or renewable
energies up to the respective consumption sector [31, p. 16]. ... 16 Figure 3.2 Energy management strategy in REMod-D [31, p. 25]. ... 20 Figure 4.1: Official driving range under New European Driving Cycle (NEDC) for BEV
introduced in the German market (2010-2017). The circle size represents the battery size. ... 25 Figure 4.2: Comparison between German surveys MOP, KONTIV and MIV [64]. ... 29 Figure 4.3 A trip chain example of one person during one day. ... 31 Figure 4.4: Flowchart for identifying the charging opportunities (Is the parking duration long enough? Does the location have a charging facility?). ... 35 Figure 4.5 Percentage of vehicle starting/ending parking based on the home-work dataset form MID 2008. ... 36 Figure 4.6: Percentage of vehicles starting or ending a parking event based on the home-work dataset form MID 2008. ... 37 Figure 4.7: Distribution of vehicles parking patterns in home-work profile for different seasons based on MiD 2008. ... 38 Figure 4.8: Distribution of vehicles parking patterns in mixed-use profile in winter based on MiD 2008... 39 Figure 5.1: The percentage of registered vehicles in Germany according to their manufacturing year. Data from 2016 [15]. ... 43 Figure 6.1: Powertrain technologies composition and costs for private passenger light-duty vehicles under different GHG reduction target in 2050... 48 Figure 6.2: Installed capacity from Fluctuating renewable energy sources in 2050 for S1-S5. ... 49 Figure 6.3: GHG emissions from individual motorized transport in 2050 for S1/70-S5/90
classified into different energy carriers... 50 Figure 6.4: Share of renewable in the end energy consumption for energy carriers in 2050. ... 51 Figure 6.5: End-use energy for individual motorized transport in year 2050 for S1-S5. ... 52
x
Figure 6.6: Overall electrical energy consumption for powertrain technologies per 100 km. Source of the calculation is S4/85. ... 53 Figure 6.7: Sensitivity analysis for Steam Methane Reformation the PLDV powertrain
technologies penetration rate in 2050 in S1/70 and S2/75. ... 54 Figure 6.8: Sensitivity analysis for the battery price for powertrain technologies. . ... 56 Figure 7.1: Installed capacity from fluctuating renewable energy sources in 2050 using different vehicle profiles. ... 59 Figure 7.2: Electricity supply from fluctuating renewable energy sources and electrical demand for PLDVs in week 14 in the target year 2050 using different vehicle profiles. ... 60 Figure 7.3: Powertrain technologies composition and costs for private passenger light-duty vehicles under different charging strategies in 2050. ... 61 Figure 7.4: Total installed electricity generation capacities in different charging strategies
scenarios. ... 62 Figure 7.5: The source of electricity used in charging the PLDVs in User-Optimal and System-optimal. ... 63 Figure 7.6:V2G charging and residual load in 2050. The area below the x-axis shows the amount of excess renewable energy, while the area above the x-axis shows the amount of electricity needed for flexible dispatch. ... 65 Figure 7.7: SOC frequency histogram for V2G and System-Optimal scenarios in 2050. ... 66
xi
List of Tables
Table 2.1: Summary of the carbon dioxide equivalent (CO2) emissions reduction target ... 7
Table 3.1: Powertrain technologies implemented in REMod-D ... 18
Table 4.1: Powertrain technologies cost assumption. ... 26
Table 5.1: Powertrain technologies market share assumption for Germany in 2050 ... 43
Table 5.2: An overview of the scenarios ... 47
Table 7.1: Source of electricity used in charging BEV and the total curtailed electricity under different charging strategies. ... 64
1
Chapter 1
I
NTRODUCTION
Climate change has been a major discussion in the last decades, with predictions of catastrophic consequences if the anthropogenic Greenhouse Gases (GHG) emissions are not reduced [1, p. 13]. To enhance the global effort on counter-balancing these negative effects, the UN introduced a legal instrument to measure the climate effect change. As a result, in 1992 the United Nation Framework Convention on Climate Change (UNFCCC) was established . The perception of these negative effects intensified the interest in a low carbon economy; therefore, many nations pledged to reduce their GHG footprint by signing the Coyote Protocol in 1997 [3, p. 218], and in 2015 by signing the Paris Agreement [4, p. 3]. The major sources of GHG emissions worldwide are from electricity generation and transportation industries [1, p. 47].Fossil fuels are the main cause of anthropogenic CO2
emissions, and 87% of the world´s primary energy is based on fossil fuel [1, p. 47]. The limited fossil fuel reserves, political instability in major oil-exporting countries, and vulnerability to international price shocks has increased the interest in sustainable Renewable Energy Sources (RES).
In electricity systems, supply must closely match demand. Traditionally, this balance is maintained by controlling the output of supply to meet the instantaneous demand load. Therefore, although the RES have the potential to address the GHG emissions, it is non-dispatchable nature presents major challenges for electrical grid operation.
Electric Vehicles (EVs) have the opportunity to reduce the GHG emissions, minimize energy consumption and improve local air quality. However, unless combined with clean environmentally-friendly electricity generation, EVs will not effectively reduce the GHG emissions. Furthermore, a high market penetration of EVs will introduce significant changes in how much electricity is used and when it is used.
2
Despite the fact that electric vehicles are mainly designed to transport people and goods, their electrical storage presents an innovative solution to equalize supply and demand. Vehicle-to-grid (V2G) is an intelligent energy storage technology that enables the flow of electricity between EVs and the electrical grid. This could contribute to reducing the GHG emissions through increasing the utilization of fluctuating RES.
1.1
Problem statement and aim
“How could the transport sector contribute to the GHG emissions reduction targets?”
To answer this broad question more specified research question focusing on the passengers light duty vehicles (PLDVs) were formulated. To achieve GHG emission reduction in road transport a widespread of sustainable technologies in the private road transport and energy sector is needed. Since a diverse pathways and vehicle technologies could contribute to the GHG emissions reduction target form road transport? The following specific research question is addressed
1. Which powertrain technologies and fuel pathways could contribute to achieving the
GHG emissions reduction target?
Furthermore, BEVs are charged while directly connected to the electrical grid. Therefore, the success of high deployment of EVs and non-dispatchable electricity generation will require a significant flexibility in the operation of the electrical grid. Large-scale EV deployment presents both a challenge and an opportunity for the operation of electrical grids. On the one hand, if EV charging occurs during existing demand peaks, the introduced demand will overload the electrical grid. On the other hand, a power system operating on a high share of RES could use the EVs as a flexible load to balance demand and supply. This raises the question
2. How does different EV charging strategies impact the electrical grid and to what extent
could EV charging strategies contribute to the higher integration of renewable energy sources?
1.2
Methodology
Since many of the technologies analyzed in this thesis have not yet been widely deployed, the research questions are mainly intended for future scenarios. Therefore, computer simulation
3
via Renewable Energy Model – Germany (REMod-D) is used to answer the research questions. The work presented in this thesis can be divided into three different steps:
1. Literature review.
The literature review serves to build the test scenarios and set the model input parameters. Therefore, sufficient knowledge of the following topics is needed:
GHG emission sources and technologies used to mitigate the emissions in the transport and energy sector in Germany is described in detail in chapter 2.1.
The current German transport and energy market with respect to the governmental strategies is described in detail in chapters 2.2, 2.3, 2.4.
2. Defining scenarios and specifying the relevant input parameters.
The simulations carried out in this thesis are based on a futuristic transport sector scenarios. Therefore key assumptions for future development of the transport and energy sector have been defined.
3. Developing vehicle profiles and charging strategy.
When considering the EV charging, the key factors that impact the energy system are (a) how many vehicles are charged (vehicle profile), (b) when the vehicles are charged, and (c) how the vehicles are charged (charging strategy).
Vehicle profiles are used to introduce the charging locations based on current mobility patterns. From the profiles the model determines the percentage of vehicles connected to the electrical grid. The German national travel survey (MiD 2008) is used to create the parking patterns. A description of the methodology used to rebuild the trip chains and derive the vehicle profiles is described in detail in chapter 4.2.
4. Simulation and analysis.
Before starting the simulation phase, the development introduced to the transport sector in REMod-D [5] is verified. Then to answer the first research question, the whole solution space on how the transport sector could contribute to the GHG emission reduction targets and what technologies will play a role in decarbonizing the transport sector. Varying the GHG emission reduction target provides a techno-economic and environmental assessment of the technologies. Therefore, to emulate this impact, the GHG reduction target is varied, in the
4
first set of simulations. These simulations are used to present correlations between trends in passenger light-duty vehicles (PLDVs) powertrain technologies, energy carriers, and fuel pathways.
Furthermore, in REMod-D, the deployment of powertrain technologies in the transport sector is coupled with the cost-effectiveness of low carbon energy production. To reduce uncertainties in the result, it is useful to identify the conditions under which change in powertrain technologies optimal composition will occur. Therefore, a sensitivity analysis on the battery price and the Steam Methane Reformation (SMR) efficiency is performed. Therefore, to answer the second research question, the impact of different vehicle profiles is explored. The simulation results from two scenarios—based on different vehicles profiles— are compared. Lastly, the impact of three charging strategies is analyzed. Details related to these strategies are discussed in chapter 5.3.
1.3
Thesis structure
This thesis is structured as follows: Chapter 2 provides the general context of the research. An overview of the GHG emissions sources in Germany, and technologies anticipated to play a central role in the transition toward a low carbon transport sector are discussed. This chapter highlights the motivation behind the research, emphasizing the argument that widespread use of RES and EVs is a needed begin reducing GHG emissions and fossil fuel dependencies. For that reason, it is important to address the challenges and opportunities associated with these technologies. Chapter 3 describes the modeling tool (REMod-D) used in the optimization.
Chapter4 provides an overview of the input parameters relevant to the analysis, and describes
the methodology used to develop vehicle profiles. Chapter 5 introduces the key assumptions for future development of the transport and energy sector and defines the charging strategies. It then describes the selection of the scenarios. Chapter 6 presents the results and analysis obtained from simulating the future scenarios aiming to address the research question
Which powertrain technologies could contribute to achieving the reduction target? Chapter 7 presents the result and analysis used to address the research question.
How does different EV charging strategies impact the electrical grid and to what extent could EV charging strategies contribute to the higher integration of renewable energy sources?
Finally, Chapter 8 draws conclusions about the major findings and pinpoints the direction for future work
6
Chapter 2
B
ACKGROUND
Many nations have identified the dangerous effect of climate change. Therefore in 1992 the UNFCCC was established to address the alarming threats of climate change and enhance global efforts to counter its negative effects. The universal agreement established in the 2015 UN Climate Change Conference in Paris is considered a milestone to this accord. This agreement could create the conditions for transformational change through the reorientation of financial investments away from fossil fuel production generating Greenhouse Gas (GHG) emissions [4, p. 3]. Consequently, the European Union (EU)—with a share of 9.6% of the total global anthropogenic carbon dioxide equivalent (CO2) emissions in 2015 [6, p. 26]—set
an ambitious goal to reduce their share of greenhouse gas emissions by 80-90%, as measured from 1990 to 2050 [7, p. 313]. In response to the 2015 UN Climate Change Conference in Paris, Germany is forging ahead with the “Klimaschutzplan 2050” (translation: Climate protection 2050, in English literature known as Climate Action Plan 2050) the Climate Action Plan specifies GHG emission reduction medium, short and long term reduction targets. Nonetheless the Action Plan does not specify the GHG emissions for the road transport. However other agreements that are binding to Germany specify the GHG emissions and the share of renewable energy in the transport sector. Table 2.1 summarizes the CO2 reduction
7
Table 2.1: Summary of the carbon dioxide equivalent (CO2) emissions reduction target
Energy sector targets Transpo
Year Energy Consumption a GHG emissions a Share of RES Energy Consumption GHG em 2020 climate and energy
package b 2008 EU 2020: -20 % 2020: -20% 2020: 20% --- 2020 10% Energy Roadmap 2050e 2011 EU 2020: -20 % 2030: --- 2040: --- 2050: --- 2020: -25 % 2030: - 40% 2040: -60% 2050: -80% to -95% 2020: 20 % 2030: --- 2040: --- 2050: --- --- 2020 2030 2040 2050 Transport white paper f 2011 EU --- --- --- ---
2020 2050 2030 climate and energy
framework g 2014 EU 2030: -27% 2030: -40% 2030: 27% ---
Federal Emission Control
Act (BImSchG)h 2009 GER --- ---
2017 2020 Energy Concept/
The German Climate Action Plan 2050 2010/ 2016 GER 2020: -20% j 2030: --- 2040: --- 2050: -50% j 2020: -40% 2030: -55% 2040: -70% 2050: -80% to -95% 2020: 18% K 2030: 30% K 2040: 45% K 2050: 60% K 2020: -10%l 2030: --- 2040: --- 2050: -40% l
a with respect to 1990 levels. b COM 2008/ 0030 final. c FQD (EC, 2009b). d RED (EC, 2009a)
e COM/2011/0885 final. f COM/2011/0144 final g COM/2014/00 15 final.
h BImSchG (2009) § 37a I with respect to 2010 levels j with respect to 2008 levels. K of gross electricity consumption.
8
2.1
Greenhouse Gas Emissions (GHG)
In 2015 the total GHG emissions in the European Union (EU-28) were 22% below 1990 level. Germany, Europe’s leading economy, is the highest emission producer in the EU-28 with 926.5 million tons of CO2 accounting for 20.8% of the total European GHG [8].As shown in
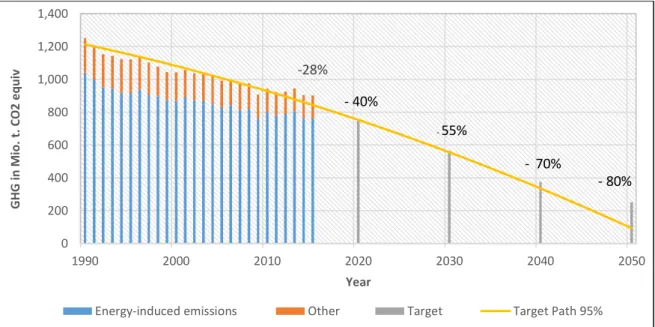
Figure 2.1, by 2016 Germany has achieved 27.6% reduction in the total GHG compared to 1990.
Figure 2.1: Development of GHG in Mio. T CO2 Equiv. based on historical data and
Klimaschutzplan 2050 targets. Germany data from [9, Table (GHG_CO2 eq)].
2.1.1
Sources
According to the Intergovernmental Panel on Climate Change (IPCC), the major source of GHG emissions worldwide are from electricity generation and transportation industries [1]. Figure 2.2 shows the CO2 emission sources in Germany by industry from 1990 forecasted out
until 2050. In 2016, 86% of the CO2 emissions in Germany were energy-related emissions
released from:
1. Power generation;
2. Fuel combustion in the transport sector; and,
3. Heat supply for both industrial and residential sectors.
-28% 0 200 400 600 800 1,000 1,200 1,400 1990 2000 2010 2020 2030 2040 2050 G H G i n M io . t. C O 2 e q u iv Year
Energy-induced emissions Other Target Target Path 95%
- 40%
-55%
- 70%
9
The highest increase in CO2 emissions occurred in the road transport sector, amounting to a
5.4 million ton increase in CO2 emissions compared to 2015 (+3.4%). That is almost 2 million
tons of CO2 higher than the reference year (1990). As a result, the transport sector became the
second largest emissions producer and the only industry that did not achieve any reduction in the CO2.
Figure 2.2: GHG emissions by sector from 1990-2015 data from [9, Table (GHG_CO2 eq)], and reduction target based on [10, 11].
2.1.2
Mitigation
It is extremely likely that human activities are the prominent factors influencing the climate system [1]. While some climate change impacts are inevitable, it is possible to minimize risk through a significant reduction in CO2 emissions. This reduction, however, will require a wide
range of changes to both technologies and human behavior [1, 12]. This section presents a selection of technologies developed to reduce the transport sector’s CO2 emissions. The IPCC defined the approaches used to mitigate CO2 emissions into four main categories:
1. Move towards low-carbon energy sources;
2. Increase energy efficiency (including conservation); 3. The use of carbon sinks; and,
10
Mitigation efforts related to road transportation falls within the first two approaches. Low-carbon energy sources—such as electricity, hydrogen fuel cell, and locally-produced biofuels—have been introduced. For biofuels, the conventional production technologies have the barrier of limited supply and competition with food resource, as well as have a negative impact on the land use [13]. EVs offer opportunities to reduce the CO2 emissions, energy
consumption, and local air quality. However, unless powered by Renewable Energy Sources (RES), the EVs will not reduce the GHG emissions significantly. Rather, the source of CO2
emissions will be shifted from vehicles to electricity generation plants. Therefore, effective mitigation of CO2 in the transport sector must take the entire fuel pathway into consideration.
2.2
Energy
The transport sector accounted for 29% of the Final Energy Consumption (FEC) in Germany in 2016 producing 25% of the total CO2 emissions (Figure 2.3 [14, Table 5]). The EU
Renewable Energy action plan obliges EU Member States to increase the use of Renewable Energy Sources (RES) by at least 10% in the transport sector by 2020[15, p. 10].However, in 2015, more than 94% of the final energy consumption in the transport sector was covered by fossil fuels [14, Table 6a].
Figure 2.3: Final energy consumption in Germany by sector in 2016 [14, Table 5].
Renewable energy is obtained from sources that are continually reloaded by nature, including solar Photovoltaic systems (PV), wind turbines onshore and offshore, hydroelectricity, biomass, geothermal, and tidal generation [16]. However, for most RESs, the availability of power cannot be controlled. At a high penetration level, the output variability of RESs creates difficulties for network stability.
Transport 29% Industry 29% Households 26% Services 16% Transport Industry Households Services
11
In electricity generation, security of supply could be defined according to the timescale; in the meantime, the challenge is generating a sufficient capacity to cover the instantaneous load induced by EVs (load balancing). In the long-term, the main concern is ensuring sufficient capacity capable of covering the network-wide energy demand. Therefore, due to the non-dispatching nature of RES, guaranteeing the security of electricity supply becomes more complicated. Consequently, it is essential for an energy system that is mainly dependent on RES to be combined with an energy storage system
2.3
Electric vehicles (EVs)
Electric Vehicles (EVs) include Battery-Electric vehicles (BEVs), Plug-in Hybrid Electric vehicles (PHEVs), and Fuel Cell Electric vehicles (FCEVs) [1, 16]. Although the first mass production of EVs started in 1899, EVs have been almost unnoticeable on the streets since fading in competition with Internal Combustion Engines vehicles (ICEVs). In recent years, BEVs and PHEV have gained popularity; in January 2017, the cumulative global electric vehicle sales reached the two Million Euro, with over 750 thousand sales worldwide [17, p. 5].
BEVs and FCEVs have no carbon emissions in the end use phase known as Tank-to-Wheel (TTW). Nevertheless, the entire emission chain Well-to-Wheel (WTW) for BEV and FCEVs can vary considerably based on the primary energy source used in the electricity or hydrogen generation (Well-to-Tank (WTT)).
Barriers to wide acceptance of EVs are directly attributed to their electrical energy storage system characteristics. The current storage system results in a higher purchasing price compared to ICEVs. Another concern for drivers is the limited driving range, known in the literature as “range anxiety”, which is the fear of not being able to complete a trip without running out of stored electricity. This fear is mainly due to the long recharging periods and the limited charging facilities [18, 19]
The EV charging methods vary based on ownership, charging power, duration and location. Most of them occur while connected to the electrical grid except for FCEV and battery swapping. In Germany, the EVs can be charged at the distribution grid voltage level (230 V and 16 A) or at the 3 phase level (400 V and 16 A).
High penetration of EVs will introduce significant changes in how much electricity is used and when it is used. There is a strong agreement within the energy industry, and among researchers that widespread deployment of EVs should be combined with coordinated or
12
controlled charging [1, 17, 20–22]. Studies have confirmed that a high penetration rate of EVs combined with an appropriate charging strategy could present significant benefits such as:
1. Load Smoothing (through increasing baseload utilization) [23];
2. Increase the integration of RES [24]; and,
3. Balancing supply and demand (Demand Response DR) [23].
The benefits are further recognized when vehicles are enabled to discharge power stored in the batteries back into the electrical grid when needed through a process known as
Vehicle-to-grid (V2G). Vehicle to Grid (V2G) is defined as “a two-way connection through which
power can flow from the electrical grid to a vehicle and from a vehicle back to the electrical grid” [23].
2.4
German vehicle fleet
Road transport dominates the transport sector in Germany, 80% of all trips are done by motorized private transport [25, pp. 224-225]. In January 2017 the total number of Passenger Light-Duty Vehicles (PLDVs) nearly reached 46 million vehicles, which is almost 50% more than 1990. The vast majority of the German PLDVs remain powered by gasoline or diesel (the market share of EVs is 0.12% (Figure 2.4)). In January 2017, the number of BEVs reached 34,022 vehicles, an increase of 33% compared to 2016, and a total cumulative BEV and PHEV of 55,000 vehicles [26, p. 10]. The majority of the PLDVs are privately registered (89.5%), yet 55% of BEVs are commercially registered [26, pp. 14-15]. The average age of the PLDVs stock is 9.3 years [27, pp. 6-7].
Germany is way behind its ambitious target of achieving one million EVs by the year 2020 and at least 6 million by 2030 [28, p. 10]. The incentive scheme for EVs introduced by the German government—in cooperation with the automobile industry—is expected to stimulate the German EV market. The new allocation of 1.2 billion Euros narrows the gap in subsidies provided for EVs between Germany and other European countries. The plan is expected to subsidize 300,000 EVs with € 4,000 for each BEV or FCEV and € 3,000 for PHEV [29, p. 2].
Furthermore, the plan allocates € 300 Mio. to infrastructure development, in which two-thirds
of the fund will be used to subsidize fast-charging infrastructure. This plan is expected to enable the construction of up to 2,500 fast-charging stations between 2017 and 2020 [30, p. 1].
13
Figure 2.4: German vehicle fleet composition for private passenger light-duty vehicles [26]. In summary, this chapter provided the motivation for research related to the decarbonizing the transport sector in Germany. The Renewable Energy Model—Germany (REMod-D)—is used to provide an overview of the technologies that are more likely to play role in a future transport and energy sector scenarios. The next chapter introduces the simulation-based optimization model used to answer the research questions.
0% 10% 20% 30% 40% 50% 60% 70% 80% 90% 100% 2 0 0 7 2 0 0 8 2 0 0 9 2 0 1 0 2 0 1 1 2 0 1 2 2 0 1 3 2 0 1 4 2 0 1 5 2 0 1 6 2 0 1 7 S h ar e of th e toal n u m b er of ve h icl es Year
14
Chapter 3
R
ENEWABLE
E
NERGY
M
ODEL
–
G
ERMANY
(REM
OD
-D)
REMod-D is the main simulation and optimization tool used to answer the research questions in this master thesis. The model was developed by the Fraunhofer Institute for Solar
Energy Systems (ISE) to understand, analyze, and predict the national energy system
transformation toward carbon-low economy by 2050. The optimization objective is to identify an optimal combination of demand- and supply technologies that minimize the total cost. The optimal solution must guarantee the security of energy supply without exceeding the maximum allowed CO2 emission per year. [31–38]
REMod-D is a bottom-up energy system optimization model describing the whole German energy system (including sectors: electricity, heating, mobility, and industrial process heat).
The core feature in REMod-D is the ability to optimize all sectors of the energy system simultaneously. Therefore, the model captures the interactions across all incorporated sectors. Furthermore, the model parameters allow the specification of different developmental characteristics for specific technologies. These characteristics include the maximum and minimum expansion limits, which may be set based on technical characteristics such as time needed to build a power plant or based on pre-defined political targets [31–38].
Consequently, the model serves as a support tool to guide decision makers and local stakeholders in developing sustainable policies and investments. REMod-D is currently used in different research projects to understand the interdependencies among different energy sectors and identify feasible and reliable transformation paths, such as Integrated Energy Concept 2050 (IEK) [39].
15
3.1
Model Components
A broad spectrum of energy supply, storage, and demand technologies are implemented in the model. Each technology has detailed technical parameters related to efficiencies (learning curves), lifetime, emission factors, and effectiveness (availability). Moreover, each technology has its own associated costs (e.g., investment cost, operation, maintenance cost, and discount rates). Generally, technical parameters and costs are exogenous forecasts, in the form of development curves drawn from several ranges of sources (e.g., studies, industrial partners, and experts) [31, pp. 210-230].
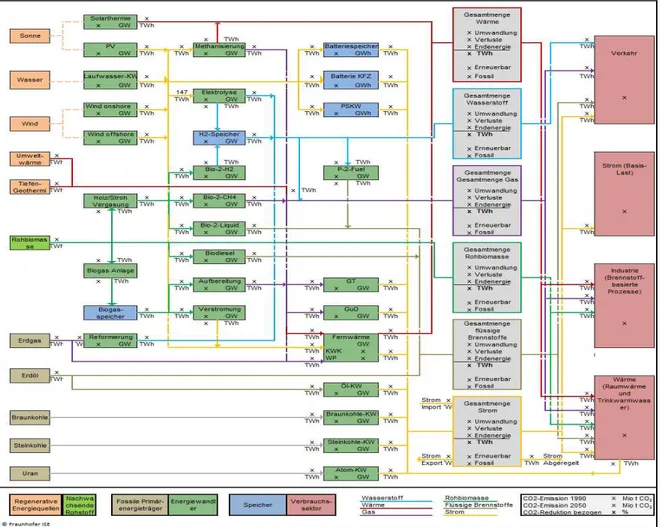
Figure 3.1 shows a schematic for some of the most relevant technologies used in the energy conversion pathways from supply to demand. The right side of Figure 3.1 shows the energy supply. The energy supply can be generated from conventional power plants and renewable energy sources. Conventional power plants included in the model are:
Nuclear power plants;
Power plants operating by lignite, hard coal;
Oil-fired power plants;
Gas turbines;
Combined heat and power plants (CHP); and,
Gas-fired and steam power plants. Renewable energy can be generated using:
Hydropower plants;
Wind turbines onshore and offshore;
Photovoltaic systems (PV); and,
Biomass.
Excess electricity can be stored in a chemical form using:
Batteries; and,
Synthetic fuels.
Or in a mechanical form such as: Pumped-storage power plants
16
Figure 3.1: Scheme of the energy system as presented in the REMod-D. The schematic shows some of the most relevant conversion pathways of fossil primary energy and/or renewable energies up to the respective consumption sector [31, p. 16].
The left side of Figure 3.1 shows the energy demand. Energy demand is divided into four main sectors:
1. Electricity
The electricity demand (load) (� �� ) at time t is given by the sum of all existing electricity consumers, including electrical demand for Passenger Light-Duty Vehicles (PLDVs) and Heavy-Duty Vehicles (HDVs) (��� � ) (Equation 1). The base load (�� � � � ) is derived from load profiles from the European Transmission System Operator (TSO) data, which includes the electricity demand for rail transport, air conditioners, and industrial processes. [31, p. 23]
17
��� = �� � � � + �� �+ �� ℎ � + ��� �+ �� 2
Equation 1 [31, p. 24]
2. Industrial process heat
Industrial process heat is considered in the model as a constant hourly load. The energy demand is based on a forecast of industrial energy demand.
3. Heating:
The heating sector in the model is represented by residential buildings, non-residential buildings, and industrial buildings. All of which can be heated using 18 possible heat supply technologies with centralized or decentralized supplies. The model calculates the necessary loads for heat pumps and geothermal plants endogenously.
4. Mobility
In the model, the mobility sector is represented in detail through:
Rail transport,
Air transport,
Inland navigation, and
Road transport.
The energy demand for rail transport, air transport and inland navigation are specified
exogenously and fulfilled on a yearly basis. Therefore, technologies in rail transport, air
transport and inland navigation are not subjected to the optimization. Since there is no alternative for fuel engines in the air transport sector. It is assumed that liquid fuels are the only possible energy carrier.
Where:
�� � � � : Electric power demand for base load.
�� �: Electric power demand for a Heat pump. �� ℎ � : Electric power demand deep geothermal.
��� �: Electric power demand for road transport (PLDVs and HDV).
18
The energy demand for road transport is determined endogenously on an hourly basis. Different powertrain technologies have different efficiency, therefore the emissions and fuel consumption are not determined by the number of vehicles, but by their performance. As a result, different weighting factors and functions are used to calculate the resulting power distribution. This power distribution is called fleet composition (market share).
In road transport, demand is separated among different types of vehicles (PLDV, HDVs, and buses). For PLDVs and HDVs, the powertrain technologies described in Table 3.1 compete to fulfill the road transport’s energy demand. The model calculates an “optimal transport
sector configuration” by minimizing the cost while subject to the imposed constraints
Table 3.1: Powertrain technologies implemented in REMod-D
3.2
Operational management of the power system
Before beginning to explain the power system operation in the REMod-D, some common terms that will be used throughout this thesis will be defined. The term non-dispatchable refers to electricity sources that cannot supply the electrical grid according to the market need [40]. In REMod-D this is used for the intermittent renewable energy sources and electrical energy generators that cannot be controlled (turned on or off), such as nuclear power plants and wind turbines (Equation 2) [31, p. 24].
��p = ��� �� + �� ℎ + �� ℎ + ��� + ��� � + �� � + ����� . �� � + ����� . ����
Equation 2
VEHICLE NAME (ABBREVIATION) FUELS
Internal Combustion Engine (ICEFuel) Fossil fuel (petrol or diesel) Internal Combustion Engine (ICEGas), Natural gas
Battery electric vehicle (BEV) Electricity Fuel Plug-in-hybrids (PHEVFuel) Electricity /Fuel Gas Plug-in-hybrids (PHEVGas) Electricity/ Gas Hydrogen Fuel cell electric vehicle(FCEV) Compressed hydrogen
19
The residual load often refers to the difference between the actual grid power demand and the feed-in of non-dispatchable generators (Equation 3) [31, p. 24]. A negative residual load occurs when the non-dispatchable electrical supply not only covers the electrical demand but also provides electricity surplus (excess supply). A positive residual load occurs when the non-dispatchable electricity generation is less than the total current demand (electricity deficiency) [31, 41].
� � � � = �� � − ���
Equation 3
REMod-D is based on a principal idea that the energy supply must fulfill the energy demand. The energy supply could either be used directly or stored. The stored energy is accessible for all sectors. Ideally, the demand is to be fulfilled through the direct use of RES. If the system is not capable of fulfilling the demand by means of the direct use of RES, the demand is fulfilled based on operational management strategy. The operational management of the power system specifies the power plants order of use. The plan is specified exogenously, this
Where:
��� ��: Electric power from Run-of-the-river power plants �� ℎ : Electric power from Wind offshore turbine
�� ℎ : Electric power from Wind onshore turbine ��� : Electric power from Photovoltaic
��� �: Electric power from Combined Heat and Power (CHP) �� � : Electric power from the Nuclear power plant
����� : Factor determining a minimum load of lignite-fired power plants �� �: Electric power from lignite-fired power plants
����� : Factor determining a minimum load of coal-fired power plants ����: Electric power from the coal-fired power plant
Where:
��� : Residual load �� � : Electric power load
20
means that the power plants order of use is not subjected to optimization. Through this approach, it is possible to reduce the computational effort.
Current German operational management of the power system is based on a pricing merit order. This means that all sources generating electricity are ranked according to their costs, and sources with the lowest cost will be the first dispatched to the network. However, in REMod-D, the sequence of operation aims to minimize CO2 emissions. Consequently, the
sequence follows the path from the highest energy efficiency at lowest CO2 emissions to
highest CO2 emissions. Figure 3.2 shows the operation sequence of the energy management
strategy in the case of electricity surplus and electricity deficiency. A brief explanation of the sequence is given in previous model publications [31–38].
21
3.3
Simulation
Mathematic equations are used to describe the energy system interactions and relations among various technologies. A simulation-based optimization strategy is used to identify the optimal solution, which means that the problem is solved iteratively, and each consecutive iteration moves closer to an optimal solution. Particle Swarm Optimization (PSO) algorithm is programmed in the model to identify the optimal energy system configuration. The algorithm target is to optimize the capacities of all supply, demand, and storage technologies. An hourly simulation is carried out to ensure that the optimal solution guarantees the security of the supply.
REMod-D has two submodules:
REMod-D-JahrSim.
In JahrSim, the target year optimal solution is identified using an hourly energy system simulation. This module serves as the essential element for ensuring that energy balances are fulfilled without exceeding the defined CO2 emission reduction target. The result is the
optimal energy system for the target year
REMod-D-TRANS
REMod-D-TRANS is a module that is used to optimize the transformation from the current infrastructure to the target system. The results present how today’s infrastructure could be transformed into the infrastructure required to facilitate the optimal solution.
The simulation carried out in this thesis used only JahrSim module. Therefore, in the
following, only REMod-D-JahrSim is described. A detailed description of the simulation process can be found in previous publications, such as References [31, pp. 17-29, 35, pp. 16-24].
Using only JahrSim means that the optimal solution determines the optimal technologies
composition in all sectors regardless of the current system infrastructure. However, the
optimal solution is constrained within realistic technological development characteristics defined by a maximum and minimum potential expansion limit for PVs in Germany.
The main advantage of this modeling approach is the significant reduction in required computational effort; reducing the runtime from at least 38 hours to 8 hours allowed for a
22
higher number of simulations. The increased number of results is beneficial for validating and analyzing the developments in [5, 5].
In the first step of optimizing the target year system, the input variables—such as the technology’s technical parameters and development characteristics, load profiles, building characteristics, mobility parameters, and weather data—are imported into the main memory of the program in the form of tables.
The second step is based on stochastic simulation of a random solution matrix, created via a Monte Carlo algorithm. The matrix solution is passed to an annual simulation in which hour-by-hour simulations are carried out. If the solution guarantees the security of supply for all demand sectors, the total cost of the simulation result is calculated. Exceeding the CO2
emissions limit leads to a penalty function which results in an increase in total cost. The iteration result is passed to the PSO optimization, and the procedure is repeated until the optimal solution is identified
3.4
Model development
In previous versions of REMod-D, the energy demand for the road transport sector is assumed to be constant. However, regular daily charging is expected for BEVs, where the vehicles are charged while connected to the electrical grid. Accordingly, the total amount of energy consumed will vary depending on the distribution of the vehicles during the day.
In [5], road transport in REMod-D is developed, to analyze how the transport sector could contribute to balancing the variable RES in Germany. As a result, the hourly number of vehicles connected to the electrical grid, the energy demand, and the maximum and minimum battery capacity of the fleet are introduced as mathematical functions dependent on the number of vehicles arriving to and departing from a charging facility, as well as their State Of Charge (SOC). SOC is the ratio of available energy in the BEV fleet batteries and the maximum storable energy in the fleet battery.
Depending on the residual load and SOC, the algorithm decides how the transport sector may contribute to balancing the RES. During times of negative residual load (electricity surplus), the algorithm charges the vehicles, thus utilizing the RES. Alternatively, during times of positive residual load (electricity deficiency), the algorithm provides an opportunity for the transport sector to support the power system by feeding electricity stored in the EV back to the electrical grid in a process known as V2G
23
However, preventing EVs from charging using conventional power generation might lead to a situation where the EVs exhaust their electricity and cannot be charged. To guarantee the mobility of each EV’s user, the (Must-Charge) variable is exogenously defined. Must-Charge is a minimum SOC below which charging the EVs occurs regardless of the residual load. This limit is referred to as a (Must-Charge). To illustrate this, if Must-Charge is set at 40%, then
when the EV’s SOC is below 40%, the algorithm will charge the vehicle regardless of the
electricity source used. However, if the EV’s SOC is above 40%, the vehicles will not be charged unless there is surplus electricity generated from RES.
Furthermore, to avoid using the entire electricity capacity of the EV to support a deficient grid power supply, a (flexibility-limit) variable is exogenously defined. This flexibility-limit refers to a minimum SOC, below which discharging electricity from vehicles to the electrical grid is not permitted. For example, if the flexibility limit is defined as 80%, the EV will only discharge electricity to the electrical grid when the SOC is above 80%.
The number of vehicles connected to the electrical grid at time t is a function of the number of vehicles arriving at or departing from a charging facility (Equation 4). The charging facility is defined as a location in which charging infrastructure is available, such as home or work. The number of vehicles arriving at or departing from a charging facility, their SOC, and the Type/Location of charging facility is defined exogenously through the Vehicle Profile (VP) The VP defines the main input parameters for the algorithm used to identify the number of vehicles connected to the electrical grid. In this thesis research, an appropriate VP is developed. The VP will be discussed in detail in the following chapter
�� = ��− + ��− ��
Equation 4
This chapter provided an overview of the simulation-based optimization model (REMod-D). Understanding the simulation and optimization process is essential for explaining the result. In the following chapter, relevant input parameters for the model are briefly described.
where:
��: Number of vehicles connected to the electrical grid at time t
��: Number of vehicles arriving to charging facility at time t (Ending a trip) ��: Number of vehicles departing from a charging facility at time t (Starting a trip)
24
Chapter 4
I
NPUT PARAMETERS
In REMod-D, mathematical equations with more than 2000 independent input variables are used to describe the interactions and relations among various technologies. In this chapter, only the relevant parameters investigated within this thesis are discussed. Other parameters are set based on previous research projects and expert opinions. A more detailed description of all the input parameters can be found in the previous publications [31, 33–38].
4.1
Vehicle cost
It is important to make a clear distinction between the current vehicle cost and the future vehicle cost. For all of the technologies, the future costs assume mass production and wide deployment of vehicles. In the literature, some studies estimate future costs based on technical targets that are derived from roadmaps. One such study, the JRC study [42], provides cost data for a specific component of different powertrain technologies. Other studies derive the costs from learning curves combined with deployment scenarios (e.g., IEA [20], which provides detailed costs for FCEV).
A full calculation of the vehicle costs is not within the scope of this master thesis; however, there is a need to modify the cost of vehicles (mainly BEV) based on the assumptions made in this thesis considering the battery size and features (e.g. V2G).To estimate the vehicle cost, the average costs from several studies [20, 42–46] are adjusted to conform with the battery assumption. For the rest of the implemented powertrain technologies, the average costs from several studies are used [20, 42–46].
The McKinsey report [44] and the Cambridge Econometrics [43] are used as the main resources to derive costs for powertrain technologies. Since both reports do not conform to the feature of the powertrain technologies implemented in REMod-D (Table 3.1), the costs had to be modified. The McKinsey report could be considered a reliable estimate as it uses industry data, while Cambridge Econometrics is built from series of several studies. The capital cost of each vehicle is derived by combining projections of the:
25
1. Fuel storage and system cost (Charger, battery, fuel tanks);
2. Powertrain cost (engines, fuel cells, regenerative breaks, transmission); 3. Glider cost (wheels, vehicle body, interior etc.); and,
4. Manufacturing and assembly cost.
Glider cost, manufacturing and assembly costs, and fixed and variable operational cost are not modified, while fuel storage and powertrain costs are adjusted. A key input for calculating the BEV cost is the battery pack size, measured in kWh. The first step in estimating the vehicle cost is identifying a reasonable battery size for all vehicles in Germany in 2050. Consequently, the 38 BEVs available for mass production in the German market are analyzed. The analysis reveals that there is substantial diversity in price, range, and battery size. Figure 4.1 suggests that the next generation BEVs will continue to increase in battery size. Given that the increase in battery size will subsequently increase range, this characteristic could also attribute to greater user acceptance of the BEV. An example of this can be seen in the Volkswagen e-Golf: the first-generation model contained a battery pack size of 35.8 kWh, while the second generation increased the size to 48 kWh. The same trend was seen for the Nissan leaf model: 24 kWh to 30 kWh. Furthermore, manufacturers are providing multiple battery configurations to encourage a trade-off between price and range.
Figure 4.1: Official driving range under New European Driving Cycle (NEDC) for BEV introduced in the German market (2010-2017). The circle size represents the battery size. According to the Cambridge Econometrics, the BEV market could be segmented into three categories of small with 45kWh, medium 60 kWh and large with 92 kWh [43, p. 29]. Therefore,
0 50 100 150 200 250 300 350 400 450 500 550 600 650 700 2009 2010 2011 2012 2013 2014 2015 2016 2017 2018 2019 2020 Dr iv in g ran ge in k m Production year
26
via a simple weighted average based on 2016 German vehicle stock segments relative to engine size, an average battery size is identified as 58 kWh.
Cambridge Econometrics uses two methodologies to calculate the battery cost based on Manufacturer announcements and bottom-up modeling techniques [43, p. 31]. An average of both methods used by Cambridge Econometrics has been calculated. On average, the price will fall from €182/kWh in 2020 to €122/kWh in 2030, reaching €78/kWh by 2050. Furthermore, in literature, it is only stated that more advanced battery technology is needed for the realization of V2G, yet no estimation has been found. Consequently, a 5% increase in the battery cost projection from Cambridge Econometrics (€82/kWh) is assumed to account for this uncertainty. The resulting price is within McKinsey report.
The Cambridge Econometrics forecasts the electric powertrain costs for medium size engine BEV will decrease from €1914 in 2020 to €1527 in 2050 (about €14/kW) [43, p. 34]. The McKinsey report predicts about an €18/kW decrease [44, p. 35]. An average of both studies has been used. The powertrain size ranges from 60 to 150; therefore, a weighted average based on 2016 German vehicle stock segments relative to engine size is used to determine the average vehicle motor size. The average size is identified as 106 kW. Additionally, although both reports discuss the V2G economic benefits, estimated costs are not stated. The hardware and software costs for V2G are estimated to be around €400 [47]. For the calculation, it is assumed that the V2G technology will progress at the same rate as the powertrain, thus the
price decreases using the same rate reaching €320 by 2050
Table 4.1.
Table 4.1: Powertrain technologies cost assumption.
powertrain technology Price 2017 Price 2050 Internal Combustion Engine (ICE Fuel) €26,970 €25,418 Internal Combustion Engine (ICE Gas) €26,952 €25,837 Battery electric vehicle (BEV) €57,450 €28,924 Fuel Plug-in-hybrids (PHEV Fuel) €27,989 €26,742 Gas Plug-in-hybrids (PHEV Gas) €31,599 €27,782 Hydrogen Fuel cell electric vehicle(FCEV) €77,599 €30,466 FCEV Plug-in-hybrids (PHEV/FCEV) €110,857 €31,975 powertrain technology Price 2017 Price 2050 Internal Combustion Engine (ICE Fuel) €26,970 €25,418 Internal Combustion Engine (ICE Gas) €26,952 €25,837 Battery electric vehicle (BEV) €57,450 €28,924 Fuel Plug-in-hybrids (PHEV Fuel) €27,989 €26,742 Gas Plug-in-hybrids (PHEV Gas) €31,599 €27,782 Hydrogen Fuel cell electric vehicle(FCEV) €77,599 €30,466 FCEV Plug-in-hybrids (PHEV/FCEV) €110,857 €31,975
27
4.2
Vehicles profile
Personal mobility has evolved substantially with the rapid development of road motorization [48]. In developed countries, transport policies have facilitated efficient and safe movement of persons and goods. Within this process, ICEVs played a significant role in satisfying the mobility needs for individuals. However, this increase in Motorized Private Transport (MPT) has also resulted in undesired effects, such as congestion and pollution [1].
One method used to reduce the GHG—while maintaining the competitiveness of the transport sector—is to shift from the conventional ICEVs toward zero local emission vehicles [1, 49]. EVs are being promoted worldwide as a suitable powertrain technology that could replace ICEVs [15, 50–52]. Operational characteristics of EVs are different compared to conventional ICEVs vehicles, mainly in driving range, refilling location, and refilling duration [53, 54]. The refilling process of EVs will depend on the location and time of charging. The usage patterns of EVs—or so-called “Vehicle Profiles (VP)”—could be used to evaluate the impact of road transport electrification on the energy system. This chapter provides an overview of the data used to derive these vehicle profiles.
Studies on the electrification of road transport differ in the data they use to derive vehicle movement patterns. Various studies use publicly available national or regional travel surveys. For example in [55], the National Travel Surveys (NTS) of six European countries (Germany, Spain, France, Italy, Poland, and the United Kingdom) is used to derive electric vehicle load profiles. In the EVREST project, the national survey for Germany and France are used to analyze Extended Range Electric Vehicles (EREV) as a solution contributing to electromobility [56]. However, these data are self-reported; consequently, the travel times could be under- or overestimated and some trips might not be reported. Furthermore, the surveys track the movement of the person, not the vehicle.
Other studies use GPS-based travel data to capture the vehicle movement patterns. The VLOTTE project in Austria provides GPS data and charring data for 40 commercially registered vehicles [57]. In [58], GPS data from three electro mobility studies (Get eReady, iZEUS, and CROME ) are used to simulate EVs’ synthetic electric load. The data include continuous measurements of the SOC, as well as the time period in which the vehicle was parked. However, the data lack explicit information on trip purpose (e.g., working, education, leisure, etc.), which is often available in travel surveys. Nonetheless, this can, to some extent, be derived from the GPS data. The authors inferred that many vehicle users involved in the project likely had high incomes and more than one vehicle [58]. Therefore, these EV drivers are not representative of all car drivers. Vehicle profiles based on GPS travel data—from
28
current projects such as [57, 58]—are not appropriate for national level studies because the sample size is small and not representative. Furthermore, access to such databases is limited. Combining both longitudinal GPS and existing mobility surveys that capture both car use and mobility patterns overcomes the weaknesses of each method. In the research project Smart Electric Mobility (SEM), profiles are derived from at least three-week car-based GPS survey combined with a questionnaire to analyze the daily trip range and charging opportunities [59]. However, such data is currently only available for a small sample size in SEM (33 participants) and are usually for early adopters. Such GPS data for an entire household fleet could compensate for the missing data from the mobility surveys, such as SOC and driver behavior. For this master thesis, it was not possible to obtain appropriate GPS data—restricted by both the available sample size of GPS data and the limited access to these data—therefore, the latest available German National Travel Survey (NTS) is used to derive vehicle profiles.
4.2.1
German National Travel Survey (NTS)
The NTS is based on a series of household surveys designed to provide representative and consistent information on the mobility behavior of the German population [60]. The data are used by decision makers and researchers to capture realistic pictures of mobility behavior and show the change in travel behavior over time. The surveys are commissioned by the German Federal Ministry of Transport and Digital Infrastructure (BMVI).
“Kontinuierliche Erhebungen zum Verkehrsverhalten (KONTIV)” is the oldest nationwide
cross-sectional study of everyday individual mobility behavior [61]. The denotation KONTIV was changed to Mobility in Germany (MiD) after the German reunion. The survey is performed irregularly, every 6-8 years (KONTIV 1976, 1982, 1989; MiD 2002, 2008, 2017). The German Mobility Panel (MOP) is a longitudinal-sectional panel survey, used to collect information on everyday household (HH) mobility behavior [62].
In terms of sample size, the MiD 2008 combines data from 25,922 HH and 60,713 participants, while the sample size of the MOP is approximately 1,100 HH Figure 4.2 [63, 64]. In the MiD, all HH members are asked to report all their trips for a single reference day; the reporting days are assigned evenly throughout the survey year, thus covering weekends and all seasons. In the MOP, participants report their trips for seven consecutive days in autumn and in 8 weeks of spring; in this survey, their vehicle odometer readings are reported.

![Figure 2.2: GHG emissions by sector from 1990-2015 data from [9, Table (GHG_CO2 eq)], and reduction target based on [10, 11]](https://thumb-eu.123doks.com/thumbv2/5dokorg/5524018.144140/23.892.110.772.327.700/figure-ghg-emissions-sector-table-reduction-target-based.webp)
![Figure 2.4: German vehicle fleet composition for private passenger light-duty vehicles [26]](https://thumb-eu.123doks.com/thumbv2/5dokorg/5524018.144140/27.892.109.766.184.557/figure-german-vehicle-fleet-composition-private-passenger-vehicles.webp)
![Figure 3.2 Energy management strategy in REMod-D [31, p. 25].](https://thumb-eu.123doks.com/thumbv2/5dokorg/5524018.144140/34.892.119.776.471.1006/figure-energy-management-strategy-remod-d-p.webp)

![Figure 4.2: Comparison between German surveys MOP, KONTIV and MIV [64].](https://thumb-eu.123doks.com/thumbv2/5dokorg/5524018.144140/43.892.109.765.256.627/figure-comparison-between-german-surveys-mop-kontiv-miv.webp)


