Brain, Behavior, and Immunity
journal homepage:www.elsevier.com/locate/ybrbiBrain glial activation in fibromyalgia – A multi-site positron emission
tomography investigation
Daniel S. Albrecht
a,1, Anton Forsberg
b,1, Angelica Sandström
c,d, Courtney Bergan
a,
Diana Kadetoff
c,d,e, Ekaterina Protsenko
a, Jon Lampa
f, Yvonne C. Lee
g,h,
Caroline Olgart Höglund
i, Ciprian Catana
a, Simon Cervenka
b, Oluwaseun Akeju
j,
Mats Lekander
c,d,k, George Cohen
l, Christer Halldin
b, Norman Taylor
j, Minhae Kim
l,
Jacob M. Hooker
l, Robert R. Edwards
m, Vitaly Napadow
a,m, Eva Kosek
c,d,e,⁎,2, Marco L. Loggia
a,⁎,2 aA. A. Martinos Center for Biomedical Imaging, Department of Radiology, Massachusetts General Hospital, Harvard Medical School, Boston, MA, United States bDepartment of Clinical Neuroscience, Center for Psychiatry Research, Karolinska Institutet, and Stockholm County Council, SE-171 76 Stockholm, Sweden cDepartment of Clinical Neuroscience, Karolinska Institutet, Stockholm, SwedendDepartment of Neuroradiology, Karolinska University Hospital, Stockholm, Sweden eStockholm Spine Center, Stockholm, Sweden
fRheumatology Unit, Department of Medicine, Karolinska Institutet, Karolinska University Hospital, Stockholm, Sweden gDivision of Rheumatology, Brigham and Women’s Hospital, Harvard Medical School, Boston, MA, United States hDivision of Rheumatology, Northwestern University Feinberg School of Medicine, Chicago, IL, United States iDepartment of Physiology and Pharmacology, Karolinska Institutet, Stockholm, Sweden
jDepartment of Anesthesia, Critical Care and Pain Medicine, Massachusetts General Hospital, Harvard Medical School, Boston, MA, United States kStress Research Institute, Stockholm University, Stockholm, Sweden
lDepartment of Rheumatology, Massachusetts General Hospital, Harvard Medical School, Boston, MA, United States mDepartment of Anesthesiology, Brigham and Women’s Hospital, Harvard Medical School, Boston, MA, United States
A R T I C L E I N F O
Keywords:
Fibromyalgia
Positron emission tomography Neuroinflammation Microglia Astrocytes Functional pain TSPO
Chronic overlapping pain conditions Neuroimmunology
MRI/PET Deprenyl-D2
A B S T R A C T
Fibromyalgia (FM) is a poorly understood chronic condition characterized by widespread musculoskeletal pain, fatigue, and cognitive difficulties. While mounting evidence suggests a role for neuroinflammation, no study has directly provided evidence of brain glial activation in FM. In this study, we conducted a Positron Emission Tomography (PET) study using [11C]PBR28, which binds to the translocator protein (TSPO), a protein
upre-gulated in activated microglia and astrocytes. To enhance statistical power and generalizability, we combined datasets collected independently at two separate institutions (Massachusetts General Hospital [MGH] and Karolinska Institutet [KI]). In an attempt to disentangle the contributions of different glial cell types to FM, a smaller sample was scanned at KI with [11
C]-L-deprenyl-D2PET, thought to primarily reflect astrocytic (but not
microglial) signal.
Thirty-one FM patients and 27 healthy controls (HC) were examined using [11C]PBR28 PET. 11 FM patients
and 11 HC were scanned using [11
C]-L-deprenyl-D2PET. Standardized uptake values normalized by occipital
cortex signal (SUVR) and distribution volume (VT) were computed from the [11C]PBR28 data. [11C]-L
-deprenyl-D2was quantified using λ k3. PET imaging metrics were compared across groups, and when differing across
groups, against clinical variables.
Compared to HC, FM patients demonstrated widespread cortical elevations, and no decreases, in [11C]PBR28 VTand SUVR, most pronounced in the medial and lateral walls of the frontal and parietal lobes. No regions
https://doi.org/10.1016/j.bbi.2018.09.018
Received 27 June 2018; Received in revised form 31 August 2018; Accepted 13 September 2018
⁎Corresponding authors at: A. A. Martinos Center for Biomedical Imaging, Massachusetts General Hospital, 149 Thirteenth Street, Room 2301, Charlestown, MA
02129, United States (M.L. Loggia). Department of Clinical Neuroscience, Karolinska Institutet, Nobels väg 9, 171 77 Stockholm, Sweden (E. Kosek).
1Co-first author. 2Co-senior author.
E-mail addresses:dsalbrecht@mgh.harvard.edu(D.S. Albrecht),anton.forsberg@ki.se(A. Forsberg),angelica.sandstrom@ki.se(A. Sandström), diana.kadetoff@ki.se(D. Kadetoff),Katerina.Protsenko@ucsf.edu(E. Protsenko),jon.lampa@ki.se(J. Lampa),yvonee.lee@northwestern.edu(Y.C. Lee), ccatatna@nmr.mgh.harvard.edu(C. Catana),simon.cervenka@ki.se(S. Cervenka),oluwaseun.akeju@mgh.harvard.edu(O. Akeju),
mats.lekander@ki.se(M. Lekander),glcohen@mgh.harvard.edu(G. Cohen),christer.halldin@ki.se(C. Halldin),norman.taylor@hsc.utah.edu(N. Taylor), jhooker@mgh.harvard.edu(J.M. Hooker),rredwards@bwh.harvard.edu(R.R. Edwards),vitaly@mgh.harvard.edu(V. Napadow),Eva.Kosek@ki.se(E. Kosek), marco.loggia@mgh.harvard.edu(M.L. Loggia).
showed significant group differences in [11
C]-L-deprenyl-D2signal, including those demonstrating elevated [11C]
PBR28 signal in patients (p’s ≥ 0.53, uncorrected). The elevations in [11C]PBR28 V
Tand SUVR were correlated
both spatially (i.e., were observed in overlapping regions) and, in several areas, also in terms of magnitude. In exploratory, uncorrected analyses, higher subjective ratings of fatigue in FM patients were associated with higher [11C]PBR28 SUVR in the anterior and posterior middle cingulate cortices (p’s < 0.03). SUVR was not
significantly associated with any other clinical variable.
Our work provides the first in vivo evidence supporting a role for glial activation in FM pathophysiology. Given that the elevations in [11C]PBR28 signal were not also accompanied by increased [11
C]-L-deprenyl-D2
signal, our data suggests that microglia, but not astrocytes, may be driving the TSPO elevation in these regions. Although [11
C]-L-deprenyl-D2signal was not found to be increased in FM patients, larger studies are needed to
further assess the role of possible astrocytic contributions in FM. Overall, our data support glial modulation as a potential therapeutic strategy for FM.
1. Introduction
Fibromyalgia (FM) is a poorly understood chronic condition char-acterized by widespread musculoskeletal pain, fatigue, unrefreshing sleep, memory and attention difficulties, among other symptoms (Clauw, 2014). While the etiology of FM is unknown, central mechan-isms are strongly implicated, including evidence of abnormalities in structure, function, and molecular chemistry of the central nervous system (CNS) (Albrecht et al., 2016; Clauw, 2014; Dehghan et al., 2016; Flodin et al., 2014; Gracely et al., 2002; Harris et al., 2007; Jensen et al., 2009; Jensen et al., 2010; Jensen et al., 2013; Kuchinad et al., 2007; Loggia et al., 2014; Loggia et al., 2015a; Napadow and Harris, 2014; Schreiber et al., 2017; Schrepf et al., 2016; Wood, 2008), though some evidence points to peripheral alterations as well (Oaklander et al., 2013; Uceyler and Sommer, 2013).
Dysregulation of neuroimmune activation is one potential me-chanism contributing to previously reported central aberrations and central sensitization in FM. For instance, FM patients demonstrate elevated levels of fractalkine and interleukin-8 (IL-8) in cerebrospinal fluid (CSF) (Backryd et al., 2017; Kadetoff et al., 2012; Kosek et al., 2015). Both chemokines are implicated in neuron-glial communication (Montague and Malcangio, 2017; Puma et al., 2001), and have been associated with central sensitization and pain (Kosek et al., 2015; Montague and Malcangio, 2017). However, no study to date has clearly demonstrated that glial activation occurs in the brain of FM patients. Acknowledging a role for neuroimmune dysfunction in FM would open the exploration of glial modulation as a therapeutic option for this condition.
In the human CNS, glial activation can be studied in vivo using positron emission tomography (PET) and radioligands that bind to the 18-kDa translocator protein (TSPO), such as [11C]PBR28, which dis-plays nanomolar affinity to this protein (∼0.5 nM; Imaizumi et al., 2008). Located mainly on the outer mitochondrial membrane, TSPO expression is low in healthy CNS tissue, but is widely upregulated in microglia and astrocytes under inflammatory conditions (Lavisse et al., 2012; Rupprecht et al., 2010). Our group has recently used TSPO PET imaging to document neuroimmune activation in the central and per-ipheral nervous system of patients with chronic low back pain (CLBP) (Albrecht et al., 2018; Loggia et al., 2015b). While no TSPO PET studies of FM patients have been published yet, a possible link between TSPO and FM pathophysiology is provided by an association between the Ala147Thr polymorphism (rs6971) in the TSPO gene and FM symptom severity and cerebral pain processing (Kosek et al., 2016).
The aims of the current study were to evaluate the hypothesis that brain TSPO binding in FM patients, as assessed using the [11C]PBR28 PET ligand, is 1) elevated compared to healthy controls (indicating the presence of glial activation) and 2) correlated with specific symptoms attributable to FM pathophysiology. An additional third aim was to tease out the most likely cellular sources of increased TSPO binding because, while TSPO upregulation in neuroinflammatory responses consistently colocalizes with microglia, an accompanying astrocytic
component has been observed in some (Liu et al., 2016; Rupprecht et al., 2010; Toth et al., 2016; Wei et al., 2013), but not all cases (Abourbeh et al., 2012; Mirzaei et al., 2016). To this end, a smaller sample of FM patients received a PET scan with [11
C]-L-deprenyl-D2, which binds to monoamine oxidase B (MAO-B) with high specificity in postmortem tissue (∼30 fmol/mg tissue;Gulyas et al., 2011). Because the expression of MAO-B in glial cells is thought to be predominantly, if not exclusively, within astrocytes (Ekblom et al., 1994), we reasoned that the presence of elevations in [11
C]-L-deprenyl-D2signal within regions also demonstrating TSPO elevations would support the presence of an astrocytic contribution to the TSPO signal. Conversely, the ab-sence of [11
C]-L-deprenyl-D2in regions showing elevated TSPO signal would suggest a predominantly microglial cellular source.
2. Materials and methods
2.1. Study design
This collaborative project combines data from two independent research centers to amass a [11C]PBR28 PET imaging cohort of FM patients and matched healthy controls (HC): Massachusetts General Hospital (MGH) in Boston, MA, United States, and Karolinska Institutet (KI) in Stockholm, Sweden. Both studies were approved by ethical commitees (MGH – Partners Human Research Committee; KI – Regional Ethical Review Board in Stockholm), and all subjects provided informed consent. The initial study design and data collection at each site were completed independently, and the decision to aggregate the data into a common analysis was made after completion of data collection. Potential confounds attributable to site-specific differences were taken into account in the statistical models of the combined dataset. Group differences identified in the primary analysis of the combined dataset were also assessed within each site separately. Because arterial plasma data were collected for all subjects scanned at Karolinska, we decided to perform two levels of analyses. The first analysis took advantage of the arterial blood data collected at Karolinska, in order to obtain quanti-tative distribution volume (VT) metrics using kinetic modeling. The second analysis employed a blood-free ratio approach previously vali-dated in separate cohorts (Albrecht et al., 2017), and utilized the en-hanced statistical power of the combined sample (31 patients vs. 27 controls). An evaluation of the agreement between VTcomputed in the smaller (KI only) sample and SUVR in the larger, combined sample (KI + MGH) was perfomed by assessing the extent of spatial overlap of the group differences, as well as the regional correlation of these me-trics.
2.2. Subjects
In total, 31 FM patients (29 female, 50.7 ± 11 y/o) and 27 controls (25 female, 49.4 ± 11 y/o) received a [11C]PBR28 PET brain scan. A total of 11 FM patients (11 female, 51.5 ± 8.2 y/o), and 11 controls (11 female, 51.0 ± 7.0 y/o) received a [11
All FM patients had received a diagnosis of FM from a physician, and met the 2011 modifications of the American College of Rheumatology classification criteria for fibromyalgia (Wolfe et al., 2011). FM patients were excluded for the presence of any pain conditions other than FM. Exclusionary criteria for all subjects at either site included: history of major psychiatric illness, neurological illness, cardiovascular disease, inability to communicate in English (MGH) or Swedish (KI), and con-traindication for PET/MR scanning (e.g., pacemaker, metallic implants, pregnancy, etc). Addtionally, at MGH, the use of benzodiazepine medications was exclusionary, except for clonazepam, alprazolam, and lorazepam, that show negligible binding to TSPO in vitro, even at large clinical doses (Canat et al., 1993; Clow et al., 1985; Gehlert et al., 1985; Kalk et al., 2013; Wamsley et al., 1993). At KI, benzodiazepines were not exclusionary, however no patients reported benzodiazepine use (see Results). Please seeSupplementary Table 1for a detailed list of exclu-sion criteria by site.
2.2.1. Karolinska Institutet
Eleven patients diagnosed with FM (11 female, 51.8 ± 8.6 y/o) and 11 HC (11 female, 51.5 ± 9.0 y/o) were matched according to age, sex and genotype for the Ala147Thr TSPO polymorphism (rs6971) which affects binding of TSPO radioligands, including [11C]PBR28, both in vitro and in vivo (Collste et al., 2016; Kreisl et al., 2013a; Owen et al., 2010; Owen et al., 2012). Sixteen subjects were Ala/Ala (i.e., high-af-finity binders; HABs: FM n = 8; HC n = 8) and six were Ala/Thr (i.e., mixed-affinity binders; MABs: FM n = 3; HC n = 3). No Thr/Thr (i.e., low-affinity binders; LABs) were included. Eleven FM patients and 11 HC received a brain [11C]PBR28 PET scan. Moreover, six of the 11 FM patients that completed the [11C]PBR28 scan and agreed to participate in an additional PET scan, as well as five additional FM patients and 11 sex and age-matched healthy controls not previously examined, re-ceived a [11
C]-L-deprenyl-D2PET scan. In addition to meeting 2011 ACR diagnostic criteria, all patients in the KI cohort also met the ACR 1990 criteria (Wolfe et al., 1990).
2.2.2. Massachusetts general hospital
Twenty patients diagnosed with FM (18 female, 48.0 ± 1.2 y/o) were group matched with 16 HC subjects (14 female, 50.2 ± 13 y/o) according to age, sex, and TSPO polymorphism. Twenty-four subjects were HABs (FM n = 14; HC n = 10), and 12 were MABs (FM n = 6; HC n = 6). No LABs were included in the study. At the MGH site, one pa-tient also had chronic hepatitis C, one had idiopathic CD8 lymphocy-topenia, and one had Meniere’s Disease and diabetes. These subjects were not outliers on any of the PET imaging measures, and results were unaffected if these subjects were excluded.
2.3. Clinical assessment
All FM patients completed the following clinical questionnaires: 2011 American College of Rheumatology self-report survey for the assessment of FM (ACR;Wolfe et al., 2011), FM Impact Questionnaire (FIQ;Bennett et al., 2009), Beck Depression Inventory (BDI;Beck et al., 1961), and Pain Catastrophizing Scale (PCS;Sullivan et al., 1995). All items were completed on the day of the scan, with the exception of the ACR survey for all KI patients and two MGH patients, and the BDI for MGH patients, which were completed only during the screening visit. Because 17 MGH patients completed the ACR survey on both the scan day and during the screening visit, we were able to confirm that this questionnaire has good temporal stability by correlating the scores across visits. All subscales of the ACR survey showed high to moderate intercorrelations (total: r = 0.785, p < 0.001; symptom severity: r = 0.788, p < 0.001; wide-spread pain index: r = 0.728, p = 0.001; fatigue: r = 0.534, p = 0.027; trouble thinking: r = 0.581, p = 0.015; waking up tired: r = 0.810, p < 0.001), supporting the temporal stability of these measures, and therefore the appropriateness of evaluating these variables in relation to imaging metrics collected at different timepoints.
Prior to tracer injection on the scan day, all patients also rated their pain on a visual analog scale, anchored by 0 (“No pain at all”) and 100 (“Most intense pain tolerable”).
2.4. Positron emission tomography (PET) and magnetic resonance (MR) imaging
2.4.1. Karolinska Institutet
PET imaging was performed using the High-Resolution Research Tomograph (Siemens Molecular Imaging, Knoxville, TN, USA) at the PET centre at Karolinska Institutet, Stockholm, Sweden. Structural MR images were collected using a 1.5-T Siemens Avanto scanner at Medicinsk Röntgen at Odenplan prior to the first PET scan (TR = 1790 or 1800 ms, TE = 3.53 or 2.8 ms, flip angle = 15° or 8°, voxel size = 1 mm isotropic). Prior to PET scanning, subjects received a cu-bital vein catheter for intravenous radioligand administration and a radial artery catheter in the contralateral arm for arterial blood sam-pling. To minimize motion during the PET data acquisition, each par-ticipant wore an individually-designed helmet, placed in a frame holder.
Preparation, injection and PET data acquisition for [11C]PBR28 have been described previously (Collste et al., 2016; Kanegawa et al., 2016). Average administered radioactivity of [11C]PBR28 (MBq) was – HC: 416 ± 40 (mean ± SD), FM: 385 ± 71; average specific radio-activity (GBq/µmol) – HC: 306 ± 195, FM: 239 ± 74; average in-jected mass (µg) – HC: 0.60 ± 0.34, FM: 0.61 ± 0.21. Average ad-ministered radioactivity of [11
C]-L-deprenyl-D2was – HC: 364 ± 46, FM: 366 ± 45; average specific radioactivity – HC: 193 ± 105, FM: 213 ± 82 ; average injected mass – HC: 0.48 ± 0.30, FM: 0.36 ± 0.13. PET data were acquired for 63 min both for [11C]PBR28 and [11C]-L-deprenyl-D2. Manual samples were drawn at 2, 4, 6, 8, 10, 15, 20, 25, 30, 45, and 60 min for [11C]PBR28 and 1, 2, 4, 6, 8, 10, 16, 20, 30, 40, and 60 min for [11
C]-L-deprenyl-D2. For one control subject in the [11
C]-L-deprenyl-D2dataset, there was a technical issue with the arterial blood collection, and thus this subject was excluded from the analysis. Arterial blood data pre-processing was performed using Ka-leidagraph 4.1 software (Synergy Software) as described previously (Collste et al., 2016). Radioligand metabolism correction was per-formed using the parent fraction in PMOD v3.3 (pixel-wise modelling software; PMOD Technologies Ltd., Zurich, Switzerland) where in-dividual parent fraction data was fit with a 3-exponential model. 2.4.2. Massachusetts general hospital
Imaging was performed at the MGH/HST Athinoula A. Martinos Center for Biomedical Imaging in Charlestown, MA. [11C]PBR28 was produced in-house using a procedure modified from the literature (Imaizumi et al., 2007). [11C]PBR28 scans were performed for 90 min with an integrated PET/MR scanner consisting of a dedicated brain avalanche photodiode-based PET scanner in the bore of a Siemens 3T Tim Trio MRI (Kolb et al., 2012). A multi-echo MPRAGE volume was acquired prior to tracer injection (TR/TE1/TE2/TE3/TE4 = 2530/ 1.64/3.5/5.36/7.22 ms, flip angle = 7°, voxel size = 1 mm isotropic) for the purpose of anatomical localization, spatial normalization of the imaging data, as well as generation of attenuation correction maps (Izquierdo-Garcia et al., 2014). Average administered radioactivity of [11C]PBR28 (MBq) was – HC: 457 ± 57 MBq, FM: 505 ± 40; average specific activity (GBq/µmol) – HC: 77.4 ± 30, FM: 71.8 ± 26; average injected mass (µg) – HC: 2.32 ± 0.8, FM: 2.78 ± 1.1.
2.5. PET data analysis and quantification 2.5.1. Kinetic analysis
Estimation of [11C]PBR28 distribution volume (VT) was performed using Logan graphical analysis with a metabolite corrected plasma input function (Logan et al., 1990), based on five frames from 33 to 63 min. For each PET scan, a parametric VTimage was generated using
the stationary wavelet aided parametric imaging (WAPI) approach (Cselenyi et al., 2002). WAPI analysis of TSPO binding has been pre-viously shown to be sensitive to within-subject changes in VT(Forsberg et al., 2017; Jucaite et al., 2015), and has shown both high correlation with VTestimated with the two-tissue compartment model (2TCM), and good reliability for 63 min of data (Collste et al., 2016).
Quantification of [11
C]-L-deprenyl-D2data was performed as de-scribed previously, utilizing the 2TCM with three rate constants (K1, k2, k3) with PMOD 3.3 (Sturm et al., 2017). The outcome measure λk3was calculated as (K1/k2) * k3which has been shown to reflect the regional enzyme concentration more accurately than k3alone (Fowler et al., 1995; Logan et al., 2000). There is presently no validated method to produce λk3parametric images with the WAPI methodology we used for the [11C]PBR28 analysis. For this reason, [11C]-L-deprenyl-D2data was analyzed only using a region-of-interest (ROI) approach. Because an aim of this project was to assess the presence of a possible astrocytic component to TSPO signal in FM, the regions identified as statistically different across groups in the [11C]PBR28 voxel-wise SUVR analyses (see below) were selected as ROIs. Addtionally, λk3values were com-puted for 23 anatomically definted ROIs from the AAL atlas, whole brain, and whole gray matter for exploratory analyses.
2.5.2. SUVR analysis
Static [11C]PBR28 PET images were reconstructed from 33 to 63 min post-injection PET data, the latest 30-minute period available at both sites. Standardized uptake value (SUV) images were calculated by normalizing images by injected dose/body weight. SUV ratio images (SUVR) were obtained via normalization by PET signal from a pseudo-reference region (i.e., occipital cortex, identified using the occipital cortex label from the AAL atlas available in PMOD (Tzourio-Mazoyer et al., 2002)). We have previously utilized this approach for quantifi-cation of [11C]PBR28 PET data in both chronic low back pain patients
and in patients with ALS (Albrecht et al., 2017), showing that group differences in SUVR (in the thalamus and motor cortex, in pain and ALS patients, respectively) can be similarly observed using VT(or VTratio; DVR) estimated with 2TCM, and that SUVR and DVR are strongly correlated. However, since some medial portions of the occipital cortex exhibited group differences in the VTanalysis (see Results), these were excluded from the occipital pseudo-reference region. A general linear model (GLM) analysis with genotype and injected dose as regressors of no interest, revealed that the mean SUV extracted from the occipital region defined above did not show any significant effects of Group (F1,52= 4.38 × 10⁻⁶, p = 0.99), Site (F1,52= 0.006, p = 0.72), or a Group * Site interaction (F1,52= 0.08, p = 0.20). These results support the appropriateness of using this region as a pseudo-reference in this particular study.
2.5.3. Image post-processing
For both SUVR and VTimages, FSL and Freesurfer tools were used for image processing. PET images were co-registered to individual structural T1 images, normalized to MNI standard space, and spatially smoothed with an 8 mm FWHM Gaussian kernel, as inLoggia et al., (2015b) and Albrecht et al., (2017).
2.6. Statistical analysis
Differences in continuous variables were assessed by performing a GLM analysis with Group and Site as fixed factors, and a Group * Site interaction term. Significant interaction terms were decomposed with post-hoc planned comparisons of least squares means. Differences in the distribution of categorical variables were assessed with Chi-Square tests. Between-site differences in FM questionnaire scores were assessed with two-sample t-tests.
As the primary analysis, voxelwise group comparisons of [11C]
Fig. 1. Voxelwise group differences in [11C]PBR28 V
T. A: Surface projection maps displaying areas with significantly elevated [11C]PBR28 VTin FM patients
compared to controls (FM – n = 11; HC – n = 11) in voxelwise analyses (KI-only sample). B: average ± standard deviation VTextracted from several regions. The
S1/M1, dLPFC and precuneus data were extracted from the clusters identified as statistically significant in the voxelwise VTanalysis. For these regions, the plots are
displayed for illustrative purposes only, and the level of statistical significance noted for each plot reflects that of the voxelwise analyses. For the aMCC, the data was extracted from a region independently identified based on the results of the SUVR voxelwise analysis (seeFig. 2). The level of statistical significance noted for this region reflects the result of a region-of-interest analysis. SPL – superior parietal lobule, S1 – primary somatosensory cortex, M1 – primary motor cortex, SMG – supramarginal gyrus, dlPFC – dorsolateral prefrontal cortex, SMA – supplementary motor area, PCC – posterior cingulate cortex, dmPFC – dorsomedial prefrontal cortex. The box plots for S1/M1, dlPFC and Precuneus are for illustrative purposes. The box plot for aMCC illustrates an ROI analysis (p = 0.071).
PBR28 VTand SUVR maps were performed with FSL’s FEAT GLM tool (www.fmrib.ox.ac.uk/fsl, version 5.0.7), using a voxelwise cluster-forming threshold of z > 2.3 and a (corrected) cluster significance threshold of p < 0.05 to correct for multiple comparisons. TSPO polymorphism (Ala/Ala, Ala/Thr), was included as a regressor of no interest in both analyses. Study site (MGH, KI) was included as an ad-ditional regressor of no interest in SUVR analysis, as this was perfomed on the combined sample from both institutions. Because there was a statistically significant effect of Site (F1,54= 37.9, p < 0.001) and a significant Group * Site interaction for injected dose (F1,54= 4.23, p = 0.044), this variable was also added as a covariate of no interest in all group analyses using the combined dataset (KI + MGH). There were also significant effects of Site for specific activity and injected mass, but no significant Group * Site interactions. Therefore, we performed sup-plementary voxelwise analyses including these variables as regressors of no interest, in order to ensure that including them in the statistical model had negligible effects on the outcomes. Because no subcortical effects were detected, and for ease of visualization, imaging results were visualized on a surface (FreeSurfer’s fsaverage).
For follow up analyses and illustration purposes, clusters of sig-nificant group differences from the SUVR or VT analysis (Figs. 1–3) were parcellated into separate anatomically-constrained subregions, using the labels from the Harvard-Oxford probabilistic atlas (using an arbitrary threshold of 30). Average SUVR and/or VTvalues were ex-tracted from these regions, for the purposes of visualizing data, com-paring group effects within each site independently, and assessing re-lationships between SUVR and clinical variables and between outcome metrics (SUVR and VT). Although anterior middle cingulate (aMCC) did not exhibit significant group differences in the voxelwise VTanalysis, this region was significant in the SUVR analysis (see Results); therefore, average VTwas extracted from aMCC to test for potential VTdifferences not detected in the voxelwise analysis, particularly because this region is highly relevant to pain processing (Kragel et al., 2018; Shackman et al., 2011). Partial correlation analyses were used to assess correla-tions between PET signal extracted from regions exhibiting significant
group differences in the voxelwise analyses and continuous clinical variables (i.e. ACR [total score, symptom severity score, widespread pain index], FIQR, BDI, PCS, and current VAS pain), correcting for TSPO polymorphism. These analyses were performed using SUVR, as these values were available for all patients at both sites. To assess the relationship between extracted PET signal and ordinal clinical variables (individual ACR symptom severity items: “fatigue”, “trouble thinking or remembering”, “waking up tired”), we performed GLM analyses with TSPO PET signal as the dependent variable, clinical score as a fixed factor (“slight or mild problem”, “moderate problem”, or “severe pro-blem”), and TSPO polymorphism and study site as regressors of no in-terest. Post-hoc planned comparisons of least squares means were performed to decompose significant main effects. Additionally, partial correlation analysis was used to evaluate the association between [11C] PBR28 VTand SUVR in participants for whom both measures were available, correcting for TSPO polymorphism.
After identifying regions demonstrating group differences in the combined [11C]PBR28 SUVR datasets, we conducted a follow up GLM analysis of the data extracted from the same regions, in order to eval-uate the significance of the Site effect and the Group * Site interaction, using TSPO genotype and injected dose as regressors of no interest, and to compute the effect size, using Cohen’s d, for each site independently. The primary aim of these analyses was to assess whether the group differences identified in the voxelwise analyses were driven solely by one site, or could rather be similarly observed at both sites. In order to avoid circularity, we do not report the p-values for the Group effects at each site independently, as these analyses were performed on data extracted from regions preselected because they already exhibited a Group effect in the voxelwise analyses.
For all demographic, correlation, and follow-up analyses, sig-nificance was set as p < 0.05, uncorrected.
Unpaired t-tests were used to assess group differences in [11 C]-L -deprenyl-D2λ k3for each region with elevated TSPO signal, which in-cluded: aMCC, dLPFC, dmPFC, frontoinsular cortex, S1/M1, PCC, pre-cuneus, pMCC, SMA, and SPL (see Results). Unpaired t-tests were also
Fig. 2. Voxelwise group differences in [11C]PBR28 SUVR A. Surface projection maps displaying areas with significantly elevated [11C]PBR28 SUVR in FM patients
compared to controls (FM – n = 31; HC – n = 27), in voxelwise analyses (KI + MGH sample). B: average ± standard deviation SUVR extracted from several of the clusters identified as statistically significant in the voxelwise SUVR analysis. Data from individual research sites (MGH or KI) are displayed separately, and the number above each ROI pairing corresponds to the effect size (Cohen’s d) of PET signal differences between FM patients and controls for each site. These data show that overall SUVR group differences, while larger for the KI dataset, are elevated in FM patients compared to controls in both datasets when evaluated independently. pMCC – posterior middle cingulate cortex, aMCC – anterior middle cingulate cortex. All data have been adjusted for genotype and injected dose.
performed for the exploratory analysis of 23 anatomically defined ROIs, and whole brain and gray matter. However, because no group differ-ences were significant in any ROI, all analyses were followed up by exploratory uncorrected analyses to provide more convincing support to the claim that the lack of group effects reported in the deprenyl analyses are likely to reflect the lack of astrocytic activation in FM.
Please refer toSupplementary Table 2for a summary of the statis-tical analyses.
3. Results
3.1. Subject characteristics
Demographic and other key characteristics for all subjects are shown inTable 1. FM patients had significantly higher BMI than con-trols in the MGH dataset (p < 0.001), but there were no significant patient-control differences for any other variable (p’s ≥ 0.071) for any dataset. Clinical characteristics of all FM patients are presented in
Table 2. For the [11C]PBR28 analysis, FM patients from the KI site had significantly higher scores than FM patients from the MGH site on several of the ACR 2011 items (p < 0.047;Table 2). KI patients in-cluded in both the [11C]PBR28 and the [11
C]-L-deprenyl-D2analyses
were also less medicated (Table 3). There were no significant differ-ences between FM patients at the KI site in the [11C]PBR28 and [11
C]-L -deprenyl-D2 datasets for any demographic characteristic or clinical measure evaluated (p’s ≥ 0.29).
3.2. [11C]PBR28 analyses: Group differences 3.2.1. [11C]PBR28 V
Tcomparison (KI sample only) In FM patients, [11C]PBR28 V
Twas elevated in several brain regions compared to healthy control subjects (Fig. 1), including dorsolateral prefrontal cortex (dlPFC), dorsomedial PFC (dmPFC), primary soma-tosensory and motor cortices (S1/M1), precuneus, posterior cingulate cortex (PCC), supplementary motor area (SMA), supramarginal gyrus (SMG), and superior parietal lobule (SPL). Additionally, an ROI analysis of the aMCC revealed elevated VTin the FM patients that approached statistical significance (p = 0.071). There were no regions where con-trol VTwas significantly higher than FM VT.
3.2.2. [11C]PBR28 SUVR comparison (KI + MGH)
A whole brain voxelwise analysis identified several brain regions where SUVR in FM patients was significantly greater than in HC (Fig. 2). These regions largely overlapped those identified in the VT
Fig. 3. Agreement between SUVR and VTanalyses A. Surface projection displaying the regions showing elevated PET signal across both SUVR (KI + MGH combined
dataset) and VT(KI-only) analyses. B: Cross-correlations between SUVR and VT, extracted from regions identified in the overlap mask or, for the aMCC, from the
SUVR analyses, in FM patients and HC from the KI site.
Table 1
Participant characteristics.
Massachusetts General Hospital [11C]PBR28 Karolinska Institutet [11C]PBR28 Karolinska Institutet [11C]-L-deprenyl-D2
FM (n = 20) HC (n = 16) FM (n = 11)1 HC (n = 11) FM (n = 11)2 HC (n = 11)
Age (years) 48.0 ± 12 50.2 ± 13 51.8 ± 8.6 51.5 ± 9.0 51.5 ± 8.2 51.0 ± 7.0
Sex 18F; 2 M 14F; 2 M 11F 11F 11F 11F
TSPO polymorphism 14 HAB; 6 MAB 10 HAB; 6 MAB 8 HAB; 3 MAB 8 HAB; 3 MAB N/A
BMI 30.0 ± 5.7* 23.6 ± 3.6 24.5 ± 3.7 23.1 ± 2.0 24.5 ± 3.0 22.3 ± 1.8
Injected dose (MBq) 505 ± 40 457 ± 57 385 ± 71 416 ± 40 366 ± 45 364 ± 46
Specific activity (GBq/µmol) 71.8 ± 26 77.4 ± 30 239 ± 74 306 ± 195 213 ± 82 193 ± 105
Injected mass (µg) 2.78 ± 1.1 2.32 ± 0.8 0.61 ± 0.21 0.60 ± 0.34 0.36 ± 0.13 0.48 ± 0.30
* Significantly different from controls within-cohort, p < 0.05.
1 Six of the FM subjects receiving a [11C]PBR28 scan also received a [11
C]-L-deprenyl-D2scan. 2 [11
analysis (dlPFC, dmPFC, S1/M1, precuneus, PCC, SMA, SPL) but also revealed effects in additional regions (aMCC, posterior MCC [pMCC], and frontoinsular cortex). There were no regions where SUVR was significantly higher in healthy controls relative to FM patients. Sup-plementary voxelwise analyses, including specific activity and injected mass as regressors of no interest, showed similar outcomes to the pri-mary analysis, which included injected dose as a regressor of no interest (Supplementary Fig. 1).
Following these voxelwise analyses, we performed a post-hoc re-gional analysis of the areas demonstrating SUVR group differences, in order to evaluate whether the effects emerging in the combined dataset could be similarly observed at each site independently (Table 4). This analysis revealed the presence of a statistically significant Site effect for all regions (p’s < 0.026), except for dmPFC (p = 0.910) and SMA (p = 0.078). It also revealed the presence of significant Site * Group interactions in SUVR for all regions examined (p’s < 0.047) except for dlPFC (p = 0.072), dmPFC (p = 0.237), frontoinsular cortex (p = 0.362), pMCC (p = 0.096), and SMA (p = 0.624). The Cohen’s d for the difference between FM patients and HC ranged between 0.58 and 1.04 at MGH and between 0.79 and 1.87 at KI (Table 4;Fig. 2), indicating medium or large effect size for all examined regions at both sites (Cohen, 1988), although the magnitude of the difference was generally larger for the KI study.
3.2.3. [11C]PBR28 analysis: Agreement between SUVR and V
T(KI sample only)
The regions identified in the voxelwise SUVR analysis displayed a large degree of spatial overlap with results from the VTanalysis. To visualize this, we created an image showing common regions identified in both analyses as significantly higher in FM patients. These regions included dlPFC, dmPFC, PCC, precuneus, S1/M1, SMA, and SPL (Fig. 3, left). In addition to this spatial agreement across analyses, we were able to eval-uate the association across metrics in the KI participants, for whom both SUVR and VTwere available. Statistically significant positive correlations were observed for S1/M1 (r = 0.453, p = 0.039;Fig. 3, right), dmPFC (r = 0.497, p = 0.022), and PCC (r = 0.491, p = 0.024), whereas dlPFC (r = 0.428, p = 0.053), precuneus (r = 0.384, p = 0.085), and SPL (r = 0.375, p = 0.094) demonstrated only trend-level correlations. 3.3. [11C]PBR28 analysis: Association with clinical variables (KI + MGH)
Within FM patients, an exploratory GLM analysis revealed that the scores of the Fatigue item of the ACR diagnostic criteria were sig-nificantly associated with SUVR in the aMCC (F2,23= 5.04, p = 0.015, uncorrected) and pMCC (F2,23= 3.80, p = 0.03, uncorrected), with higher SUVR in patients reporting severe fatigue compared to those reporting slight/mild fatigue in both regions (p’s ≤ 0.01, uncorrected;
Fig. 4). There were no significant associations between SUVR and any other clinical variable.
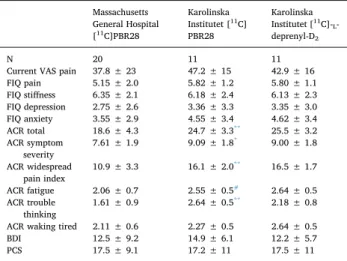
Table 2
FM patient clinical characteristics: [11C]PBR28 analysis. Massachusetts General Hospital [11C]PBR28 Karolinska Institutet [11C] PBR28 Karolinska Institutet [11C]-L -deprenyl-D2 N 20 11 11
Current VAS pain 37.8 ± 23 47.2 ± 15 42.9 ± 16
FIQ pain 5.15 ± 2.0 5.82 ± 1.2 5.80 ± 1.1 FIQ stiffness 6.35 ± 2.1 6.18 ± 2.4 6.13 ± 2.3 FIQ depression 2.75 ± 2.6 3.36 ± 3.3 3.35 ± 3.0 FIQ anxiety 3.55 ± 2.9 4.55 ± 3.4 4.62 ± 3.4 ACR total 18.6 ± 4.3 24.7 ± 3.3** 25.5 ± 3.2 ACR symptom severity 7.61 ± 1.9 9.09 ± 1.8 * 9.00 ± 1.8 ACR widespread pain index 10.9 ± 3.3 16.1 ± 2.0 ** 16.5 ± 1.7 ACR fatigue 2.06 ± 0.7 2.55 ± 0.5# 2.64 ± 0.5 ACR trouble thinking 1.61 ± 0.9 2.64 ± 0.5 ** 2.18 ± 0.8 ACR waking tired 2.11 ± 0.6 2.27 ± 0.5 2.64 ± 0.5
BDI 12.5 ± 9.2 14.9 ± 6.1 12.2 ± 5.7
PCS 17.5 ± 9.1 17.2 ± 11 17.5 ± 11
FIQ – Fibromyalgia Impact Questionnaire; ACR – 2011 modifications of the American College of Rheumatology diagnostic criteria for fibromyalgia; BDI – Beck Depression Inventory; PCS – Pain Catastrophizing Scale.
* Significant difference between KI and MGH FM patients from the [11C]
PBR28 datasets, p < 0.05.
** Significant difference between KI and MGH FM patients from the [11C]
PBR28 datasets, p < 0.01.
#Trend-level difference between KI and MGH FM patients from the [11C]
PBR28 datasets, p < 0.10.
Table 3
FM patient medications.
Medication Massachusetts
General Hospital KarolinskaInstitutet [11C] PBR28 Karolinska Institutet [11C]-L -deprenyl-D2 N 20 11 11 NSAIDs 6 5 2 Acetominophen (paracetamol) 2 6 4 Muscle relaxant 8 2 1 Sleep medication 2 2 3 SNRI 6 0 0 Anticonvulsant 2 0 0 Opioid 1 0 0 Benzodiazepines 9 0 0 Tricyclic antidepressant 6 0 0 Table 4
Site-specific comparison of SUVR.
Region Effect of Site Group * Site interaction MGH – FM vs. HC effect size KI – FM vs. HC effect size
aMCC F1,52= 13.2, p = 0.001 F1,52= 4.16, p = 0.047 0.78 1.46 dlPFC F1,52= 9.01, p = 0.004 F1.52= 3.38, p = 0.072 1.01 1.48 dmPFC F1,52= 0.01, p = 0.910 F1.52= 1.43, p = 0.237 0.74 1.70 Frontoinsular cortex F1,52= 5.22, p = 0.026 F1.52= 0.85, p = 0.362 0.74 1.27 S1/M1 F1,52= 18.1, p < 0.001 F1.52= 8.94, p = 0.004 1.04 1.89 pMCC F1,52= 71.2, p < 0.001 F1.52= 2.88, p = 0.096 0.83 0.79 PCC F1,52= 115, p < 0.001 F1.52= 14.7, p < 0.001 0.58 1.12 Precuneus F1,52= 25.7, p < 0.001 F1.52= 12.7, p < 0.001 0.92 1.40 SMA F1,52= 3.22, p = 0.078 F1.52= 0.24, p = 0.624 1.02 1.19 SPL F1,52= 10.8, p = 0.002 F1.52= 13.5, p < 0.001 0.82 1.71
Statistically significant results are displayed in bold, statistical tests exhibiting trend-level results are displayed in italics. aMCC – anterior middle cingulate cortex, dmPFC – dorsomedial prefrontal cortex, dlPFC – dorsolateral prefrontal cortex, S1 – primary somatosensory cortex, M1 – primary motor cortex, pMCC – posterior middle cingulate cortex, PCC – posterior cingulate cortex, SMA – supplementary motor area, SPL – superior parietal lobule.
3.4. [11C]-L-deprenyl-D2analysis: Group differences (KI sample only) Group comparisons of λ k3values revealed no significant differences between FM patients and HC subjects, even when evaluated without correction for multiple comparisons, both within the regions demon-strating elevated [11C]PBR28 SUVR (Fig. 5; p’s ≥ 0.53, uncorrected), as well as in any of the additional 23 anatomically defined ROIs, or in the whole brain or whole gray matter regions (p’s ≥ 0.53 uncorrected;
Supplementary Table 3).
Of note, even in the small subset of 6 FM patients who received both [11C]PBR28 and [11
C]-L-deprenyl-D2scans, we were able to confirm elevated [11C]PBR28 signal (p’s ≤ 0.007), but statistically indis-tinguishable [11C]-L-deprenyl-D2signal (p’s ≥ 0.63), compared to con-trols (Supplementary Fig. 2).
4. Discussion
The current study provides evidence of elevated TSPO binding, as measured with [11C]PBR28 PET, in patients with fibromyalgia (FM) compared to healthy controls (HC). This marker of glial activation was increased in several brain regions implicated in FM pathology from previous neuroimaging studies. We also report positive associations
between TSPO PET signal in several of these regions and subjective ratings of fatigue, one of the most common symptoms reported by FM patients (Clauw, 2014; Wolfe et al., 2011). Our observations are sup-portive of a role for neuroimmune/glial activation in FM pathology.
These results conform to a body of clinical data suggesting a pos-sible association between neuroinflammation and FM. Several studies of FM patients demonstrated elevated CSF levels of molecules im-plicated in neuroglial signaling, such as fractalkine and IL-8 (Backryd et al., 2017; Kadetoff et al., 2012; Kosek et al., 2015). Furthermore, previous studies showed increased endogenous opioidergic tone in FM (Schrepf et al., 2016), which could be of relevance as opioid-induced hyperalgesia is associated with glial activation (Roeckel et al., 2016). In line with this evidence, some pharmacological treatments involving the opioid system and/or with putative inhibitory actions on glial cells are beneficial for FM. One example of this is low-dose naltrexone, an opioid antagonist, which is proposed to inhibit glial activation (Mattioli et al., 2010) and has been shown to have beneficial effects in FM (Younger and Mackey, 2009; Younger et al., 2009). Additionally, serotonin/ noradrenaline reuptake inhibitors (SNRIs; e.g., duloxetine, milnacipran, etc.) are among the most commonly prescribed pharmacological treatments for FM, and show moderate effectiveness in reducing some FM symptoms (Welsch et al., 2018). While the primary mechanism of action of SNRIs is to normalize concentrations of endogenous mono-amine neurotransmitters, which are thought to be imbalanced in FM (Albrecht et al., 2016; Kosek et al., 2016; Russell et al., 1992; Wood, 2008), one potential additional mechanism may be glial modulation, as both duloxetine (Yamashita et al., 2016) and milnacipran (Shadfar et al., 2018) attenuate microglial activation in animal models. Inter-estingly, among the regions demonstrating neuroimmune activation in our current study was the PCC/precuneus, a core region of the default mode network, where post-treatment changes in pain related activation were specifically related to the degree of positive clinical response to milnacipran treatment in fibromyalgia patients (Jensen et al., 2014). Further studies are needed to better understand the specific cellular and molecular mechanisms of FM pharmacotherapies, and the potential role glial cell inhibition plays in their effectiveness.
The utility of TSPO as a marker of glial activation is supported by
Fig. 4. Associations between [11C]PBR28 SUVR and clinical variables.
Significant differences in [11C]PBR28 SUVR in the aMCC (top) and pMCC
(bottom) between FM patients reporting different severity of fatigue on the ACR 2011 questionnaire. Surface projections of individual ROIs are displayed in red above the plots. All data have been adjusted for TSPO genotype. * – Significant difference in post-hoc tests between FM patients reporting different levels of fatigue severity (p < 0.01) # - Trend-level difference in post-hoc tests between FM patients reporting different levels of fatigue severity (p < 0.10). (For in-terpretation of the references to colour in this figure legend, the reader is re-ferred to the web version of this article.)
Fig. 5. Absence of group differences in [11
C]-L-deprenyl-D2 λk3. Four
re-presentative regions showing significant group differences in the [11C]PBR28
SUVR analysis (Fig. 2) show no differences in [11
C]-L-deprenyl-D2 λk3
(p ≥ 0.53 uncorrected). Surface projections of individual regions are displayed in red above the plots. (For interpretation of the references to colour in this figure legend, the reader is referred to the web version of this article.)
numerous preclinical and post-mortem studies. While TSPO is ubiqui-tously expressed by many cell types, it can be used as a sensitive marker of glial activation in vitro because it is dramatically upregulated in glial cells in the context of a neuroinflammatory response. TSPO upregula-tion has been colocalized with activated microglia and/or astrocytes across a spectrum of CNS disorders, including animal models of neu-ropathic pain (Liu et al., 2016; Wei et al., 2013), both animal MS models and human MS lesions (Abourbeh et al., 2012; Chen and Guilarte, 2006; Cosenza-Nashat et al., 2009), and both animal models of Alzheimer’s disease (AD) and human post-mortem tissue ( Cosenza-Nashat et al., 2009; Gulyas et al., 2009; James et al., 2017), among many others. The utility of TSPO as a marker of glial activation is further supported by numerous in vivo human PET imaging studies. In many of these, elevated TSPO PET signal is observed in brain regions where glial activation is known to occur. TSPO elevations have been documented in the primary motor cortex in Amyotrophic and Primary Lateral Sclerosis (Alshikho et al., 2016; Alshikho et al., 2018; Paganoni et al., 2018; Zurcher et al., 2015), in white matter or gray matter lesions in Multiple Sclerosis (Datta et al., 2017; Herranz et al., 2016), in amyloid positive regions in Alzheimer’s Disease (Kreisl et al., 2013b.;
Parbo et al., 2017), and in the basal ganglia in Huntington’s Disease (Lois et al., 2018). However, while a plethora of human and preclinical studies support TSPO as a glial marker, it is important to note that not all studies have detected TSPO upregulation in neuropathologies with a hypothesized inflammatory component. For instance, previous work showed no differences in TSPO PET signal in cocaine dependence (Narendran et al., 2014), and decreased signal in alcohol dependence (Hillmer et al., 2017; Kalk et al., 2017). In patients with psychosis, initial studies with first generation TSPO tracers showed an increase, whereas recent studies using second-generation radioligands are sup-portive of a decrease in TSPO levels (Plaven-Sigray et al., 2018). Thus, further work is needed to better assess the potential usefulness of TSPO as a means to image neuroinflammation, and the meaning of the ob-served TSPO signal changes, particularly in certain pathologies.
In addition, even in conditions for which TSPO may be more es-tablished as a marker of glial activation, the specific functional sig-nificance of its upregulation remains unclear, and represents an active area of investigation. Numerous preclinical studies show analgesic and anti-inflammatory effects of TSPO agonism, such as increased expres-sion of anti-inflammatory IL-10 and other M2-related microglial genes, indicating that changes in TSPO expression might be an adaptive re-sponse to a homeostatic challenge (Bae et al., 2014; Liu et al., 2016; Wei et al., 2013). Similarly, recent in vitro human studies suggest that immune challenges induce TSPO upregulation in anti-inflammatory M2-like macrophages, and TSPO reduction in inflammatory M1-like macrophages (Narayan et al., 2017; Owen et al., 2017). We previously documented significantly higher CSF concentrations of IL-10 and other anti-inflammatory cytokines in FM patients, as opposed to a more classical (M1-like) pro-inflammatory CSF cytokine profile in patients with rheumatoid arthritis (RA;Kosek et al., 2015; Lampa et al., 2012). Altogether, these observations suggest that the [11C]PBR28 PET signal increases in FM patients might be reflective of a M2-like glial pheno-type, although in the absence of PET tracers with a higher degree of phenotype specificity this remains speculative.
As mentioned above, elevated TSPO during a neuroinflammatory response may colocalize with both microglia and astrocytes, depending on the specific circumstances. As such, the exact cellular contributions of these glial subtypes to the TSPO PET signal are uncertain. In order to disambiguate the celluar specificity of the TSPO elevations observed in this study, a smaller sample of FM patients, partially overlapping with the sample scanned with [11C]PBR28, was evaluated with [11
C]-L -de-prenyl-D2, to quantify brain levels of MAO-B. The expression of this protein in glial cells is thought to be predominantly, if not exclusively, within astrocytes, with little to no contribution from monocytes or microglia (Ekblom et al., 1994). For instance, MAO-B upregulation was found to be colocalized with reactive astrocytes in post-mortem tissues
from patients with AD (Nakamura et al., 1990) and ALS (Ekblom et al., 1993; Ekblom et al., 1994), conditions that also demonstrate elevations in [11
C]-L-deprenyl-D2PET signal (Johansson et al., 2007; Scholl et al., 2015). Because in the current study we observed no group differences in [11
C]-L-deprenyl-D2binding, our data suggest that elevated [11C] PBR28 signal in FM patients might be driven by activated microglia rather than astrocytes. Furthermore, the lack of group differences in [11
C]-L-deprenyl-D2 signal in any of the other anatomically defined brain regions, including whole brain and whole gray matter, suggests that astrocyte activation may not be relevant to the FM pathophy-siology.
In line with our current findings of elevated TSPO PET signal in FM patients, we have previously reported brain TSPO elevations in patients with another pain condition, chronic low back pain (Loggia et al., 2015b). In the cLBP study, we observed a different spatial pattern of glial activation that was localized to the thalamus and areas of the somatosensory and motor cortices consistent with the somatotopic re-presentation of the back and leg, regions in which those participants experienced pain. In the FM patients, by contrast, we observed a pattern which was more spatially extendend, and involved only cortical areas. The larger cortical spread of neuroinflammation in FM patients com-pared to cLBP patients might be reflective of the differences in clinical presentation of these two patient groups, as the former report more widespread pain, and a higher incidence of cognitive issues and affec-tive comorbidities (Clauw, 2014). Of note, the majority of FM patients also report low back pain but, unlike in our previous [11C]PBR28 cLBP study, we did not observe statistically significant elevations in thalamic TSPO PET signal in FM, suggesting that similar pain symptoms in the two disorders may be mediated by distinct mechanisms. On the other hand, TSPO PET signal in the cingulate cortex, which in our FM patients was associated with fatigue scores, was also found to be elevated in patients with chronic fatigue syndrome/myalgic encephalomyelitis (CFS/ME;Nakatomi et al., 2014), suggesting glial activation in this region as a potential mechanism underlying pathological fatigue across different conditions.
Importantly, our results showed that elevated [11C]PBR28 signal in FM, which was initially identified in the main analysis combining da-tasets from two different sites (KI + MGH), could be observed within each site separately in follow-up analyses (Fig. 2). The reproducibility of the effects across sites strengthens confidence in the solidity of our observations. However, we also noticed that the effect sizes for the KI dataset were overall larger compared to those for the MGH dataset. This difference in magnitude of group differences between sites could be a result of several contributing factors, including differences in imaging procedures, e.g., different PET scanners, attenuation correction meth-odology, tracer injection parameters, tracer synthesis, etc. Additionally, patients from the KI site had significantly higher scores on several ACR items, including symptom severity and trouble thinking clearly (Table 2), and were less medicated (Table 3).
Finally, we observed an overlap in the spatial pattern of [11C]PBR28 PET group differences between the SUVR and VTanalyses (Fig. 3), in-dicating that these analytical techniques may have similar abilities to detect regions exhibiting neuroinflammation in FM. This observation is in accordance with previous studies comparing [11C]PBR28 metrics computed with (e.g., VT, DVR) or without (e.g., SUVR) an arterial input function in different populations (Albrecht et al., 2017; Lyoo et al., 2015). While in the current study we also observed significant positive correlations between SUVR and VTin several cortical regions, it should be noted that an association between these metrics has not been con-sistently observed in the literature (Matheson et al., 2017). A more thorough investigation of the relationship between SUVR and VT is warranted to better understand this discrepancy across studies.
There are several caveats to take into consideration when inter-preting results of the current study. In our voxelwise analyses, we im-plemented a cluster-forming threshold of z > 2.3, which has been criticized by some for being susceptible to false positives (Eklund et al.,
2016). However, we were able to show elevations in [11C]PBR28 signal independently for each study site, indicating that the effect is likely to be the result of a true physiological effect. Additionally, in the analyses evaluating the association between [11C]PBR28 signal and clinical variables, no correction for multiple comparisons was utilized. While we feel that this exploratory approach is warranted, given that this is the first study demonstrating TSPO signal elevations in FM, the clinical significance of [11C]PBR28 signal elevation in FM awaits further in-vestigation. Furthermore, the ACR data for all KI patients and 2 MGH patients were acquired during the screening visit, but not at the scan visit. Though scores on this questionnaire show temporal stability, it is possible that scores for some patients may have changed between screening and scanning. Finally, the results of the [11
C]-L-deprenyl-D2 analysis should also be interpreted with caution. Importantly, the ab-sence of a significant effect cannot be used as conclusive proof of no difference, especially with a small sample size as in the current study. Further analysis with larger samples will be thus needed to confirm that astrocytes do not have a key role in the pathophysiology of FM.
In conclusion, our work shows that brain levels of the glial marker, TSPO, as measured using [11C]PBR28 PET imaging, are elevated in the cortex of FM patients relative to healthy controls. Furthermore, we found an association between the TSPO PET signal and fatigue, a pre-dominant FM symptom. The lack of elevated [11
C]-L-deprenyl-D2 binding in FM may be viewed as support of an involvement of micro-glial, rather than astrocytic, activation. Future studies will need to test whether glial modulation may be a viable therapeutic strategy for FM.
Acknowledgments
The authors would like to thank Grae Arabasz, Shiley Hsu, Regan Butterfield, Judit Sore, Patricia McCarthy, Marlene Wentworth, Jiaxuan (Jessie) Wang, Amy Kendall, Natacha Nortelus, and Atreyi Saha (MGH) and Carola Skärvinge, Maria Ahlsén, Karin Sahlander and Nina Knave (KI). We also thank the A. A. Martinos Center for Biomedical Imaging and the Stockholm Spine Center, Stockholm, Sweden for providing re-search facilities for the study and the staff for help with data collection. We are grateful to Lars Farde for engagement in designing and planning the study.
Funding
The study was supported by the following funding sources: International Association for the Study of Pain Early Career Award (MLL), DoD-W81XWH-14-1-0543 (MLL), R01-NS094306-01A1 (MLL), NS095937-01A1 (MLL), R21-NS087472-01A1 (MLL), R01-AR064367 (VN, RRE), R01-AT007550 (VN), Martinos Center Pilot Grant for Postdoctoral Fellows (DSA), Harvard Catalyst Advance Imaging Pilot Grant (JMH), P41RR14075, 5T32EB13180 (T32 sup-porting DSA), and P41EB015896. The Swedish part of the study re-ceived funding from Stockholm County Council (EK), Swedish research Council (K2013-52X-22199-01-3 and 2016-01556) (EK), (2013-9306) (JL), the Swedish Rheumatism Association (EK) and Fibromyalgiförbundet (EK, DK). The research was also funded from the European Union Seventh Framework Programme (FP7/2007-2013) under grant agreement no.602919 (EK, JL) and from a donation from the Lundblad family (EK).
Appendix A. Supplementary data
Supplementary data to this article can be found online athttps:// doi.org/10.1016/j.bbi.2018.09.018.
References
Abourbeh, G., Theze, B., Maroy, R., Dubois, A., Brulon, V., Fontyn, Y., Dolle, F., Tavitian, B., Boisgard, R., 2012. Imaging microglial/macrophage activation in spinal cords of
experimental autoimmune encephalomyelitis rats by positron emission tomography using the mitochondrial 18 kDa translocator protein radioligand [(1)(8)F]DPA-714. J. Neurosci. 32, 5728–5736.
Albrecht, D., Ahmed, S., Kettner, N., Borra, R., Cohen-Adad, J., Deng, H., Houle, T., Opalacz, A., Roth, S., Melo, M.V., 2018. Neuroinflammation of the spinal cord and nerve roots in chronic radicular pain patients. Pain.
Albrecht, D.S., MacKie, P.J., Kareken, D.A., Hutchins, G.D., Chumin, E.J., Christian, B.T., Yoder, K.K., 2016. Differential dopamine function in fibromyalgia. Brain Imaging Behav. 10, 829–839.
Albrecht, D.S., Normandin, M.D., Shcherbinin, S., Wooten, D.W., Schwarz, A.J., Zurcher, N.R., Barth, V.N., Guehl, N.J., Johnson-Akeju, O., Atassi, N., Veronese, M., Turkheimer, F., Hooker, J.M., Loggia, M.L., 2017. Pseudo-reference regions for glial imaging with (11)C-PBR28: investigation in two clinical cohorts. J. Nucl. Med. Alshikho, M.J., Zurcher, N.R., Loggia, M.L., Cernasov, P., Chonde, D.B., Izquierdo Garcia,
D., Yasek, J.E., Akeju, O., Catana, C., Rosen, B.R., Cudkowicz, M.E., Hooker, J.M., Atassi, N., 2016. Glial activation colocalizes with structural abnormalities in amyo-trophic lateral sclerosis. Neurology 87, 2554–2561.
Alshikho, M.J., Zurcher, N.R., Loggia, M.L., Cernasov, P., Reynolds, B., Pijanowski, O., Chonde, D.B., Izquierdo Garcia, D., Mainero, C., Catana, C., Chan, J., Babu, S., Paganoni, S., Hooker, J.M., Atassi, N., 2018. Integrated MRI and [(11) C]-PBR28 PET Imaging in Amyotrophic Lateral sclerosis. Ann. Neurol.
Backryd, E., Tanum, L., Lind, A.L., Larsson, A., Gordh, T., 2017. Evidence of both systemic inflammation and neuroinflammation in fibromyalgia patients, as assessed by a multiplex protein panel applied to the cerebrospinal fluid and to plasma. J. Pain Res. 10, 515–525.
Bae, K.R., Shim, H.J., Balu, D., Kim, S.R., Yu, S.W., 2014. Translocator protein 18 kDa negatively regulates inflammation in microglia. J. Neuroimmune Pharmacol. 9, 424–437.
Beck, A.T., Ward, C.H., Mendelson, M., Mock, J., Erbaugh, J., 1961. An inventory for measuring depression. Arch. Gen. Psychiatry 4, 561–571.
Bennett, R.M., Friend, R., Jones, K.D., Ward, R., Han, B.K., Ross, R.L., 2009. The revised fibromyalgia impact questionnaire (FIQR): validation and psychometric properties. Arthritis Res. Ther. 11, R120.
Canat, X., Carayon, P., Bouaboula, M., Cahard, D., Shire, D., Roque, C., Le Fur, G., Casellas, P., 1993. Distribution profile and properties of peripheral-type benzodia-zepine receptors on human hemopoietic cells. Life Sci. 52, 107–118.
Chen, M.K., Guilarte, T.R., 2006. Imaging the peripheral benzodiazepine receptor re-sponse in central nervous system demyelination and remyelination. Toxicol. Sci. 91, 532–539.
Clauw, D.J., 2014. Fibromyalgia: a clinical review. JAMA 311, 1547–1555. Clow, A., Glover, V., Sandler, M., 1985. Triazolam, an anomalous benzodiazepine
re-ceptor ligand: in vitro characterization of alprazolam and triazolam binding. J. Neurochem. 45, 621–625.
Cohen, J., 1988. Statistical Power Analysis for the Behavioral Sciences. L. Erlbaum Associates, Hillsdale, N.J.
Collste, K., Forsberg, A., Varrone, A., Amini, N., Aeinehband, S., Yakushev, I., Halldin, C., Farde, L., Cervenka, S., 2016. Test-retest reproducibility of [(11)C]PBR28 binding to TSPO in healthy control subjects. Eur. J. Nucl. Med. Mol. Imaging 43, 173–183. Cosenza-Nashat, M., Zhao, M.L., Suh, H.S., Morgan, J., Natividad, R., Morgello, S., Lee,
S.C., 2009. Expression of the translocator protein of 18 kDa by microglia, macro-phages and astrocytes based on immunohistochemical localization in abnormal human brain. Neuropathol. Appl. Neurobiol. 35, 306–328.
Cselenyi, Z., Olsson, H., Farde, L., Gulyas, B., 2002. Wavelet-aided parametric mapping of cerebral dopamine D2 receptors using the high affinity PET radioligand [11C]FLB 457. Neuroimage 17, 47–60.
Datta, G., Colasanti, A., Rabiner, E.A., Gunn, R.N., Malik, O., Ciccarelli, O., Nicholas, R., Van Vlierberghe, E., Van Hecke, W., Searle, G., Santos-Ribeiro, A., Matthews, P.M., 2017. Neuroinflammation and its relationship to changes in brain volume and white matter lesions in multiple sclerosis. Brain 140, 2927–2938.
Dehghan, M., Schmidt-Wilcke, T., Pfleiderer, B., Eickhoff, S.B., Petzke, F., Harris, R.E., Montoya, P., Burgmer, M., 2016. Coordinate-based (ALE) meta-analysis of brain ac-tivation in patients with fibromyalgia. Hum. Brain Mapp. 37, 1749–1758. Ekblom, J., Jossan, S.S., Bergstrom, M., Oreland, L., Walum, E., Aquilonius, S.M., 1993.
Monoamine oxidase-B in astrocytes. Glia 8, 122–132.
Ekblom, J., Jossan, S.S., Oreland, L., Walum, E., Aquilonius, S.M., 1994. Reactive gliosis and monoamine oxidase B. J. Neural Transm. Suppl. 41, 253–258.
Eklund, A., Nichols, T.E., Knutsson, H., 2016. Cluster failure: why fMRI inferences for spatial extent have inflated false-positive rates. PNAS 113, 7900–7905. Flodin, P., Martinsen, S., Lofgren, M., Bileviciute-Ljungar, I., Kosek, E., Fransson, P.,
2014. Fibromyalgia is associated with decreased connectivity between pain- and sensorimotor brain areas. Brain Connect. 4, 587–594.
Forsberg, A., Cervenka, S., Jonsson Fagerlund, M., Rasmussen, L.S., Zetterberg, H., Erlandsson Harris, H., Stridh, P., Christensson, E., Granstrom, A., Schening, A., Dymmel, K., Knave, N., Terrando, N., Maze, M., Borg, J., Varrone, A., Halldin, C., Blennow, K., Farde, L., Eriksson, L.I., 2017. The immune response of the human brain to abdominal surgery. Ann. Neurol. 81, 572–582.
Fowler, J.S., Wang, G.J., Logan, J., Xie, S., Volkow, N.D., MacGregor, R.R., Schlyer, D.J., Pappas, N., Alexoff, D.L., Patlak, C., et al., 1995. Selective reduction of radiotracer trapping by deuterium substitution: comparison of 11-L-deprenyl and carbon-11-deprenyl-D2 for MAO B mapping. J. Nucl. Med. 36, 1255–1262.
Gehlert, D.R., Yamamura, H.I., Wamsley, J.K., 1985. Autoradiographic localization of “peripheral-type” benzodiazepine binding sites in the rat brain, heart and kidney. Naunyn-Schmiedeberg's Arch. Pharmacol. 328, 454–460.
Gracely, R.H., Petzke, F., Wolf, J.M., Clauw, D.J., 2002. Functional magnetic resonance imaging evidence of augmented pain processing in fibromyalgia. Arthritis Rheum. 46, 1333–1343.
![Fig. 1. Voxelwise group differences in [ 11 C]PBR28 V T . A: Surface projection maps displaying areas with significantly elevated [ 11 C]PBR28 V T in FM patients compared to controls (FM – n = 11; HC – n = 11) in voxelwise analyses (KI-only sample)](https://thumb-eu.123doks.com/thumbv2/5dokorg/5519817.143981/4.892.111.786.645.1001/voxelwise-differences-surface-projection-displaying-significantly-elevated-voxelwise.webp)
![Fig. 2. Voxelwise group differences in [ 11 C]PBR28 SUVR A. Surface projection maps displaying areas with significantly elevated [ 11 C]PBR28 SUVR in FM patients compared to controls (FM – n = 31; HC – n = 27), in voxelwise analyses (KI + MGH sample)](https://thumb-eu.123doks.com/thumbv2/5dokorg/5519817.143981/5.892.109.782.695.1026/voxelwise-differences-surface-projection-displaying-significantly-elevated-voxelwise.webp)

![Fig. 5. Absence of group differences in [ 11 C]- L -deprenyl-D 2 λk 3 . Four re- re-presentative regions showing significant group differences in the [ 11 C]PBR28 SUVR analysis (Fig](https://thumb-eu.123doks.com/thumbv2/5dokorg/5519817.143981/8.892.115.396.153.622/absence-differences-deprenyl-presentative-regions-significant-differences-analysis.webp)
