On the deformation behavior and
cracking of ductile iron; effect of
microstructure
Doctoral Thesis
Keivan Amiri Kasvayee
Jönköping University School of Engineering
Doctoral Thesis in Materials and Manufacturing
On the deformation behavior and cracking of ductile iron; effect of microstructure
Dissertation Series No. 27 © 2017 Keivan Amiri Kasvayee Published by
School of Engineering, Jönköping University P.O. Box 1026
SE-551 11 Jönköping, Sweden Tel.: +46 36 101000
www.ju.se
Printed by Ineko AB, year 2017 ISBN 978-91-87289-28-6
“The most beautiful thing we can experience is the mysterious.
It is the source of all true art and science.”
‐ Albert Einstein
ABSTRACT
This thesis focuses on the effect of microstructural variation on the mechanical properties and deformation behavior of ductile iron. To research and determine these effects, two grades of ductile iron, (i) GJS-500-7 and (ii) high silicon GJS-500-14, were cast in a geometry containing several plates with different section thicknesses in order to produce microstructural variation. Microstructural investigations as well as tensile and hardness tests were performed on the casting plates. The results revealed higher ferrite fraction, graphite particle count, and yield strength in the high silicon GJS-500-14 grade compared to the GJS-500-7 grade.
To study the relationship between the microstructural variation and tensile behavior on macro-scale, tensile stress-strain response was characterized using the Ludwigson equation. The obtained tensile properties were modeled, based on the microstructural characteristics, using multiple linear regression and analysis of variance (ANOVA). The models showed that silicon content, graphite particle count, ferrite fraction, and fraction of porosity are the major contributing factors that influence tensile behavior. The models were entered into a casting process simulation software, and the simulated microstructure and tensile properties were validated using the experimental data. This enabled the opportunity to predict tensile properties of cast components with similar microstructural characteristics.
To investigate deformation behavior on micro-scale, a method was developed to quantitatively measure strain in the microstructure, utilizing the digital image correlation (DIC) technique together with in-situ tensile testing. In this method, a pit-etching procedure was developed to generate a random speckle pattern, enabling DIC strain measurement to be conducted in the matrix and the area between the graphite particles. The method was validated by benchmarking the measured yield strength with the material’s standard yield strength.
The microstructural deformation behavior under tensile loading was characterized. During elastic deformation, strain mapping revealed a heterogeneous strain distribution in the microstructure, as well as shear bands that formed between graphite particles. The crack was initiated at the stress ranges in which a kink occurred in the tensile curve, indicating the dissipation of energy during both plastic deformation and crack initiation. A large amount of strain localization was measured at the onset of the micro-cracks on the strain maps. The micro-cracks were initiated at local strain levels higher than 2%, suggesting a threshold level of strain required for micro-crack initiation.
A continuum Finite Element (FE) model containing a physical length scale was developed to predict strain on the microstructure of ductile iron. The material parameters for this model were calculated by optimization, utilizing the Ramberg-Osgood equation. The predicted strain maps were compared to the strain maps measured by DIC, both qualitatively and quantitatively. To a large extent, the strain maps were in agreement, resulting in the validation of the model on micro-scale. In order to perform a micro-scale characterization of dynamic deformation behavior, local strain distribution on the microstructure was studied by performing in-situ cyclic tests using a scanning electron microscope (SEM). A novel method, based on the focused ion beam (FIB) milling, was developed to generate a speckle pattern on the microstructure of the ferritic ductile iron (GJS-500-14 grade) to enable quantitative DIC strain measurement to be performed. The results showed that the maximum strain concentration occurred in the vicinity of the micro-cracks, particularly ahead of the micro-crack tip.
Keywords: Spherical graphite iron, component casting, high silicon ductile iron, digital image
correlation (DIC), in-situ tensile testing, in-situ cyclic testing, DIC pattern generation, pit etching, micro-scale deformation, micro-crack, finite element analysis (FEA), focused ion beam (FIB) milling.
SAMMANFATTNING
Denna avhandling fokuserar på effekten av variationer i mikrostrukturen på mekaniska egenskaper och deformationsbeteende hos segjärn. För att undersöka dessa effekter, två olika sorter av segjärn, (i) GJS-500-7 och (ii) högkisellegerad GJS-500-14, gjutits till plattor av olika tjocklekar för att generera mikrostrukturvariationen. Mikrostrukturundersökning, samt drag- och hårdhetsprov gjordes på de gjutna plattorna. Resultaten visade att en högre ferritfraktion, grafitpartikelantal och sträckgräns i den högkisellegerade GJS-500-14-sorten jämfört med GJS-500-7.
För att studera förhållandet mellan mikrostrukturell variation och spännings-töjningsbeteendet på makroskala, modellerades detta med hjälp av Ludwigson-ekvationen. De erhållna spännings-töjningsegenskaperna modellerades baserat på mikrostrukturell karaktäristika genom multipel linjär regression och variansanalys (ANOVA). Modellerna visade att kiselhalt, grafitpartikelantal, ferritfraktion och porfraktion var de viktigaste bidragande faktorerna. Modellerna implementerades i ett simuleringsprogram för gjutningsprocessen. Resultatet från simuleringen validerades med hjälp av experimentella data som inte ingick i underlaget för regressionsanalysen. Detta möjliggjorde att prediktera spännings-töjningsbeteendet och dess variation hos gjutna segjärns komponenter med liknande sammansättning och gjutna tjocklekar som användes i denna studie.
För att kunna undersöka deformationsbeteendet på mikroskala utvecklades en metod för kvantitativ mätning av töjning i mikrostrukturen, genom DIC-tekniken (digital image correlation) tillsammans med in-situ dragprovning. I denna metod utvecklades en grop-etsningsprocess för att generera ett slumpvis prickmönster, vilket möjliggjorde DIC-töjningsmätning i matrisen och i området mellan grafitpartiklarna med tillräcklig upplösning. Metoden validerades genom benchmarking av den uppmätta sträckgränsen mot materialets makroskopiska sträckgräns mätt med konventionell dragprovning.
Det mikrostrukturella deformationsbeteendet under dragbelastning karakteriserades. Under elastisk deformation avslöjade töjningsmönstret en heterogen töjningsfördelning i mikrostrukturen, och bildandet av skjuvband mellan grafitpartiklar. Sprickbildning initierades vid låg spänning och redan vid de spänningsnivåer som ligger vis ”knät” på dragprovningskurvan, vilket indikerar energidissipering genom både begynnande plastisk deformation och sprickbildning. Den lokala töjningen vis sprickinitiering skedde då den lokala töjningen översteg 2%, vilket indikerar att detta skulle kunna vara en tröskelnivå för den töjning som erfordras för initiering av mikro-sprickor. En kontinuum Finita Element (FE) modell utvecklades för att prediktera töjningen hos ett segjärn och dess fördelning i segjärns mikrostruktur. Materialparametrarna för denna modelloptimerades genom att anpassa parametrarna i Ramberg-Osgood ekvationen. De predikterade töjningsfördelningarna jämfördes med de experimentell uppmätta töjningsmönstren uppmätta med DIC, både kvalitativt och kvantitativt. Töjningsmönstren överensstämde i stor utsträckning, vilket resulterade i att modellerna kunde anses vara validerade på mikronivå.
För att kunna mäta töjningsmönster under dynamiska förlopp på mikronivå utvecklades en metod för att skapa prickmönster och att utföra in-situ CT provning i ett svepeletronmikroskop (SEM). Prickmönstret skapades genom avverkning med en fokuserad jonstråle (FIB), och provades på det ferritiska segjärnet (GJS-500-14 grad). Resultaten visade att maximal töjningskoncentration fanns i närheten av mikrosprickorna, framförallt framför sprickspetsen.
Nyckelord: segjärn, komponentgjutning, högkisellegerat segjärn, digital image correlation (DIC), in-situ dragprovning, in-in-situ cyklisk provning, DIC-mönstergenerering, grop-etsning, mikroskalig deformation, mikrosprickor, finite element analys (FEA), fokuserad jonstråle (FIB) avverkning.
ACKNOWLEDGEMENTS
I would like to express my sincere appreciation to all the people who have helped me along the way during my PhD studies.
I express my sincere appreciation to my main supervisor, Professor Anders E.W. Jarfors, for his vast support, insightful advice, original ideas, valuable education, and motivation during my studies. My sincere gratitude is extended to my co-supervisor, Dr. Ehsan Ghassemali, for his support, experimental help, guidance in the writing process, and insightful discussions.
I extend my sincere gratitude to my co-supervisor, Associate Professor Kent Salomonsson, for his invaluable work in performing finite element analysis simulations and his patience in teaching me. I would like to thank my former co-supervisor Assistant Professor Lennart Elmquist for his brilliant guidance and assistance in initiating this work.
My sincere gratitude is offered to our present and former department technician team, comprising Toni Bogdanoff, Lars Johansson, Esbjörn Ollas, Jörgen Bloom, Peter Gunnarsson, and Jacob Steggo, for their great technical assistance.
The industrial partners SKF Mekan AB and Nya Arvika Gjuteri AB, along with their helpful staff, are greatly acknowledged for providing the casting material for the project.
The Knowledge Foundation is acknowledged for financial support as part of the CompCAST project (20100280).
The Singapore Ministry of Education (MOE), Academic Research Funding (AcRF) Tier 1 Grant RG26/12 is acknowledged for their financial support of the tasks performed at Nanyang Technological University, Singapore.
I would like to thank all of my friends and colleagues at Jönköping University for creating such a pleasant and inspiring working environment.
Lastly, I would like to express my sincere gratitude to my beloved family, especially my parents, for their constant love and support during my doctoral studies.
SUPPLEMENTS
The following supplements constitute the basis of this thesis:
Supplement I K.A. Kasvayee, E. Ghassemali, I.L. Svensson; J. Olofsson, A.E.W. Jarfors. Characterization and modeling of the mechanical
behavior of high silicon ductile iron, Manuscript, to be submitted
for journal publication, 2017.
K. Kasvayee was the main author and performed the experimental work. E. Ghassemali contributed with the advice and experimental work. I.L. Svensson contributed the tensile data analysis and modeling. J. Olofsson assisted with empirical modeling and simulation. A.E:W. Jarfors contributed with advice regarding the experiment.
Supplement II K.A. Kasvayee, L. Elmquist, A.E. Jarfors, E. Ghassemali.
Development of a pattern making method for strain measurement on microstructural level in ferritic cast iron, 23rd
International Conference on Processing and Fabrication of Advanced Materials (PFAM-XXIII), Roorkee, India, December 5-7, 2014. K.A. Kasvayee was the main author and performed the experimental work. L. Elmquist, A.E.W. Jarfors, and E. Ghassemali contributed advice regarding the experiment.
Supplement III K.A. Kasvayee, K. Salomonsson, E. Ghassemali, A.E.W. Jarfors.
Microstructural strain distribution in ductile iron; comparison between finite element simulation and digital image correlation measurements, Materials Science and Engineering: A 655 (2016)
27-35.
K.A. Kasvayee was the main author and performed the experimental work. K. Salomonsson performed the optimization and FE simulation. E. Ghassemali and A.E.W. Jarfors contributed with advice regarding the data analysis.
Supplement IV K.A. Kasvayee, E. Ghassemali, A.E.W. Jarfors. Micro‐Crack
initiation in high silicon cast iron during tension loading,
TMS2015 Supplemental Proceedings 947-953.
K.A. Kasvayee was the main author and performed the experimental work. E. Ghassemali and A.E.W. Jarfors contributed with advice regarding the experiment.
Supplement V K.A. Kasvayee, E. Ghassemali, K. Salomonsson, S. Sujakhu, S. Castagne, A.E.W. Jarfors. Strain localization and crack formation
effects on stress-strain response of ductile iron, Materials Science
and Engineering: A 702 (2017) 265-271.
K.A. Kasvayee was the main author and performed the experimental work. E. Ghassemali, contributed with advice and SEM imaging. K. Salomonsson and A.E.W. Jarfors contributed with advice regarding the experimental methodology and analysis. S. Sujakhu and Castagne contributed with advice regarding the experimental procedure.
Supplement VI K.A. Kasvayee, E. Ghassemali, K. Salomonsson, S. Sujakhu, S. Castagne, A.E.W Jarfors. Microstructural strain mapping during
in-situ cyclic testing of ductile iron, Manuscript, to be submitted
for journal publication, 2017.
K.A. Kasvayee was the main author and performed the experimental work. E. Ghassemali contributed with advice and support regarding the experimental work. S. Sujakhu and S. Castagne contributed with the advice regarding the experimental procedure. K. Salomonsson and A.E.W. Jarfors contributed with advice regarding the experiment.
In addition, the following works were made, but not included in the thesis:
K.A. Kasvayee, M. Ciavatta, E. Ghassemali, I.L. Svensson, A.E.W. Jarfors, Effect of Boron
and Cross-section Thickness on Microstructure and Mechanical Properties of Ductile Iron, 10th International Symposium on the Science and Processing of Cast Iron –
SPCI11 2017.
M. Segolle, J. Santos, K.A. Kasvayee, A.E. Jarfors, Etching Method to create a Random
Speckle Pattern on Semi-Solid Cast A356 Aluminium for DIC in-situ strain measurements, Journal of Casting & Materials Engineering 1(1) (2017) 33.
S. Sujakhu, S. Castagne, M. Sakaguchi, K.A. Kasvayee, E. Ghassemali, A.E.W. Jarfors, W. Wang, Micromechanisms investigation on fatigue crack initiation and propagation
in high silicon spheroidal graphite cast iron, 8th Low Cycle Fatigue, Dresden,
Germany, 2017.
S. Sujakhu, S. Castagne, M. Sakaguchi, K.A. Kasvayee, E. Ghassemali, A.E.W. Jarfors, W. Wang, On the fatigue damage micromechanisms in Si-solution-strengthened
spheroidal graphite cast iron, Accepted for publication in the journal of Fatigue &
TABLE OF CONTENTS
INTRODUCTION ... 1
1.1 BACKGROUND AND MOTIVATION ... 1
1.2 MICROSTRUCTURE OF DUCTILE IRON... 2
1.3 SOLIDIFICATION OF DUCTILE IRON ... 4
1.4 MECHANICAL PROPERTIES OF DUCTILE IRON ... 6
1.5 HIGH SILICON DUCTILE IRON ... 7
1.6 DEFORMATION BEHAVIOR OF DUCTILE IRON ... 7
1.6.1 Microstructural deformation ... 7
1.6.2 Crack initiation and propagation ... 8
1.6.3 Fracture surface ... 9
1.7 DIGITAL IMAGE CORRELATION ... 10
1.7.1 Background ... 10
1.7.2 Speckle pattern ... 10
1.7.3 Subset and spatial resolution ... 11
1.7.4 Fundamentals of DIC ... 12
1.7.5 Application area ... 13
1.8 MICROSTRUCTRAL DEFORMATION SIMULATION ... 13
RESEARCH APPROACH ... 15
2.1 AIM ... 15
2.2 RESEARCH DESIGN ... 15
2.2.1 Research perspective ... 15
2.2.2 Research questions ... 16
2.3 MATERIAL AND EXPERIMENTAL PROCEDURE ... 18
2.3.1 Material ... 18
2.3.2 Microstructural analysis ... 19
2.3.3 Standard tensile testing ... 21
2.3.4 Hardness testing ... 21
2.3.5 In-situ tensile testing ... 21
2.3.6 In-situ cyclic testing ... 22
2.3.7 Fractography ... 23
2.3.8 Digital image correlation ... 23
2.4 MODELING OF TENSILE PROPERTIES ... 24
2.6 FE SIMULATION OF TENSILE DEFORMATION ... 24
2.6.1 Optimization of the materials parameters ... 24
2.6.2 FE simulation ... 25
SUMMARY OF RESULTS AND DISCUSSION ... 27
3.1 MICROSTRUCTURAL CHARACTERIZATION (SUPPLEMENTS I AND II) ... 27
3.2 CHARACTERIZATION OF MECHANICAL PROPERTIES (SUPPLEMENTS I, II, AND III) ... 30
3.3 FRACTOGRAPHY (SUPPLEMENT I) ... 31
3.1 PREDICTION OF OVERALL TENSILE BEHAVIOR (SUPPLEMENT I) ... 34
3.2 DEVELOPMENT OF A METHOD FOR LOCAL STRAIN MEASUREMENT (SUPPLEMENTS II AND III) 39 3.2.1 Speckle pattern generation ... 39
3.2.2 Evaluation of the DIC measurements ... 41
3.2.3 Speckle pattern on a ferritic-pearlitic microstructure ... 45
3.2.4 Advantages and disadvantages of the pit-etching procedure ... 45
3.3 MICROSTRUCTURAL DEFORMATION DURING MONOTONIC TENSILE LOADING (SUPPLEMENTS III, IV, AND V) ... 45
3.3.1 Microstructural strain distribution prior to cracking ... 46
3.3.2 Simulation of tensile behavior ... 46
3.3.3 Microstructural crack initiation ... 50
3.3.4 Localized strain at the onset of cracking (Supplements IV and V) ... 53
3.3.5 Effect of cracking on overall stress-strain response ... 56
3.4 MICROSTRUCTURAL DEFORMATION DURING CYCLIC LOADING (SUPLEMENT VI) ... 57
3.4.1 Speckle pattern generation ... 57
3.4.2 Evaluation of DIC measurements ... 59
3.4.3 Microstructural strain distribution ... 59
CONCLUDING REMARKS ... 63
FUTURE WORK ... 65
INTRODUCTION
CHAPTER INTRODUCTION
This chapter describes the background for the current work by focusing on the fundamental, microstructural, crack-evolution, and deformation properties of ductile iron, as well as considerations relating to such simulations.
1.1 BACKGROUND AND MOTIVATION
Ductile iron is a group of ferrous materials within the cast iron family that contain nodular graphite particles, and is also known as nodular iron or spheroidal graphite (SG) iron [1]. It was discovered
Nomenclature
ANOVA Analysis of Variance DIC Digital Image Correlation
DP Diamond Particles
EBSD Electron Backscatter Diffraction EDM Electrical Discharge Machining EDS Energy Dispersive Spectrometry
FE Finite Element
FEM Finite Element Method
FIB Focused Ion Beam
FOV Field of View
NND Nearest Neighbor Distance
RVE Representative Volume Element
SF Shape Factor
SS Subset Size
SSR Strain Spatial Resolution
ST Step Size
UTS Ultimate Tensile Strength VSG Virtual Strain Gauge
in 1943 by Keith Dwight Millis, by adding magnesium (Mg) as a graphite spherodizer to a cast iron melt. In 1949, H. Morrogh [2], of the British Cast Iron Association, patented the process of changing the lamellar graphite of gray cast iron into a spherical shape using cerium. Later that year, another patent application by Keith D. Millis, Albert P. Gegnebin, and Norman B. Pilling was granted and used for the production of ductile iron [3].
Ductile iron is the second most frequently cast material in the world, with 25.5 million metric tons cast (i.e. used for cast components) in 2015 [4]. It has outstanding properties, such as high strength and toughness and good castability and machinability, as well as a competitive production price in comparison to classical gray cast iron [5]. These desirable properties have made ductile iron a strong candidate for a wide variety of applications, such as agricultural tools, pipes, gearboxes, crankshafts, transportation casks, bearing housing, and car hub retainers. [6]
Ductile iron is a multiphase material containing graphite particles as secondary phases (7-15 Vol.%) in the matrix. Graphite particles can act as stress concentrators that cause cracking at the graphite-matrix interface during deformation [7]. The size, morphology, and distribution of the graphite particles, as well as the matrix phase, can vary locally in a cast component, depending on process conditions (e.g. cooling rate variation in sections with different thicknesses) [8]. The mechanical properties of ductile iron vary greatly based on its microstructure, so that even a small microstructural variation can result in a large change in the mechanical properties [9]. Therefore, a strong heterogeneity can be obtained in a component in terms of local mechanical properties through the microstructural variation; this, in turn, can affect macroscopic mechanical properties. In the design process of a ductile iron cast component, one of the most critical concerns is whether the local properties of the component are sufficient to withstand the local loading conditions. In other words, what properties need to be enhanced in the microstructure in order for the iron to withstand local loading conditions? Answering this question requires investigating the relationship between the three aspects of the microstructure, mechanical properties, and deformation behavior under different types of loading (e.g. monotonic or cyclic).
An understanding of the yielding and cracking behavior of the material on a micro-scale is crucial for microstructural optimization and moving toward more durable products. This understanding can increase a product’s lifespan, reducing carbon emissions by decreasing, for example, the need to remanufacture products. Furthermore, this understanding can be used to develop and validate multi-scale models to predict the overall and local behavior of a cast component in operation. Practical models can be used for process simulation and optimization, which reduce prototyping costs within the chain of product development. Considering the global mass production of ductile iron, improving the financial and environmental aspects of related product development can have a substantial impact on both sustainability and society. All in all, the experimental and computational investigations presented herein are an attempt to provide the guidelines necessary for producing cast components with higher stiffness and lower weight, thus enhancing the sustainability of products.
1.2 MICROSTRUCTURE OF DUCTILE IRON
Ductile iron is a ternary Fe-C-Si alloy, with C and Si content typically in the ranges of 3.5-3.9 Wt.% and 1.8-2.8 Wt.%, respectively. During solidification, the carbon in excess of the solubility in solid iron forms carbon-rich phases such as Fe3C (cementite) and graphite particles. Nodular graphite can be produced by adding a small amount of Mg (typically in the range of 0.03-0.08 Wt.%) or rare-earth elements to the cast iron during melt treatment.
Studying the microstructure of ductile iron can reveal a variety of properties, such as its chemistry, cooling rate, matrix structure (ferritic, pearlitic, etc.), nodule count, nodularity, graphite floatation, metal quality, inoculation, Mg content, and material composition (e.g. carbon equivalent), as well as the presence of chunky/flake graphite [10].
The microstructure of ductile iron can be influenced at three distinct stages during the production process: (i) melt treatment, (ii) solidification, and (iii) heat treatment [11]. (i) Melt treatment is the process of adding formulated alloys to the molten metal in the furnace, pouring ladle, or mold. Inoculation and modification are commonly performed during the melt treatment of ductile iron in order to increase the number of nuclei during solidification, and to alter the graphite morphology (i.e. from lamellar to nodular), respectively. (ii) During solidification, the microstructure can be altered by the cooling rate and chemical composition. Cooling rate is the rate at which the melt’s temperature decreases over time, and is significantly impacted by section size. The cooling rate has a considerable effect on microstructure and, thus, ductile iron’s mechanical properties. A higher cooling rate results in a finer structure (e.g. finer graphite particles, dendrites, and eutectic grains) and higher carbide tendency. Chemical composition can affect solidification by changing the equilibrium conditions in the phase diagram, changing the degree of undercooling and promoting a specific matrix phase/structure (i.e. the ferrite phase). (iii) Heat treatment can alter the matrix structure (e.g. ferritic, bainitic, or martensitic) or change the morphology and size of the graphite [10, 12].
Figure 1 shows a typical micrograph of ductile iron, which contains graphite, a ferritic phase, and a pearlitic structure. Dark gray graphite nodules covered with a white ferritic phase in ductile iron matrix are called “bull’s eyes” [13].
Figure 1. A typical as cast ductile iron microstructure, containing nodular graphite (dark gray) embedded in a ferritic (white) and pearlitic (light gray) matrix.
The mechanical properties of ductile iron highly depend on the type of matrix phase, alloying elements, and amount and shape of the graphite particles. Typically, increasing the amount of ferrite in the matrix can lead to a higher ductility but reduce strength and hardness. By contrast, a higher pearlite content can increase strength and hardness, at the cost of lower ductility [12, 14]. In order to minimize the amount of pearlite in ductile iron, the amount of pearlite promoting elements (e.g. Cu, Mn, Sn, Cr) should be minimized, and ferrite promoting elements (e.g. Si) should be maximized [15, 16].
The general shape of the graphite particles (nodularity), number of nodules per unit area (nodule count), and overall graphite volume can all affect the mechanical properties of ductile iron [17, 18]. In general, higher nodularity results in higher ductility and strength [14]. The amount and type of alloying elements can affect the mechanical properties of the ductile iron by changing the matrix
phase, nodularity, and nodule count. In addition, alloying elements can lead to changes in the properties by, for example, contributing to solid solution hardening, changing the interlamellar spacing of pearlite, or stabilizing austenite at low temperatures [13].
1.3 SOLIDIFICATION OF DUCTILE IRON
The iron-carbon phase diagram presented in Figure 2 can illustrate the solidification process of ductile iron under equilibrium conditions [9]. Ductile iron solidifies as a result of a eutectic reaction in which liquid phase transforms into a mixture of two solid phases. An iron-carbon system with a C fraction of 4.3 Wt.% undergoes a eutectic reaction at 1130˚C, at which liquid iron transforms directly into austenite and cementite.
The inoculation potential and composition determine the graphitization potential of the melt, denotes the ability of a cast iron alloy to produce a graphite phase. A high graphitization potential means that the carbon content will solidify as a graphite phase, while a low graphitization potential results in the formation of iron carbide. The graphitization potential of the alloying elements can be evaluated thermodynamically by considering the effect of the element on the solubility of carbon in the molten ternary of iron-carbon and the alloying element [19]. All of the elements present in the composition of cast iron affect its graphitization potential, regardless of whether the cast iron solidifies in a stable or metastable manner. Table 1 presents the solubility factor of common cast iron alloying elements. A high negative solubility factor signifies a high graphitization potential, while a high positive one implies a low graphitization potential.
Table 1. Solubility factors of common alloying elements for carbon-saturated Fe-C-alloying element melts [20].
Element Solubility factor Element Solubility factor
C -0.61 Ni -0.051 B -0.54 Ti 0.159 S -0.41 V 0.105 P -0.33 Cr 0.064 Si -0.31 Nb 0.058 Al -0.22 Mn 0.029 Sn -0.11 Mo 0.014 Ni -0.076
Using the solubility factor, the combined effect of carbon (C ), silicon (Si ), phosphorus (P), and sulfur (S) on the structure of cast iron can be calculated by the carbon equivalent (Ceq) equation
(Eq. (1)) [20, 21].
% 0.25 % 0.33 % 0.41 % (1)
Dependent on its chemical composition, ductile iron can be classified as eutectic (Ceq= 4.33),
hypoeutectic (Ceq < 4.33), or hypereutectic (Ceq > 4.33) [10]. The eutectic mixture of austenite and
cementite is known as ledeburite [22]. The eutectoid reaction is defined as a single-parent phase (austenite) decomposing into two different phases (ferrite and cementite) through a diffusional mechanism.
Figure 2. Iron-carbon phase diagram. The X axes indicates the carbon content Wt.% [9].
During solidification, assuming an equilibrium cooling state for a hypereutectic ductile iron melt, the first solid to crystalize from the liquid is the graphite phase. Graphite tends to nucleate in a low energy interface of inclusions or inoculants. The nuclei of nodular graphite are sulfides (MgS, CaS) covered by Mg silicates (e.g. MgO.SiO2) or oxides that have low potency (e.g., CeO2). After inoculation with FeSi (containing Al, Ca, Sr, or Ba), hexagonal silicates (MgO.SiO2 or MgO.Al2O3.2SiO2) form at the surface of the oxides, with coherent/semi-coherent low energy interfaces between the substrate and the graphite [23, 24]. By decreasing the temperature to the eutectic line, graphite particles gradually grow through depletion of carbon from the melt area [9, 25].
During eutectic solidification, graphite nodules and austenite crystals nucleate independently in the liquid and grow together with the hypereutectic graphite nodules until the austenitic matrix engulfs all of the graphite nodules. After the eutectic transformation, further temperature reduction causes an increase in the volume of graphite due to the fact that the solubility of carbon in austenite decreases from 2% at eutectic temperature to 0.8% at eutectoid temperature; consequently, the carbon atoms begin to diffuse toward the preexisting graphite nodules [9, 25].
At temperatures below the eutectoid point, more carbon diffuses to the graphite nodules because of the transformation of austenite to ferrite, which is accompanied by a reduction in carbon solubility to 0.02% (the maximum carbon solubility in ferrite). Ferrite tends to nucleate at the austenite-graphite interface, where the diffusion of carbon into graphite creates a carbon-depleted zone. Further growth of ferrite occurs by diffusion of carbon atoms through the growing ferrite from austenite to graphite. Thus, the resulting equilibrium microstructure is a ferritic matrix that contains graphite particles [9, 26].
The equilibrium microstructure can be achieved only when carbon is given sufficient time and driving force to be diffused into the graphite. At higher cooling rates, the carbon atoms do not have enough time to diffuse during the eutectoid reaction. As a result, cementite nucleates at the ferrite-austenite interface because of the higher carbon content of ferrite-austenite, thus initiating the formation of the pearlite. Pearlite grows faster than ferrite due to a much shorter distance between its
constituents, ferrite and cementite. In other words, beyond a certain level of undercooling, cementite growth prevails over graphite growth, resulting in a higher amount of pearlite being formed during eutectoid phase transformation [9, 26].
1.4 MECHANICAL PROPERTIES OF DUCTILE IRON
The shape of the graphite particles is the main important factor that can affect the mechanical properties of ductile iron. The primary advantage of nodular graphite is its round edges (as compared to the sharp edges of lamellar graphite), which reduce the local stress concentration during deformation. This reduction decreases the overall stress threshold required for crack initiation to occur. Thus, higher toughness, strength, and fatigue resistance can be expected from ductile iron than lamellar graphite iron. [5, 13]. Figure 3 shows the effect of graphite morphology on the tensile and fatigue properties of cast irons [27].
Figure 3. Influence of the graphite morphology on the mechanical properties of cast iron: (a) tensile stress-strain response, (b) tensile strength, elongation, and fatigue strength [27].
The structure of the metal matrix greatly influences the mechanical properties of ductile iron. Depending on the matrix microstructure, ductility and tensile strength can increase up to 18% and 850 MPa, respectively. As cast ductile iron may have pearlitic, ferritic or ferritic-pearlitic microstructure [15, 16]. Ferritic ductile iron is characterized by high ductility, high impact resistance, relatively low strength and hardness, poor wear resistance, relatively good thermal conductivity, and good machinability. By comparison, pearlitic grades typically show moderate ductility, moderate impact resistance, high strength and hardness, good wear resistance, moderate thermal conductivity, and good machinability. In general, ultimate tensile strength tends to increase with an increase in the pearlite content. The properties of pearlitic-ferritic grades, which are the most commonly used, generally fall between those of fully ferritic and fully pearlitic grades [5, 13]. Figure 4 shows a typical tensile curve of ferritic, pearlitic, and ferritic-pearlitic ductile cast iron [28].
Figure 4. Influence of ferrite/pearlite phase fraction on tensile test results [28].
1.5 HIGH SILICON DUCTILE IRON
High silicon ductile iron is a type of ductile iron with a silicon content of approximately 4 Wt.%. Silicon has a strong ferrite promoting tendency with a solid solution effect that increases the hardness, ultimate tensile strength, and yield strength of ferrite, improving the mechanical properties of the alloyed ductile iron [29-31].
In contrast to most alloying elements, silicon segregates into the solid phase during solidification (negative segregation) [13]. This segregation reduces carbon solubility in the ferrite, increasing the amount of graphite that precipitates [9, 13]. The addition of silicon increases the nodule count, consequently reducing the length of the carbon diffusion path during the eutectoid transformation; thus, the amount of ferrite increases in the matrix [9, 32]. However, silicon has a deleterious effect on the shape of the graphite, which needs to be counterbalanced during the production of high silicon ductile iron materials [33].
High silicon ductile iron has better machinability properties comparison to ferritic-pearlitic grades, which is due to its higher hardness uniformity, that relates to its single-phase matrix (ferrite) [33, 34]. In addition to the lower cost of machining, its improved corrosion resistance and higher tensile, yield, and fatigue strengths make high silicon ductile iron an appealing substitute for ordinary ductile iron in industrial applications. However, the low impact resistance (approximately 5 J.cm-2) is a drawback that can limit its applicability in relation to producing cast components [8, 31, 34].
1.6 DEFORMATION BEHAVIOR OF DUCTILE IRON
1.6.1 Microstructural deformation
Although the overall macroscopic deformation response of ductile iron has been regarded as homogeneous, deformation in the microstructure is fully heterogeneous [35, 36]. Guillemer-Neel et al. [37] found that the Bauschinger effect in ductile iron was caused by inhomogeneous deformation between the matrix and graphite particles, which developed a high dislocation density that was originated from the local plastic deformation of the matrix close to the interface. In-situ tensile tests [28, 38, 39] and DIC have been used to measure and characterize deformation and failure on micro-scale level. A strong strain partitioning and localization occurs in the constituent phases and between graphite particles [40-42]. These effects were attributed to local variations in the microstructural features, such as matrix (ferrite or pearlite) and graphite (shape and
size) [43]. Such heterogeneity results in strain localization, leading to a scatter in the resistance of the phases against the micro-crack initiation and propagation.
Ferrite is a high-ductility, low-yield material, while pearlite is a high-strength, low-ductility material. Due to graphite nodules typically being embedded in the soft ferrite phase and acting as local stress raisers, there is a greater accumulation of localized deformation in the ferrite phase than in the pearlite. The lowest level of localized deformation occurs in pearlite areas, as pearlite structures are the strongest components of the microstructure [44].
1.6.2 Crack initiation and propagation
Various micro-mechanisms are responsible for the failure of ductile iron. The common knowledge regarding crack initiation and propagation under monotonic tensile loading can be characterized as follows [45-47]: (i) Development of cracks inside the graphite. (ii) Decohesion between the matrix and the graphite. (iii) Plastic deformation in the matrix around the graphite nodules, creating voids that grow as a result of plastic flow. (iv) Initiation and propagation of micro-cracks in the deformed matrix between graphite nodules. (v) Void coalescence due to failure of void ligaments, caused by micro-cracks (see Figure 5). (vi) Macro-crack formation and propagation, leading to fracture. Figure 5 shows failure micro-mechanisms in the deformed microstructure of a ferritic-pearlitic ductile iron (GJS-500-7 grade) under monotonic tensile loading prior to failure. The micrograph was obtained at 518 MPa, and ultimate tensile strength (UTS) occurred at 521 MPa.
Figure 5. Deformed microstructure of ductile iron under monotonic tensile loading, obtained during the in-situ tensile test. The force was applied in the X direction.
During cyclic or fatigue loading, crack initiation and propagation can be characterized as follows [48-50]: (i) The crack originates at the interface of the matrix-graphite decohesion (voids) (Verdu et al. [51] studied the early stages of fatigue-crack nucleation and growth using synchrotron X-ray tomography, showing that micro-cracks initiate at the graphite nodules decohesion or casting defects in the vicinity of the sample surface. However, most of the micro-cracks were arrested after their length reached the initiating defect size, and thus did not coalesce to form short macro-cracks). (ii) Continuous graphite-matrix decohesion in vicinity of the crack during crack propagation. (iii) Transgranular crack propagation between the graphite particles up to fracture, resulting in fatigue striation on the fracture surface. Here, the spatial distribution of the graphite particles strongly
influences the path of the crack. Figure 6 shows a crack-propagation path in the microstructure of ferritic high-silicon ductile iron (GJS-500-14 grade) under cyclic loading [52].
Figure 6. Fatigue crack propagation in the microstructure of ductile iron (R = 0.1, ΔKStart = 13 MPa√m) [52].
The graphite particles act as a non-metallic secondary phase in the iron matrix of ductile iron. As a fully elastic material, three types of internal cracking were observed in graphite particles during both monotonic and cyclic-loading deformation: (i) decohesion of graphite from the metal matrix, particularly from ferrite, (ii) a radial and transversal crack initiation and propagation at the core zone of graphite nodules (occurring mostly in nodules with lower roundness), and (iii) crack nucleation and growth between the graphite nodule core and outer shell [28, 53].
In the vicinity of the graphite-matrix interface, the difference between the elastic and plastic properties of the two phases can increase the mechanical stress and eventually cause interfacial crack initiation [45]. The irregular surfaces and sharp corners of graphite can promote crack initiation [54, 55]. Stokes et al. [56] considered graphite/matrix decohesion to be the critical micro-mechanism for the initiation and propagation of micro-cracks. This decohesion generally occurred when a perfectly round nodule was surrounded by the ferrite phase [28, 57]. Nevertheless, there have been reports [40, 58] which consider graphite nodules to be rigid spheres that act in the manner of voids and grow with strain, such that their coalescence results in large, equiaxed dimples.
1.6.3 Fracture surface
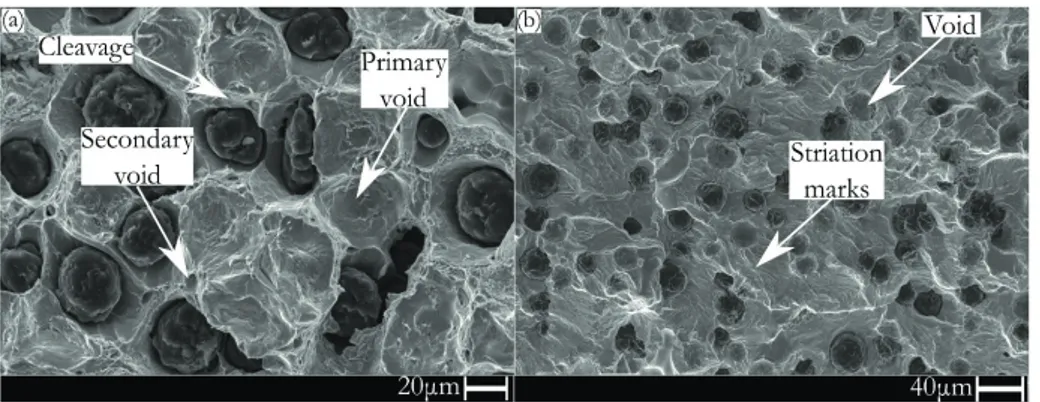
According to the fractographic observations of ferritic/pearlitic ductile iron [40, 59], a fracture surface of monotonic tensile tests consists primarily of the following features: (i) Large primary voids surrounding each graphite nodule in the ferrite phase. Each nodule acts as a void that subsequently grows with strain in a direction parallel to the applied tensile loading. (ii) Voids that are smaller than the primary voids (secondary voids) [60]. These secondary voids were typically observed at the boundaries, where the primary voids met or linked up. Secondary voids can nucleate from small non-metallic inclusions (e.g. MgO, Al2O3) in the matrix. (iii) Cleavage fractures between the void ligaments, which form mainly in the pearlitic area. (iv) Cleavage fractures in the matrix and graphite particles that contain river marks (relating to the final rapid brittle fracture) [7, 40].
The fracture surface of ductile iron after cyclic loading can contain the following features [61, 62]: (i) voids relating to the decohesion of the graphite particles from the matrix, similar to the micro-void growth relating to dimple formation; (ii) secondary cracks; (iii) intergranular and transgranular fractures, with or without striation marks (particularly in the ferrite) [63]. (iv) cleavage fracturs of the ferritic shields around the graphite particles.
Figure 7 shows a typical fracture surface of a high silicon ductile iron (GJS-500-14 grade) after monotonic tensile loading (Figure 7(a)) and cyclic loading (Figure 7(b)). Note that the matrix of the material was fully ferritic.
Figure 7. Fracture surface of a fully ferritic high silicon ductile iron GJS-500-14 grade after: (a) monotonic tensile loading, and (b) fatigue loading [52].
1.7 DIGITAL IMAGE CORRELATION 1.7.1 Background
Digital image correlation (DIC) is an optical-numerical measurement technique for determining complex displacement and strain fields on the surface of a material that is under any kind of loading [64]. DIC was developed by a group of researchers at the University of South Carolina in the 1980s [65, 66]. The distinct advantage of DIC over conventional extensometers is the full-field strain measurement, which can provide quantitative strain values across a broad range of length scales [64].
In general, a DIC software correlates the gray values of a reference (undeformed) image with a post-deformation image to determine displacement and strain in the latter. The measurement can be made by comparing a series of images that are captured over a defined period of time. Moreover, it is possible to measure displacements on different scales. For example, microscope images can be used for measuring micro- and nano-scale displacements [67].
DIC can be categorized as two-dimensional (2D) or three dimensional (3D). The former is generally capable of determining displacements only in the image plane, while the latter enables the measuring of all three (spatial) components of the displacement vector through the addition of an extra camera during the image capturing [68].
1.7.2 Speckle pattern
The specimen’s surface must contain a random speckle pattern that can deform with the surface, thus functioning as a carrier of deformation information. Laser speckle patterns [69, 70] and artificial white-light speckle patterns (the random gray intensity pattern of the object surface) are
commonly used as speckle patterns [71]. A white-light speckle pattern can be obtained using the natural pattern of the specimen [44, 72] or black/white spray paint [42].
Speckle size plays a critical role in ensuring a suitable balance between a measurement’s accuracy (bias error) and precision (standard deviation error) [73]. Small speckles are required on a micro-scale, and the method for generating such speckle patterns is based primarily on photolithography [74], thin-film chemical-vapor patterning [74], laser patterning [75], micro-/nano-particles [76-78], fine paint [41, 78], etching, and natural microstructural patterns [72, 79].
A practical limitation in terms of the size of the speckles relates to that they should be sampled by an array of at least 3 3 pixels. If the speckles are smaller than this, the camera sensors cannot properly sample the speckles’ light signals for image production, and so the correlation results suffer severely from aliasing and low-contrast bias errors [64, 80]. Note that there is no limitation as regards the shape of the speckles.
1.7.3 Subset and spatial resolution
In subset-based DIC software, correlation occurs by considering a pixel and its neighborhood (i.e. subset) in a reference (e.g. undeformed) image (the red square in Figure 8) and matching the same subset in the post-deformation image [81, 82]. Subsets have square shapes with a side length of (2N+1) pixels, where N is a natural number. Subset size (SS) determines the minimum displacement area, which can be resolved. SS must be large enough to contain unique and identifiable features. A subset that is too small leads to a high uncertainty in correlation results, while subsets that are too large will smooth out details in large heterogonous deformations and significantly degrade the accuracy of results [83, 84]. The lower limit of SS is governed by the granularity of the speckle pattern, and the upper limit can be defined depending on the desired spatial resolution [83, 85].
Figure 8. Schematic illustration of a subset deformation in (a) a reference image and (b) a post-deformation image [86]. The subset is shown as a red square. The center point, P(x0,y0),
can be considered to move with a displacement vector to P’(x’0,y’0) by transition. Q(xi,yi) has
been deformed to Q’(x’i,y’i).
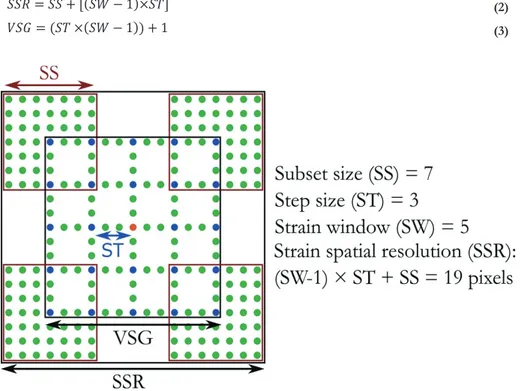
Spatial resolution is defined as the shortest distance between two independent measurement points. Displacement spatial resolution is the SS, since it defines the distance between two independent data points in a correlation. Strain spatial resolution (SSR) is limited by the SS value used for correlation-matching and the measurement grid of the strain concentration, which can be calculated using Eq. (2). Step size (ST), the distance between two adjacent displacement data points, determines the data density of a displacement field. Strain window (SW) is the number of
displacement data points that are involved in strain calculation. In the DIC software, typically, the user can define the values for SS, ST, and SW. The dimensions of SW, together with the imposed SS and ST values, determine the virtual strain gauge (VSG) size, which can be calculated according to Eq. (3). VSG represents the smoothing area for strain measurements [84, 85, 87]. Figure 9 schematically shows the relationship between the SS, ST, VSG, and SRS; the green dots are displacement data points, the blue dots are the data points that represent the size of the SW, and the red dot in the center of the VSG represents the strain measured in the VSG area [88].
1 (2)
1 1 (3)
Figure 9. Schematic illustration of a typical subset size, step size, strain window, and strain spatial resolution.
Selecting a large VSG results in a lower gradient detection and a smaller standard deviation due to the fact that a larger area of displacement data points is considered for strain measurement (more smoothing) [88]. In the case of homogeneous deformation, a large VSG is preferable, in order to decrease the errors that emerge from the displacement field. For heterogonous deformations, a small VSG is more likely to recover more localized data. ST can also affect the accuracy and precision of the DIC, as it prescribes the data density of the displacement field. For a fixed VSG, a smaller ST means higher displacement data density for strain calculations, resulting in a better recovery of the real strain field of the area. However, more errors in the displacement data will involve in too small ST values [84, 87].
1.7.4 Fundamentals of DIC
A correlation criterion (e.g. sum-squared difference or zero sum-squared difference) is commonly used in DIC software packages to define the degree of similarity between the reference subset and the deformed subset. The position of the deformed subset can be determined by defining a correlation coefficient and detecting the coefficient’s extremum [86, 89].
Interpolation provides gray intensity values between pixels, and is used for subpixel accuracy. Bi-cubic spline is one of the common subpixel interpolations used in DIC [64].
The shape of the reference subset can be changed in the deformed subset in the case of deformation, as is shown in Figure 8. However, based on the assumption of the deformation continuity of a deformed solid object, a set of neighboring points in the reference subset remain as neighboring points in the target subset. Thus, the center point of the subset can be defined as a transition in the initial speculation (P(x0,y0) and P’(x’0,y’0) in Figure 8) [89].
Strain fields are calculated based on the displacement fields that were obtained by the correlation. The computed displacement fields are smoothed by performing a local polynomial fit, which are then differentiated to calculate strains. The dimensions of these local polynomial fits are indicated by the SW. This method of strain calculation can decrease the noise level contained in the displacement field and increase the accuracy of the calculated strains [90, 91].
Noise is the smallest measured value associated with a change of signal, and is typically related to the sensitivity of the CCD camera and digitization, or external sources such as thermal noise and changes in illumination. An increase in noise can yield an increase in the random errors in the measured displacement. Image noise can be alleviated through: (i) high-performance camera sensors, (ii) frame averaging, which is produced from an average of several stationary images, and/or (iii) a proper correlation criterion, which is not sensitive to the offset and linear changes of illumination lighting [92, 93].
1.7.5 Application area
The application areas of DIC can essentially be categorized as: (i) quantitatively determining the deformation field and characterizing the deformation mechanism of different materials [85, 94, 95]; (ii) determining the mechanical properties, such as stress intensity factor, Young’s modulus, Poisson’s ratio, and thermal expansion, of materials [96-98]; (iii) validation of the models and simulations to bridge the gap between theory and experimentation [96].
In the case of ductile iron, DIC has been used to obtain macroscopic strain maps and the material’s properties [40], measure localized strain in the microstructure [41, 44], and verify simulation results [41].
1.8 MICROSTRUCTRAL DEFORMATION SIMULATION
In recent years, an increasing focus has been placed on developing finite element (FE) micromechanical models to enable the correlation and prediction of the constitutive laws and failure of ductile materials with heterogeneous microstructures (such as ductile iron). In these studies, the goals are generally to understand the material’s performance and find methods of microstructural optimization [35, 99].
The FE method can be used within the framework of continuum mechanics to carry out the calculations and determine the link between the microstructure and the mechanical response. Micromechanical models can be used to investigate ductile cracking by simulating void nucleation and coalescence at the site of second-phase particles in a matrix, in which either debonding or particle cracking is the dominant damage mechanism [100]. A model of this type was developed by Rice and Tracey [101] for the case of a spherical void that was subject to a remote uniform stress and strain field in a perfectly plastic Von Mises material.
By using simple unit cells and finite element analysis (FEA), the relationship between the elastic modulus and graphite content of a ferritic cast iron was studied [102, 103]. Pundale et al. [102] developed a simple unit-cell model based on the FE method, which was used to determine the effect of graphite content and shape on Young’s modulus. Gaudig et al. [103] later developed a more detailed approach, in which the graphite phase was assumed to consist of equal, randomly oriented, rotationally symmetrical ellipsoidal inclusions. Accordingly, a self-consistent one-particle
three-dimensional unit-cell model was developed, which consisted of a cube containing an inner graphite ellipsoid surrounded by an iron compound. The unit cell was subjected to uniaxial loading. Comparing the experiments and the theoretical model reasonably proved the validity of the results. Several attempts have been made to simulate deformation in the microstructure of ductile iron [45]. The unit-cell model was used for the description of the mechanical response up to failure, as well as to obtain the material parameters of the model used for nodular cast iron [100, 104]. However, when actual tensile tests on smooth and notched specimens were simulated, the results were not entirely successful, due to the large volume fraction of the voids in this material. The assumption of uniform void size and the spacing of the previous studies ignored the effect of void interaction and different void sizes on material damage. Therefore, the different axisymmetric cell models containing one or two voids of differing geometry and a two-dimensional cell model containing two voids of different sizes have been used. FE model calculations produced better results than previous experiments had yielded [105].
Collini and Nicoletto [106] used unit-cell models to predict the constitutive response of nodular cast iron with a mixed ferritic/pearlitic matrix. A continuum FE method was used to investigate the effect of graphite and ferrite/pearlite ratio content on the material’s mechanical response. Similar to the experimental results, the computational results showed a decrease in yield stress through increases in graphite and ferrite content. Non-uniform stress distributions were observed in the constituents, promoting a variety of failure mechanisms.
The validation of FE models has typically been carried out by comparing the calculated stress/strain values with experiments performed on a macro-scale in these simulations [106]. Most often the local deformation was captured by using representative volume elements (RVEs), based on the assumption of uniform spatial distribution and idealized geometrical shapes of phases (i.e. classical homogenization), and without comprising a physical length scale [107, 108]. This process can yield uncertainties in the prediction of local deformations. In addition, misinterpretation of the local effects can occur for a two-dimensional FE -model without considering at least one or more physical dimensions of the experimental specimen that are necessary for the applied boundary conditions.
RESEARCH APPROACH
CHAPTER INTRODUCTION
This chapter describes the research methodology and the experimental procedure used in this thesis.
2.1 AIM
The aim of this research was to investigate the effect of microstructural characteristics on the mechanical properties and deformation behavior of ferritic-pearlitic and high silicon ductile iron. For this purpose, the relationship between microstructural characteristics and mechanical properties was characterized, modeled, and simulated on macro-scale (Supplement I). A method for measuring strain in the microstructure of ductile iron using digital image correlation (DIC) in combination with in-situ tensile tests (Supplement II) was developed. Using this method, strain maps were measured on the microstructure at different load levels and compared with strain maps predicted by the FE simulation (Supplement III). The effects of the microstructure on deformation and cracking were studied on micro-scale, and the effects of cracking on the macroscopic stress-strain response of the material were identified. Local stress-strain at the onset of the micro-cracks was investigated (Supplements IV and V). Performing in-situ cyclic loading, a method was developed for generating a speckle pattern on the microstructure. Strain distribution in the microstructure and in the vicinity of micro-cracks was measured to study crack initiation and propagation in the material (Supplement VI).
2.2 RESEARCH DESIGN 2.2.1 Research perspective
The dominant research perspective used in this study was positivism with deductive reasoning. Positivism is generally regarded as a ‘scientific’ approach, which comprises measurements and quantitative data as part of a process of deductive reasoning. It is often related to experimental research design, and is rather linear and fixed in nature [109]. In a deductive reasoning process, conclusions are made based on the premises, in which the truth of the premises guarantees the truth of the conclusion.
The research approach utilized in this thesis is illustrated in Figure 10, which is based on the research design of traditional positivism [109]. Accordingly, an initial specification of the topic of interest and problem area was defined as a study of the mechanical and deformational behavior of ductile iron. A literature review was conducted to obtain the knowledge and theoretical framework suitable for exploring the different aspects of ductile iron, including fundamental knowledge, casting, mechanical properties, deformation and crack evolution, the application of DIC, and simulation. Based on the literature review, more specific and scientific problem areas and research questions were identified. Experimental procedures relating to casting, sampling, tensile/situ testing,
in-situ cyclic loading, and metallography were designed and performed to obtain valid and reliable engineering data. The results were obtained by evaluating and analyzing the data, and the conclusions were drawn. In some cases, these conclusions enlightened new areas of interest or research that could be used as a new sub-topic in a new cycle of the research.
Figure 10. Schematic illustration of the research approach of this thesis.
2.2.2 Research questions
Research questions were articulated according to the problem areas identified in the literature review. The research questions were categorized into three primary areas, each of which is addressed in the supplements indicated.
Local microstructural variation
1. What are the effects of silicon content and section thickness on the constituents of the microstructure? (Supplements I and II)
Deformation behavior on macro-scale
1. How does microstructural variation affect mechanical properties? (Supplement I) 2. How can the overall tensile behavior be predicted based on microstructural
characteristics? (Supplement I) Deformation behavior on micro-scale
1. How can local strain in the microstructure of ductile iron be quantified? (Supplements II and VI)
2. What are the effects of microstructural constituents on local strain distribution and cracking? (Supplements III, IV, V, and VI)
3. What are the effects of crack initiation on the overall stress-strain response of ductile iron? (Supplement V)
A series of scientific stages was designed and worked through to answer the research questions. Figure 11 illustrates the different stages of the research presented in this work according to the following scopes:
Determine the effects of section thickness and chemical composition (considering silicon to be the main alloying element) on the microstructure of ductile iron.
Predict the overall stress-strain response of the material based on microstructural variation. Quantify strain distribution in the microstructure during deformation under monotonic and
cyclic loading.
Study the effect of microstructural constituents on crack initiation.
Investigate the effect of local strain distribution and local cracking on the overall stress-strain response.
2.3 MATERIAL AND EXPERIMENTAL PROCEDURE 2.3.1 Material
Two ductile iron GJS-500-7 and GJS-500-14 grades were used in this study. The material was cast in the geometry schematically shown in Figure 12, which contained six different casting plates with thicknesses of 3, 7, 15, 30, 50, and 75 mm. This provided different cooling rates during solidification (the thicker the plate, the lower the cooling rate). This geometry is analogous to a real casting component with different section thicknesses. The length and width of each plate were 240 mm and 140 mm, respectively. The total weight of each casting was 105±5 kg.
Figure 12. Casting geometry, containing six plates of different thicknesses [110].
The GJS-500-7 grade was cast in one batch, while the GJS-500-14 grade was cast in three batches. The GJS-500-7 grade was used in Supplements I, III, and V. The nodularity of the first batch of GJS-500-14 was low (e.g. 67.4±6% in a 30 mm plate). This was due to the fading of magnesium (Mg) in the melt because of the long holding time period between the Mg treatment and melt pouring. This cast batch was designated GJS-500-14(a). The 30 mm plate from this batch was used for sample production in Supplements II and IV.
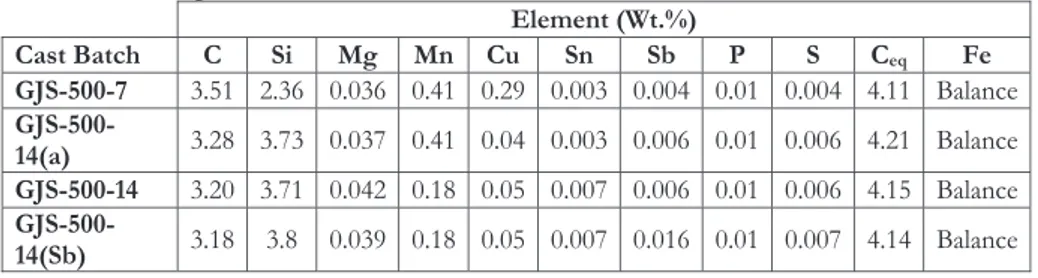
To improve the nodularity, the second and third batches were cast without and with the addition of 160 ppm Antimony (Sb) designated GJS-500-14 and GJS-500-14(Sb), respectively. Sb was added to investigate its effect on the nodularity of high silicon ductile iron [111, 112]. The GJS-500-14 batch was used in Supplements I and VI, while the GJS-500-14(Sb) was used in Supplement I. Table 2 presents the composition of the cast grades. The carbon equivalent was measured based on Eq. (1).
Table 2. The composition of the cast material.
Element (Wt.%) Cast Batch C Si Mg Mn Cu Sn Sb P S Ceq Fe GJS-500-7 3.51 2.36 0.036 0.41 0.29 0.003 0.004 0.01 0.004 4.11 Balance GJS-500-14(a) 3.28 3.73 0.037 0.41 0.04 0.003 0.006 0.01 0.006 4.21 Balance GJS-500-14 3.20 3.71 0.042 0.18 0.05 0.007 0.006 0.01 0.006 4.15 Balance GJS-500-14(Sb) 3.18 3.8 0.039 0.18 0.05 0.007 0.016 0.01 0.007 4.14 Balance
The casting was performed at SKF Mekan AB in Katrineholm, Sweden. The Mg treatment was performed via the Tundish cover method at 1490°C using Ce-free FeSiMg (1-20 mm particles). The pouring temperature was 1360±10°C. Inoculation was performed both in the transfer ladle and in stream. Table 3 shows information about the type and quantity of the inoculants used for the castings. Table 4 shows the chemical composition of the material used for the Mg treatment and inoculation. The pouring time was 25 seconds. The molds were produced using quartz-feldspar sand with the AlphasetTM binder.
Table 3. Type and amount of inoculation.
Inoculation Inoculant Amount (kg/ton)
In transfer ladle Foundrisil 0.7-3 mm 0.8
In stream Foundrisil 0.2-0.7 mm 1
Table 4. Chemical composition of the material used for Mg treatment and inoculation.
Element (Wt.%)
Material Si Al Ca Ba Mg Ce Fe Ce-free
FeSiMg 44-48 0.7 0.3-0.5 - 5.5-6.5 0.05 Balance Foundrisil 67-70 1.25 0.7-1.2 0.7-1.2 - - Balance
The 3 mm plates were not completely filled in any of the casting trials. In addition, a lack of filling occurred in the 7 mm plate of GJS-500-14(Sb) due to problems in the mold for this particular batch; thus, these plates were excluded from the study.
2.3.2 Microstructural analysis
Microstructural analysis was performed on all of the casting plates of the GJS-500-7, GJS-500-14, and GJS-500-14(Sb), as well as the 30 mm plate of cast GJS-500-14(a). Every cast plate was divided into seven equal sections, designated A to G, between the filling of the gate and the end of the plate, as is depicted in Figure 13(a). The analysis was performed on the middle of the surfaces between sections B and C, C and D, and E and F were designated C1, C2, and E1 (Figure 13(b)), respectively.
Figure 13. (a) Schematic of a typical cast plate, divided into seven sections and designated A to G. C1, C2, and E1 are the surfaces between sections B and C, C and D, and E and F, respectively. The arrows show the direction of the melt filling. (b) Schematic showing section
C and the surface C1. The arrow marks the middle part of the side, which was used for the microstructural analysis.
Samples were cut from the middle layers of C1, C2, and E1 and mounted with thermoplastic resins in a diameter of 30 mm, then mechanically ground and polished using the Struers Tegramin-30 polishing machine. A combination of SiC grinding papers, polishing cloths, water and diamond particle (DP) solutions was used for metallographic preparation. The details of the grinding and polishing steps are summarized in Table 5. The numbers of the SiC papers were based on the Federation of European Producers of Abrasives (FEPA) number.
Table 5. Steps of grinding and polishing for metallographic preparation of the samples. Step
number paper/cloth Type of Lubricant/DP suspension (min)Time Force (N)
1 Paper #220 Water 3 40 2 Paper #500 Water 3 40 3 Paper #800 Water 3 40 4 Paper #1200 Water 3 40 5 MD-Dac cloth DP 3 μm 5 25 6 MD-Nap cloth DP 1 μm 5 25
Etching was performed using a 5% Nital solution. Micrographs were recorded using an optical microscope (Olympus GX81) and analyzed using the Olympus Stream Motion image analysis software package, V1.9.1. Microstructural analyses were performed on the samples to measure nodularity by area, graphite particle count (number of graphite particles per mm2), nodule count (graphite particles with a shape factor of higher than 0.65 per mm2), and graphite fraction, ferrite fraction, and pearlite fraction (area fraction in the micrograph) according to ASTM E 2567 [113]. For each measurement, the results of the three different areas were averaged to represent the microstructure of each plate. Nodularity by area was measured based on Eq.(4), using at least 10 mm2 of each sample:
% ∑ .
where N is nodularity by area (%), SF is shape factor, and ∑ . is the area of graphite particles with a shape factor of higher than 0.65. ∑ is the area of all of the graphite particles that met the minimum size requirement (i.e. maximum ferret diameter < 10 μm).
2.3.3 Standard tensile testing
Comprehensive tensile testing was performed on all the plates for the GJS-500-7, GJS-500-14, and GJS-500-14(Sb) (Supplement I). Tensile samples were machined from the center of Sections B, D, and F (see Figure 13(a)) and tested according to the ISO-6892 Standard [114]. Dumbbell-shaped samples with a gauge diameter of 10 mm and gauge length of 50 mm were machined from all of the cast plates, with the exception of the 7 mm plates, from which flat tensile samples were produced. The thickness, gauge width, and gauge length of the flat tensile samples were 5, 7.5, and 80 mm, respectively. Tensile tests were performed using a Zwick/Roell Z100 testing machine. The tensile test strain rate was set at 0.00025s-1 up to fracture. Up to 1% elongation, the strain was measured using a clip-on extensometer; the remainder was measured using the machine crosshead. Elastic modulus was measured using the tangent method at 50 MPa engineering stress. The tensile results that represented each plate were obtained from an average of the three tensile tests of each plate.
For the GJS-500-14(a), tensile tests were performed on the samples machined from the 30 mm plate. The test was performed following ASTM E8M [115]. Flat tensile samples with a thickness, gauge width, and gauge length of 5, 6, and 25 mm, respectively, were produced from the center of Sections B, D, and F (see Figure 13(a)). The crosshead speed was set at 0.12 (mm/min) to yield and 1.6 (mm/min) to fracture. Up to 1% elongation, strain was measured using a clip-on extensometer; the remainder was measured using the machine crosshead. The modulus of elasticity was measured based on the regression method in a stress range of 20-50 MPa. The results of these tensile tests were used in Supplement II to benchmark the elastic modulus that was measured using DIC with those obtained during the tensile tests.
2.3.4 Hardness testing
Brinell hardness was measured according to the ISO 6506-1:2005 standard, using a 750 kg load and a 5 mm steel ball. Tests were performed at three different locations on each cast plate, at the center of C1, C2, and E1 (Figure 13(a)), and were averaged so as to produce a representative value for each plate (Supplement I).
2.3.5 In-situ tensile testing
In-situ tensile tests were performed using a miniature tensile stage produced by TSL Solutions K.K., Japan. The maximum load capacity of the machine was 1200 N. The machine applied a bidirectional, uniaxial tensile load to the samples. Figure 14 shows the setup of the miniature tensile stage in the optical microscope, along with the micro tensile sample that was used for the machine. The tensile samples were machined from the 30 mm plate of the GJS-500-14(a) (Supplements II and IV) and the 30 mm plate of the GJS-500-7 (Supplements III and V). The thickness of the samples was 1±0.1 mm to enable tensile testing to be undertaken in the range of the maximum load capacity. The surface of the samples was polished (according to Table 5) to enable observation of the microstructure during the in-situ testing. The crosshead displacement rate was 3.3 µm/s. The direct data output from the tensile stage included the load (N) and crosshead displacement (μm), both of which were used to measure the overall stress and strain of the samples. However, preliminary tests showed uncertainty in the measured displacement data due to the low stiffness of the machine, which results in the bending of the parts during loading [116]. To compensate for this (i.e. the tensile stage stiffness), a correctional equation was developed to reduce displacement data errors and obtain reliable results. The equation was calculated by tensile testing a stiff sample. An extensometer was mounted on the tensile sample to measure the displacement during the test, and the differences between the displacement data obtained using the machine and the extensometer were compared at various force amplitudes to determine the correction equation.
![Table 1. Solubility factors of common alloying elements for carbon-saturated Fe-C-alloying element melts [20]](https://thumb-eu.123doks.com/thumbv2/5dokorg/5426462.139840/18.701.69.558.489.637/table-solubility-factors-alloying-elements-saturated-alloying-element.webp)
![Figure 2. Iron-carbon phase diagram. The X axes indicates the carbon content Wt.% [9]](https://thumb-eu.123doks.com/thumbv2/5dokorg/5426462.139840/19.701.226.578.100.417/figure-iron-carbon-phase-diagram-indicates-carbon-content.webp)
![Figure 3. Influence of the graphite morphology on the mechanical properties of cast iron: (a) tensile stress-strain response, (b) tensile strength, elongation, and fatigue strength [27]](https://thumb-eu.123doks.com/thumbv2/5dokorg/5426462.139840/20.701.70.572.329.567/influence-graphite-morphology-mechanical-properties-response-strength-elongation.webp)
![Figure 4. Influence of ferrite/pearlite phase fraction on tensile test results [28].](https://thumb-eu.123doks.com/thumbv2/5dokorg/5426462.139840/21.701.224.532.97.312/figure-influence-ferrite-pearlite-phase-fraction-tensile-results.webp)
![Figure 6. Fatigue crack propagation in the microstructure of ductile iron (R = 0.1, ΔKStart = 13 MPa√m) [52]](https://thumb-eu.123doks.com/thumbv2/5dokorg/5426462.139840/23.701.122.635.159.454/figure-fatigue-crack-propagation-microstructure-ductile-iron-δkstart.webp)
![Figure 8. Schematic illustration of a subset deformation in (a) a reference image and (b) a post-deformation image [86]](https://thumb-eu.123doks.com/thumbv2/5dokorg/5426462.139840/25.701.122.622.496.723/figure-schematic-illustration-subset-deformation-reference-image-deformation.webp)