THE INFLUENCE OF THE LIGHTING ENVIRONMENT ON PERFORMANCE AND
WELL-BEING IN OFFICES.
A. KRONQVIST
PhD student, Dept. of Lighting Science, University of Jönköping, Box 1026, 551 11 Jönköping, Sweden Dept. of Architecture, Chalmers University of Technology, Göteborg, Sweden
E-mail: annika.kronqvist@jth.hj.se ABSTRACT
This paper presents an experimental study with 47 participants on the influence of lighting on performance and well-being in an office environment. Well-being, alertness and performance were evaluated and measured in two rooms with artificial lighting and one room with day lighting. The evaluations were correlated to cortisol/melatonin saliva samples, illuminance and spectral compo-sition of the lighting. The results show day lighting to have a sustained influence on alertness and performance and it is furthermore concluded that the level of cortisol in saliva was not influenced by the illuminance and did not have an influence on performance. The participants preferred a lighting with different kinds of light sources to a more neutral lightning and gave it higher ratings for well-being.The analysis shows that comfort did not influence alertness.
Keywords: office lighting, well-being, performance, cortisol, alertness
1.INTRODUCTION
Research suggests that lighting has an influence on our psychological wellbeing, and that the subtle information of-fered by the perceptual qualities of light are the ones stimulating spatial experiences and sensations such as satisfac-tion, safety, comfort, relaxation and stress etc. [1]. The impact of colour of light on well-being has been studied with contradictory results [2].There are many factors influencing the office staff well-being who in the long run will influence performance as well as health. The growing knowledge of the influence of lighting on office staff has heightened the need for further studies. The modern office has a different setting and layout from the traditional office with a contrast situation when working on screens (VDU) that is different from traditional paper-work [3]. The preferred luminance ratios between VDU and background is also shown to be smaller, than CIE recommendations [4].It thas been shown that illuminance preferences are individual [4], and if able to control the illuminance, lower levels were chosen [5]. However, the preferred illuminance is not guaranteed to produce the most interesting scenes [6]. Previous studies have shown a preference of office staff for a bright office lighting with dynamically changing illuminance [7]which conforms to findings suggesting that the office staff self-assessed well-being in the afternoon is strongly influenced by the lighting scenario [8]. The influence of supression of melatonin [9,10] and enhancement of cortisol on alertness has been discussed, but the light induced performance arousals in daytime cannot be explained by these factors alone.
Aim 1.1
This study is investigating which artificial lighting, or only day lighting, that has a positive influence on well-being, alert-ness and performance in a person exposed to it while performing tasks on a VDU. It aims at establishing the lighting conditions that ensure visual comfort and high performance in a VDU setting.
2.METHOD 2.1. Sample
51 healthy participants were reqruited by advertising in the local papers, through contacts at the local employment office, and by roll calls of employees, phD students and under-graduate students at the University of Jönköping. 22 men and 25 women, 19-60 years old, completed the study.
2.2. Settings
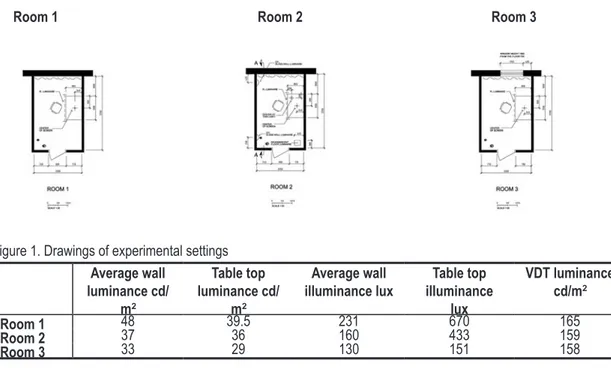
Three rooms were used, room 1 and 2 were set with only artificial lighting and no daylight, and room 3 with only daylight (Fig. 1). The lighting in room 1 followed the standard recommendations by CIE of illuminance and light dis-tributions for office lighting by means of a pendant flourescent luminaire, a T8 fluorescent tube with a CRI of 80 and colour temperature of 3000K. Room 2 was a mix of incandescent and fluorescent lighting. Room 3 had only daylight through a 2,2 m2 window at the far end of the room. All three rooms had white walls, NCS 1002-Y, white ceilings NCS 0500-N and wooden coloured floors, and were equipped with a flat LCD Samsung SyncMaster 214T VDU on which all tasks were completed.
Illuminances and luminances were measured (Table 1). A spectroradiometer was used to record the different spectral composition of the light settings (Table 2) and of the VDUs. Spectroradiometer recordings were made three times a day in room 3, 7 am, 12 and 5 pm. Acoustic measurements and measurements of CO2, temperature and moistness were recorded at 7.30 am and 4.30 pm in all three rooms.
2.3. Procedure
The participants spent 9 am til 4 pm in each room at a weekly interval in a balanced order of presentation.The study day was preceded by saliva sampling and joint breakfast where the participants filled in a health declaration and completed a personality mapping survey [11]. The study tasks were repeated in the same order at each occasion. The participant was not allowed to adjust the light settings, which were unchanging, or the task luminaire position in room 2. All instructions were prerecorded and transmitted through a loud speaker system. The day was closed with an individual de-briefing session.
2.3 Instruments
The participant was asked to complete simulated office tasks and a performance test, and then to subsequently fill in surveys on the VDU, including valuation of visual comfort and state of mind as well as value assessment of the visual experience of the room, the task area and the lighting [12]. Performance or the capability to maintain a high level of attention over a longer period of time was measured in a vigilance test [13] on the VDU. Sampling of saliva for cortisol and melatonin variations were conducted at 8 am, 11.45 am and 4.10 pm.
2.4. Data treatment
participants included semantic and Likert scales to provide the means for a statistical analysis of the responses. Several statistical analyses were applied using Predictive Analytics SoftWare to examine the correlation between the different variables. P ≤ .05
3.RESULTS
3.1.Room evaluation
The prestudy proved all rooms to be equal on the mean of 36 different measures. The study did not show any cor-relation of gender, age or performance with the visual experience of the room. Room 2 was preferred to the other rooms. Personality type A (stress sensitive) persons appreciated room 2 significantly less than the more tolerant type B personalities.
3.2. Alertness
The highest mean value for alertness throughout the day was experienced in room 3 with only day lighting (Table 3). Alertness in room 2 showed a steeper downwards curve (Table 4) than the curves drawn for rooms 1 and 3. The impact of the illuminance on alertness shows that room 1 with the highest illuminance (Table 1) has the highest score of self assessed alertness in the morning, but this has declined to the same level as in room 3 in the afternoon.The impact of light on cortisol levels are essentially the same in all three rooms (Table 5). The only correlation between cortisol levels and alertness is in room 1, but even then only detectable in the morning. The feeling of alertness cor-relates significantly with performance in the morning in rooms 1 and 2, but not in room 3. Gender corcor-relates with alertness in room 1, and as 2/3 of the type A personalities were women it was examined if there was a correlation between personality type and alertness, but this could only be shown in room 3. Neither age nor comfort could be shown to relate to self asserted alertness.
3.3 Performance
Performance scores indicate that a higher level of concentration is sustained in room 3 with only day lighting despite a lower illuminance (Table 7). Neither the level of cortisol nor melatonin has a correlation with performance. 3.4. Lighting
The evaluation of the lighting shows room 1 to have the most neutral lighting with the least variation. 1/3 of the par-ticipants considered the lighting in rooms 1 and 2 to slightly reduce their ability to perform and feel well, as well as in room 3. However, in room 3, 1/3 of the participants thought the lighting improved their well being and enhanced their ability to perform. Even so the lighting in room 3 was considered the poorest support of VDU work tasks.
3.5. Comfort
Comfort varied with identical self-assessed well-being in room 1 and 2, and with consistently higher evaluations for room 3. The comfort was significantly correlated to the lighting in room 2 and with a tendency to correlate in room 1 (Table 6). Preferred illuminance varied widely and descriptive word for the lighting in room 1 would be; “light, strong”, for room 2; “light, strong, soft, mild”. The lighting in room 3 was described as “dark, weak, soft, mild, muted”. There was no relationship with age or gender as to which light setting was preferred. There was a correlation between colour of light and well-being in room 1 only.
4.DISCUSSION
This study has been investigating which lighting has a positive influence on well-being, alertness and performance while performing tasks on a computer VDU.
Previous studies claim a correlation between lighting, cortisol levels and melatonin level supression and feelings of alertness, which is not supported in this study. The impact of illuminace and spectral composition on cortisol levels over the day is essentially the same in all three rooms expressing a common circadian rhythm, and is consistent with social studies suggesting that cortisol is linked to negative variations in the environment [14]. Our findings point at the spectral composition as the most alerting factor as both self assessed alertness and performance scores were best sustained in the room with only day lighting and the lowest illuminance. This would imply that light with higher energy content in the afternoon and a more even distribution over the spectral curve would induce a feeling of alertness in humans. The impact of separate wavelengths on the brain is unmapped at large. Suggested strive for homestatic levels in systems affecting mood and arousal [15] could be dependent on an even spectral composition. This is not contradictory to earlier studies claiming that the subjective well-being is strongly influenced by the lighting scenario. Further research into these interconnected variable chains are needed. The preference for a room which was not the most illuminated, is consistent with earlier findings and was anticipated in a VDU setting.
The influence of personality traits on lighting preferences was inconclusive as the group consisting of more stress sensitive persons in this case was a too small group to construct a valid correlation. Further research is needed to indicate if personality traits exert an influence on well-being, alertness and performance under different lighting condi-tions.
5.CONCLUSION
It can be concluded that preferences for illuminance are individual, and not related to age or gender, and that the participants preferred a complex light setting. Alertness could not be related to levels of saliva cortisol or melatonin. A more complex setting combined with day lighting could be used to create an environment which will sustain per-formance as well as improve well-being and comfort, suggesting a turn of strategy in office lighting, where the illumi-nance is down-played by variety and spectral composition of the lighting.
6.REFERENCES
[1] Flynn J.; A study of subjective responses to low energy and nonuniform lighting systems. Lighting Design & Application 1977, February: 6-14
[2] Knez I.; Effects of colour of light on nonvisual psychological processes. J. of Environmental Psychology 2001; 21: 201-208 [3] Piccoli B., Soci G., Zambelli P., Pisanello D.; Photometry in the workplace: the Rationale for a New Method. Ann. Occup. Hyg. 2004, Vol. 48; 1:29-38
[4] Veitch J., Newsham G.; Preferred luminous conditions in open-plan offices: research and practice recommendations. Lighting Research & Technology 2000; 32,4: 199-212
[5] Boyce, P., Veitch J.,Newsham G.,Jones C., Heerwagen J., Myer M., Hunter M.; Occupant use of switching and dimming con-trols in offices. Lighting Res Technol; 38,4 (2006) 358-378
[6] Loe D., Mansfield K.,Rowlands E.; Appearance of lit environment and its relevance in lighting design; Experimental study. Light-ing Research and Technology 1994; 26(3) 119-133
[7] Tenner A.; A Healthy Future for Office Lighting? J. Light &Vis. Env. 2003; Vol.27,3
[8] Fleischer S., Krueger H., Schierz C.; Effect of brightness distribution and light colours on office staff, The 9th European Lighting
Conference Lux Europa 2001, Reykjavik;18-20 June 2001.
[9] Cajochen C., Münch M.,Kobialka S., Kräuchi K., Steiner R.,Oelhafen P., Orgül S., Wirz-Justice A.;High sensitivity of Human Melatonin, Alertness, Thermoregulation, and Heart rate to Short Wavelength Light. J. of Clinical Endocrinology & Metabolism (2005) 90(3):1311-1316
[10] Lockley S., Brainard G., Czeisler C.; High Sensitivity of the Human Circadian Melatonin Rhythm to Resetting by Short Wave-lenght Light. J. of Clinical Endocrinology & Metabolism (2005) 88(9):4502-4505
[11] Burell G. Dept. of Public Health and Caring Sciences, University of Uppsala, Sweden
[12] Küller R.; A semantic model for describing perceived environment. Document D12:1972. Stockholm: National Institute for Building Research.
[13] Vigil, Vienna Test System, Psychology Software Distribution
[14] Adam E., Hawkley L., Kudielka B., Cacioppo J.; Day-to-day dynamics of experience-cortisol associations in a population-based sample of older adults. PNAS, November 7, 2006, vol.103, no.45, 17058-17063
[15] Davydov D., Shapiro D., Goldstein I., Chicz-DeMet A.; Mood in everyday situations: Effects of combinations of different arousal-related factors. J. of Psychosomatic Research 62 (2007) 321-329
7.FIGURES AND TABLES
Room 1 Room 2 Room 3
Figure 1. Drawings of experimental settings Average wall luminance cd/ m2 Table top luminance cd/ m2 Average wall
illuminance lux illuminanceTable top lux VDT luminance cd/m2 Room 1 48 39.5 231 670 165 Room 2 37 36 160 433 159 Room 3 33 29 130 151 158
Table 2.Spectroradiometer measurements Table 3. Alertness, semantic scale 1-4
Table 4. Self assessed alertness, semantic scale 1-4 Table 5. Cortisol level variations over the day
P≤0.05
Table 6. Correlation between comfort and light setting Table 7. Performance (T) as a function of correctness and speed
ACKNOWLEDGEMENTS
This study was carried out as part of a PhD thesis sponsored by “Bertil och Britt Svenssons stiftelse” under the su-pervision of Maria Johansson, assoc. Professor, University of Lund, Sweden.