DOCTORA L T H E S I S
Tw
ana Omer
Abdullah Gr
oundw
ater
V
ulnerability
Assessment
Department of Civil, Environmental and Natural Resources Engineering Division of Mining and Geotechnical Engineering
ISSN 1402-1544
ISBN 978-91-7790-619-3 (print) ISBN 978-91-7790-620-9 (pdf) Luleå University of Technology 2020
Groundwater Vulnerability Assessment
to Pollution in Different Soil and Rock Material
Twana Omer Abdullah
Soil Mechanics
130324-LTU Avhandling (G5).indd Alla sidor
DOCTORAL THESIS
Groundwater Vulnerability Assessment to Pollution
in Different Soil and Rock Materials
Twana Omer Abdullah
Soil Mechanics
Division of Mining and Geotechnical Engineering
Department of Civil, Environmental and Natural Resources Engineering
Luleå University of Technology
SE-97187 Luleå, Sweden
In Partial Fulfillment of the requirements for the Degree of
Doctor of Philosophy (PhD)
Luleå, Sweden
2020
ii
Groundwater Vulnerability Assessment in Different Rock and Soil Materials Twana Omer Abdullah
Soil Mechanics
Division of Mining and Geotechnical Engineering
Department of civil, Environmental and Natural Resources Engineering Luleå University of Technology
Luleå, Sweden
Cover image: designed and prepared by the author.
Opponent Examiner:
Professor Sabbar Abdullah Alqaisi, Professor in Hydrogeology, Department of Applied Geology
Sciences, College of Science, Tikrit University, Iraq.
Examining Committee:
Professor Ian Foster, Professor in Geomorphology, School of Science and Technology, University
of Northampton, UK.
Professor Ronny Berndtsson, Professor in Water Resources Engineering, Department of Water
Resources Engineering,Faculty of Engineering, University of Lund, Sweden.
Professor Manal Kubaisi,Professor in Geology, Department of Geology,University of Baghdad, Iraq.
Supervisors:
Professor Nadhir Al-Ansari, Division of Mining and Geotechnical Engineering, Luleå University
of Technology, Sweden.
Professor Sven Knutsson, Division of Mining and Geotechnical Engineering, Luleå University of
Technology, Sweden.
Professor Jan Laue, Division of Mining and Geotechnical Engineering, Luleå University of
Technology, Sweden.
Printed by Luleå University of Technology, Graphic Production 2020 ISSN 1402-1544 ISBN: 978-91-7790-619-3 (print) ISBN: 978-91-7790-620-9 (electronic) URN: urn:nbn:se:ltu:diva-79469 Luleå, 2020 www.ltu.se
iii
Acknowledgement
Time flies so fast; it seems like it was just yesterday! I have been studying for my PhD at Luleå University of Technology for the past five years. I would like to give a great thankful to all those who have supported me and made this work possible.
I would like to express my deepest gratitude to my principle supervisors Prof. Nadhir Al-Ansari, Prof. Sven Knutsson, and Prof. Jan Laue at Luleå University of Technology in Sweden, for providing me the opportunity to be one of their postgraduate students, for all the guidance, encouragement, fruitful discussions and helpful advice on my research when required and efforts in managing things so that I can work smoothly.
My appreciation to the University of Sulaimani, especially Prof. Salahaldddin S. Ali, the previous president of university, for awarding me the PhD scholarship to pursue my postgraduate education and make different in my life.
I am indebted to all my colleagues and the staffs of Division of Mining and Geotechnical Engineering at Luleå University of Technology for all kinds of support.
My sincere thanks also go to the staffs of Groundwater Directorate of Sulaimani. Especially, Hawzheen Abdullah, Farhad Hama and Sarmad Abdwlhamid and to Babarasul Gafour (previous directorate) and Mr. Abas A. Ahmad (current director), all those have crucial roles in providing me the important required data for my study.
My appreciation is to all who gave me help and support that enabled me to write my doctoral thesis.
I would love to extend my great appreciation to my mother, to my late father, my brothers and only sister for their supports throughout the period of my study.
Last but not least, I would like to express my deepest gratitude to my lovely wife, Shadan, who has a special place in my heart, and my only son, Aro, for their patience, understanding, support, love and encouragement.
Twana O. Abdullah
Luleå, 2020
v
Abstract
The augmentation of human population regularly corresponds with change in the land cover, including expansion of urban areas, which imposes increasing the available amount of domestic and drinking water. The study area, Halabja-Saidsadiq Basin, is situated in the Northeast of Iraq and is one of the major groundwater sources of the region. As the surface water sources are not enough in the studied area, it has become necessary to use groundwater at an increasing rate. Usually, a huge amount of groundwater is plentiful in the alluvial deposits or rock outcrops where the urban areas are frequently situated. Such areas face a huge risk of pollution of groundwater due to producing different sources of a contaminant from human's activity. Keeping these aspects in view, groundwater vulnerability studies have been carried out in the current studied basin. The main objective of this work is to investigate the environmental impacts on groundwater quality and recognize the groundwater vulnerability in the area so that the groundwater can be protected from probable contaminations.
In the current study, DRASTIC model has been applied since it is one of the most proper useful methods available for the assessment of the groundwater vulnerability. This model has been modified in different ways to achieve the obvious vulnerability condition in the area; likewise, different further methods have been applied for comparison purposes such as: weight modified VLDA and standard COP models. In addition, the applied models were validated by comparing its findings against the estimated groundwater ages and the observed water characteristic qualities within the region in two successive seasons.
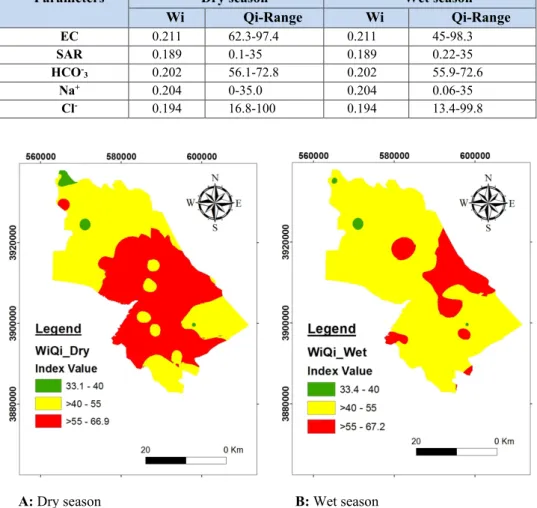
According to the spatial distribution of irrigation water quality index, groundwater at the studied basin classified into three group for both dry and wet seasons, namely, Sever Restriction (SR), High Restriction (HR) and Moderate Restriction (MR). The coverage area of all three classes are (1.4%, 52.4% and46.2%) for dry season and (0.7%, 83.3% and16%) for wet seasons, respectively. While, refer to the water quality index for drinking purpose, groundwater in this basin reveals a permissible to excellent groundwater quality of the dry season and a good to excellent groundwater quality of the wet season. The high level of a good groundwater quality in the wet season compared to the dry season might be expected to the groundwater recharge during the winter and spring periods, which lead to dilution of chemical component, in contrast high irrigation and agricultural activities and groundwater discharge in the dry season leads to increase the concentration of chemical component.
Field and official data were collected to review several environmental impacts and were used to map standard DRASTIC vulnerability model for the study basin. Based on this model, the study area was classified into four zones of vulnerability indexes, comprises a very low, low, moderate and high vulnerability index with a coverage area of (34%, 13%, 48% and 5%) respectively.
In the first modification step, the rate and weight value of each parameter in DRASTIC model is modified. Nitrate concentration from 39 groundwater samples was used for modifying the recommended standard rating value based on the Wilcoxon rank-sum nonparametric statistical test and then sensitivity analysis was used to modifying recommended standard weighting value of each parameter. To calibrate the modified rate, the Pearson's correlation coefficient was applied to estimate the relation between DRASTIC values and nitrate concentrations in groundwater samples. For the first modified model, the correlation coefficient was 72% that was significantly
vi
vulnerability classes, including (very low, low, moderate, high and very high) with covered area of (7%, 35%, 19%, 35% and 4%), respectively.
The second modification of DRASTIC model was based on land use and land cover for the studied area. The land use and land cover (LULC) map prepared using ERDAS IMAGINE software from two different scenes of Landsat Thematic Mapper (TM). The LULC map indicates that only five classes of LULC can be identified: these are: barren land, agricultural land, vegetation land, urban area and wet land or water body. The modified DRASTIC based on LULC map classified the area into five classes with different coverage area of each class: very low (1.17%), low (36.82%), moderate (17.57%), high (43.42%) and very high (1.02%).
The third modified method of the current study is the modification of DRASTIC model based on Lineament feature of the study basin. A lineament map is extracted from Enhanced Thematic Mapper plus (ETM+) satellite imagery using different techniques in remote sensing and
GIS. The lineament density map demonstrates that only six classes of lineament density can be identified ranged from (0-2.4). The third modified DRASTIC model classified the area into four vulnerability categories: very low (28.75%), low (14.31%), moderate (46.91%) and high (10.03%).
The fourth effort to modify standard DRASTIC model is the application of Analytical Hierarchical Process (AHP) to assess the weight value of each parameter. The modified DRASTIC vulnerability index values based on AHP method ranged between (65.82–224.1) with five vulnerability classes comprises (very low to very high).
Weight modified VLDA and standard COP models were also applied to map vulnerability system in the study basin. The vulnerability outcome based on weight modified VLDA model revealed that a total of four ranges of vulnerability indexes had been distinguished ranging from low to very high with vulnerability indexes (2.133-9.16). Subsequently, based on the standard COP model, the area is also divided into four vulnerability classes ranging from very low to high with index value ranged from (0.79) to (6.2).
All applied models in the study basin were compared to each other and validated to clarify the validity of the theoretical sympathetic of current hydrogeological conditions and to show the accuracy of the modeled vulnerability system. Two methods were applied for the validation of the result, in the first approach; nitrate concentration analysis has been selected; the nitrate differences between two following seasons (dry and wet) were analyzed from (39) water wells. In the second approach, groundwater vulnerability was assessed based on estimated groundwater age from range of tritium (3H) value in the groundwater samples from different groundwater aquifers in
the studied area. The results of both validation methods verify the sensibility of the gradation and distribution of vulnerability levels acquired using the modified DRASTIC model based on (rate and weight modification, weight modification based on AHP process and effect of LULC on DRASTIC model) and also applying weight modified of VLDA model.
vii
List of Appended Papers
Ten papers are appended in this thesis (included three papers were appended previously in my Licentiate Thesis). All these papers published in different journals. Papers (2-4, 6 and 8-10) are related to groundwater vulnerability in Halabja Saidsadiq Basin, using different vulnerability models and GIS techniques. Papers (1 and 5) are related to the groundwater quality in the same studied area. Paper (7) is related to the behavior of groundwater movement in terms of magnitude and direction in different groundwater aquifers in the studied area.
1. Twana O. Abdullah, Salahalddin S. Ali, Nadhir A. Al-Ansari and Sven Knutsson.(2016).
Classification of groundwater based on irrigation Water Quality Index and GIS in Halabja Saidsadiq Basin, NE Iraq.Paper published in Environmental Hydrology, volume (24), Paper (5). 2. Twana O. Abdullah, Salahalddin S. Ali, Nadhir A. Al-Ansari and Sven Knutsson (2016).
Groundwater Vulnerability Using DRASTIC and COP Models: Case Study of Halabja Saidsadiq Basin, Iraq. Paper published in Scientific Research Publishing, Engineering, 2016, 8,
741-760.
3. Twana O. Abdullah, Salahalddin S. Ali, Nadhir A. Al-Ansari and Sven Knutsson.(2016). Assessing the Vulnerability of Groundwater to Pollution Using DRASTIC and VLDA Models in Halabja Saidsadiq Basin, NE, Iraq. Paper published in Journal of Civil Engineering and Architecture 10
(2016) 1144-1159.
4. Twana O. Abdullah, Salahalddin S. Ali, Nadhir A. Al-Ansari and Sven Knutsson. (2018). Possibility of Groundwater Pollution in Halabja Saidsadiq Hydrogeological Basin, Iraq Using Modified DRASTIC Model Based on AHP and Tritium Isotopes. Paper published in Geosciences 2018, 8,
236; doi:10.3390/geosciences8070236.
5. Twana O. Abdullah, Salahalddin S. Ali, Nadhir A. Al-Ansari and Sven Knutsson. (2019).
Hydrogeochemical Evaluation of Groundwater and Its Suitability for Domestic Uses in Halabja Saidsadiq Basin, Iraq. Paper published in Journal of Water, Cells 2019, 8, 312;
doi:10.3390/cells8040312.
6. Twana O. Abdullah, Salahalddin S.Ali, Nadhir A. Al-Ansari and Sven Knutsson (2020). Assessment of groundwater vulnerability to pollution using two different Models in Halabja Saidsadiq Basin, Iraq. Paper published in Journal of Groundwater for Sustainable Development 10 (2020)
100276.
7. Twana O. Abdullah, Salahalddin S. Ali, Nadhir A. Al-Ansari, Sven Knutsson and Jan Laue. (2020).
Magnitude and Direction of Groundwater Seepage Velocity in Different Soil and Rock Materials. Paper published in Scientific Research Publishing, Engineering, 2020, 12, 242-253.
Licentiate Thesis Publications
The following papers were published and appended previously in my Licentiate Thesis with the title of “Groundwater Vulnerability Using DRASTIC model Applied to Halabja Saidsadiq Basin, IRAQ”:
8. Twana O. Abdullah, Salahalddin S. Ali and Nadhir A. Al-Ansari. (2016). Groundwater assessment of Halabja Saidsadiq Basin, Kurdistan region, NE of Iraq using vulnerability mapping.
Arabian Journal of Geosciences (2016) 9:223, DOI 10.1007/s12517-015-2264-y.
9. Twana O. Abdullah, Salahalddin S. Ali and Nadhir A. Al-Ansari (2015). Effect of Agricultural Activities on Groundwater Vulnerability: Case Study of Halabja Saidsadiq Basin, Iraq, Journal
of Environmental Hydrology, Vol. 23, 408–423.
10. Twana O. Abdullah, Salahalddin S. Ali, Nadhir A. Al-Ansari and Sven Knutsson. (2015).
Groundwater Vulnerability Mapping Using Lineament Density on Standard DRASTIC Model: Case Study in Halabja Saidsadiq Basin, Kurdistan Region, Iraq, Engineering, Vol. 7,
viii
List of other publications
During my PhD studies, I participated in the following scientific research papers as co-author which are not related to my PhD topics and not appended in the thesis:
1. Rebwar Hassan, Nadhir Al-Ansari, Salahalddin S. Ali, Ammar A. Ali, Twana Abdullah, Sven Knutsson, (2016). Dukan Dam Reservoir Bed Sediment, Kurdistan Region, Iraq. Paper
published in the journal of Engineering, Vol. 8, 582-596.
2. Qais Al-Madhlom, Nadhir Al-Ansari, Hussain M. Hussain, Jenny Lindblom, Twana Abdullah, Bashar Abid Hamza, Sven Knutsson, (2017). Seepage Velocity of Dibdibba Formation in Karbala, Iraq. Paper published in the journal of Engineering, Vol. 9, 279-290.
3. Diary Ali Mohammed Amin Al Manmi, Twana Omer Abdullah, Peshawa Mahmood Al-Jaf and Nadhir Al-Ansari, (2019). Soil and Groundwater Pollution Assessment and Delineation of Intensity Risk Map in Sulaymaniyah City, NE of Iraq. Paper published in the journal of Water, MDPI, 11, 2158; doi:10.3390/w11102158.
4. Sabbar A.Saleh , Nadhir Al-Ansari, Twana Abdullah. (2020). Groundwater Hydrology in Iraq. Paper published in the journal of Earth Sciences and Geotechnical Engineering, Vol.10,
No. 1, 2020, 155-197 ISSN: 1792-9040 (print version), 1792-9660 (online) Scientific Press International Limited.
ix
Abbreviations
Abbreviations Descriptions
AHP Analytical Hierarchy Process AIA Alluvium Intergranular Aquifer A-Map Aquifer Media Map
CFA Cretaceous Fissured Aquifer
COP C is the properties of overlying layers; O is the concentration of flow, and P is the precipitation CKFA Cretaceous Karstic Fissured Aquifer
CN Curve Number CR Consistency Ratio
CI Consistency Index
C-Map Hydraulic Conductivity Map DEM Digital Elevation Model
DI Vulnerability Index Value D-Map Depth to water table map
EPIK Epikarst, Protection cover, Infiltration condition and Karst network development Eg Eigen value
ETM+ Enhanced Thematic Mapper Plus
HR High Restriction
IQS Iraqi Drinking Water Standard IWQI Irrigation Water Quality Index
IDW Inverse Distance Weight I-Map Impact of Vadose Zone Map
JKA Jurassic Karstic Aquifer LU/LC Land Use/Land Cover
LR Low Restriction m.a.s.l Meter above Sea Level
MR Moderate Restriction N.D. Not Detected
NR No Restriction OS Overlying Soil OL Overlying Lithology
Pr Parameter Rate Value Pw Parameter Weight Value PQ Quantity of Precipitation
PI Temporal Distribution of Precipitation Qi Quality Measurement of the ith parameter
RI Random Index R-Map Net Recharge Map
SR Sever Restriction S-Map Soil Media Map
sf Surface Feature sv Slope and Vegetation SD Standard Deviation
x
Abbreviations
Abbreviations Descriptions
TAT Tanjero Aquitard TKA Tertiary Karstic Aquifer
TM Thematic mapper T-Map Topography Map
UTM Universal Transverse Mercator
VLDA V is Lithology of Vadose Zone, L is the Pattern of Land Use, D is Groundwater Depth, and A is the Aquifer Characteristics. vs Seepage velocity
Wi Weight of the ith Parameter
xi
Table of Contents
Part I: Main Thesis
1. Chapter One : Introduction ... .1
1.1 Study Area... .1
1.2 Geological and Hydrogeological setting ... .2
1.2.1 Geological Setting ... .2
1.2.2 Hydrogeological Setting ... .3
1.2.2.1 Seepage velocity of different groundwater aquifers (Paper 7) ... 4
1.3 Climate ... 7
1.3.1 Climatic Classification ... 10
1.4 Literature Review ... 10
1.5 Environmental Impacts ... 14
1.6 Scope of the Work... 17
1.7 Objectives of the research ... 18
2. Chapter two :Groundwater Vulnerability and Groundwater Quality ... 19
2.1 Groundwater Vulnerability ... 19
2.1.1 Groundwater Vulnerability in the Studied Basin ... 19
2.2 Groundwater Quality (Papers 1 & 5). ... 20
2.2.1 Uncertainty Measurement of Chemical Analysis ... 20
2.2.1.1 Precision (Random Error) of Chemical Analysis... 20
2.2.1.2 Accuracy (Systematic Error) of Chemical Analysis ... 21
2.2.2 Classification of Groundwater Quality. ... 21
2.2.2.1 Piper Diagram ... 21
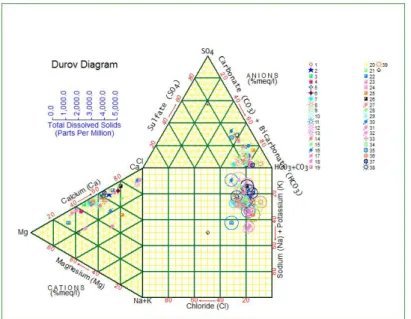
2.2.2.2 Durov Diagram ... 22
2.2.3 Groundwater Quality Index ... 22
2.2.3.1 Domestic Groundwater Quality Index ... 25
2.2.3.2 Irrigation Groundwater Quality Index ... 25
3. Chapter Three :Methodology ... 31
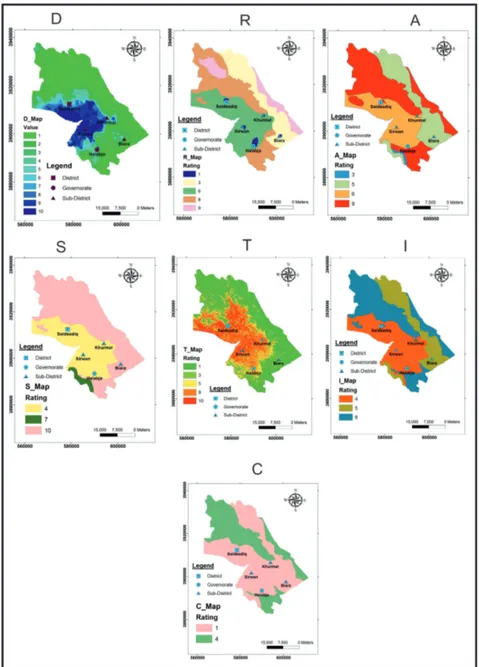
3.1 Standard DRASTIC Vulnerability Model (Papers 2 ,3,8,9 &10) ... 34
3.2 Modification of rate and weight of standard DRASTIC model (Paper 8) ... 40
xii
3.5 Analytic Hierarchy Process (AHP) Applied to DRASTIC Model (Paper 4) ... 43
3.6 VLDA Vulnerability Model (Papers 3 & 6) ... 44
3.6.1 Weight Determination in VLDA Model ... 45
3.7 COP Vulnerability Model (Papers 2 & 6) ... 46
3.7.1 C- Factor ... 47
3.7.2 O- Factor ... 47
3.7.3 P- Factor ... 47
4. Chapter Four :Results and Discussion ... 49
4.1 Result of standard DRASTIC Vulnerability Model (Papers 2 ,3,8,9 &10) ... 49
4.2 Result of modification of rate and weight of standard DRASTIC model (Paper 8) ... 49
4.3 Result of adding LULC layer to the standard DRASTIC model (Paper 9) ... 53
4.4 Result of adding Lineament density layer to the standard DRASTIC model (Paper10) 57 4.5 Result of modification of DRASTIC Model based on AHP process (Paper 4) ... 59
4.6 Result of VLDA Groundwater Vulnerability Mapping (Papers 3 & 6) ... 61
4.7 Result of COP Groundwater Vulnerability Mapping (Papers 2 & 6) ... 66
4.8 Comparison and Validation of the vulnerability maps ... 71
4.8.1 Comparison of the Vulnerability Maps ... 71
4.8.2 Validation of the Vulnerability Maps ... 71
4.8.2.1 Validation against the Nitrate Concentration ... 72
4.8.2.2 Validation against Groundwater Age Using Unstable Isotopes ... 73
5. Chapter Five :Conclusions and Future Works ... 81
5.1 Conclusions ... 81
5.2 Future Works... 83
Refrences ... 85 Part 2: Appended Papers
Paper 1: Twana O. Abdullah, Salahalddin S. Ali, Nadhir A. Al-Ansari and Sven Knutsson. (2016).
Classification of groundwater based on irrigation Water Quality Index and GIS in Halabja Saidsadiq Basin, NE Iraq. Paper published in Environmental Hydrology, volume (24), Paper (5).
Paper 2: Twana O. Abdullah, Ali S.S., Al-Ansari N. A. and Knutsson S. (2016). Groundwater
Vulnerability Using DRASTIC and COP Models: Case Study of Halabja Saidsadiq Basin, Iraq. Paper published in Scientific Research Publishing, Engineering, 2016, 8, 741-760.
Paper 3: Twana O. Abdullah, Salahalddin S. Ali, Nadhir A. Al-Ansari and Sven Knutsson. (2016).
xiii
Architecture 10 (2016) 1144-1159.
Paper 4: Twana O. Abdullah, Salahalddin S. Ali, Nadhir A. Al-Ansari and Sven Knutsson. (2018).
Possibility of Groundwater Pollution in Halabja Saidsadiq Hydrogeological Basin, Iraq Using Modified DRASTIC Model Based on AHP and Tritium Isotopes. Paper published in Geosciences 2018, 8, 236; doi:10.3390/geosciences8070236.
Paper 5: Twana O. Abdullah, Salahalddin S. Ali, Nadhir A. Al-Ansari and Sven Knutsson. (2019).
Hydrogeochemical Evaluation of Groundwater and Its Suitability for Domestic Uses in Halabja Saidsadiq Basin, Iraq. Paper published in Journal of Water, Cells 2019, 8, 312; doi:10.3390/cells8040312.
Paper 6: Twana O. Abdullah, Salahalddin S. Ali, Nadhir A. Al-Ansari and Sven Knutsson (2020).
Assessment of groundwater vulnerability to pollution using two different Models in Halabja Saidsadiq Basin, Iraq. Paper published in Journal of Groundwater for Sustainable Development 10 (2020) 100276.
Paper 7: Twana O. Abdullah, Salahalddin S. Ali, Nadhir A. Al-Ansari, Sven Knutsson and Jan Laue. (2020). Magnitude and Direction of Groundwater Seepage Velocity in Different Soil and Rock Materials. Paper published in Scientific Research Publishing, Engineering, 2020, 12, 242-253.
Papers Included in Licentiate Thesis
Paper 8: Twana O. Abdullah, Salahalddin S. Ali and Nadhir A. Al-Ansari. (2016). Groundwater
assessment of Halabja Saidsadiq Basin, Kurdistan region, NE of Iraq using vulnerability mapping. Arabian Journal of Geosciences (2016) 9:223, DOI 10.1007/s12517-015-2264-y.
Paper 9: Twana O. Abdullah, Salahalddin S. Ali and Nadhir A. Al-Ansari (2015). Effect of
Agricultural Activities on Groundwater Vulnerability: Case Study of Halabja Saidsadiq Basin, Iraq, Journal of Environmental Hydrology, Vol. 23, 408–423.
Paper 10: Twana O. Abdullah, Salahalddin S. Ali, Nadhir A. Al-Ansari and Sven Knutsson.
(2015). Groundwater Vulnerability Mapping Using Lineament Density on Standard DRASTIC Model: Case Study in Halabja Saidsadiq Basin, Kurdistan Region, Iraq, Engineering, Vol. 7, 644– 667.
Main Thesis
xv
Main Thesis
1
CHAPTER
1
Introduction 1. Introduction
Groundwater is the most significant water resource present beneath Earth's surface in soil and rock pore spaces and in the fractures of rock formations. In many arid and semi-arid areas in the world, it serves as the sole source of water for drinking, irrigation, agriculture, and industrial purposes. Groundwater quality can be affected by residential, municipal, commercial, industrial, and agricultural activities, particularly in relation to excessive application of fertilizers and unsanitary conditions. If this important source is polluted, it may reveal to a serious health hazard and environmental problems. In addition, occurrences of chemical components such as nitrate, bacteria and pesticides in groundwater have exhibited a significant increase in concentration and have stimulated research on the subsurface fate of contaminants. Prevention of groundwater contamination is the key to efficient and effective environmental management, as the groundwater treatment is expensive and slow. To protect groundwater resources, areas prone to contamination by human activity need to be delineated, which can be best accomplished through groundwater vulnerability assessment (National Research Council, 1993).
In the current studied basin, groundwater plays an important role in providing water for drinking, industrial and agricultural activities, particularly, some parts within the area which that is characterized by the lack of a water project. In addition, a considerable economic development, enhances security in the studied basin and after many years of destruction in the area with many war circumstances and the administrative structure of Halabja, which has changed from District to Governorate in March 2014, the studied area will mark the beginning of greater economic development. A striking point is the increase of the number of people heading to this basin and its surrounding region. This means that water consumption is on the rise. According to the data obtained from the Directorate of Groundwater in Sulaimani City (GDS,2014), the area holds several thousand deep wells. Thus, the study of the groundwater resources and its potential pollution in the area has become necessary. Moreover, it is worth noting that no other previous studies have been conducted on this vital area in terms of contamination. This leads to making this study of importance. In addition, all the municipal wastewater from the cities of Halabja and Saidsadiq and all other sub-district sites within this basin may infiltrate into the groundwater every year. These reasons play an important role to select this site as a case study to reveal the applicability of the proposed vulnerability and environmental assessments.
1.1 Study Area
The studied area is in the north-east part of Iraq; it is situated between Universal Transverse Mercator (UTM) coordinates 3,880,000 and 3,940,000 to the north and 560,000 and 610,000 to the east. Ali in 2007 divided this basin into two sub-basins: Halabja- Khurmal and Said Sadiq sub-basins, (Figure 1.1). The entire coverage area of both sub-basins is about 1278 Km2. The
climate in this area is characterized by distinct continental interior with hot summers and cold winters of the Mediterranean type, the average annual precipitation ranging from 500-700 mm. About 57% of the whole studied area is characterized by arable area due to its suitability for agricultural lands and usability of fertilizers and pesticides are common practices, so, it affects the groundwater quality (Huang et al., 2012).
2 Figure 1.1: Location map of the studied basin 1.2 Geological and Hydrogeological Setting
The geological and hydrogeological setting are described in the following sections:
1.2.1 Geological Setting
From the tectonic points of view, the area of the study is complex and located within Western Zagros Fold-Thrust Belt, (Buday and Jassim, 1987). According to Jassim and Goff (2006), it is located within the high folded zone, Imbricated, and thrust zones. The different lithological units that are exposed to the surface in the area are ranges from Jurassic to recent deposits, (Figures 1.2 & 1.3).
The oldest geological formations in this area are Sarki and Sehkanian formations, which are belongs to Early Jurassic. Sarki formation is thin bedded fine grained cherty and dolomitic limestone and Sehkanian formation comprises dark saccharide dolomites and dolomitic limestone with some solution breccias, (Bellen et al, 1959). Lower and middle Jurassic rocks included Barsarin (limestone and dolomitic limestone), Naokelekan (bituminous limestone) and Sargalu formations. The last one consists of well-bedded and well-crystallized, black bituminous limestone and dolomitic limestone and occasionally contains shells of posidoni, (Ali, 2007).
3
The Qulqula Group consists of two formations, the Qulqula Radiolarian and the Qulqula conglomerate. It occupies the lower part of the southwestern limb of the Avroman and Suren anticlines. Bolton (1958) and Buday (1980) mentioned that the Qulqula conglomerate formation is equivalent to the Quaternary sediments which exist in the foothills of Suren Mountains.
The Upper Cretaceous Kometan (Turonian) and Lower Cretaceous Balambo (Valanginian-Cenomanian) Formations are widespread and are exposed in both sub-basins. Both are lithologically very similar and composed of well bedded, white or grey pelagic limestone. The only difference is that the limestone of the latter formation is occasionally marly and containing interbedded marl. Shiranish Formation (Campanian) is composed of a succession of bluish white marl and marly limestone. Lithologically, Tanjero Formation is composed mainly of an alternation of thin beds of sandstone or siltstone with interbeds of shale, marl or rarely marly limestone (Ali, 2007).
Quaternary (Alluvial) deposits are the most important geological unit in the area in terms of hydrogeological characteristic and water supply. These sediments are deposited as debris flows on the gently sloping plains or as channel deposits or as channel margin deposits and over bank deposits (Ali, 2007). As recorded from drilled well logs, this unit consists of angular and poorly sorted clasts of boulder, gravel, and sand with more or fewer amounts of clay as separate deposits and some amount of limestone and chert fragments. The thickness of these deposits was recorded previously up to 200 m thick (Ali, 2007). During the field work of this study from the log of drilled water wells, the thickness of Alluvial deposits has been recorded as 300 m in thickness, this thickness may be more than 300 m, because the drilling process was stopped in this depth as the drilling rig reached to its maximum drilling ability .
1.2.2 Hydrogeological Setting
Halabja Saidsadiq basin is one of the most important basins in Kurdistan Region from the adequate quantity and quality. As can be depicted from the geological map of the area (Figure 1.2 and 1.3), different lithostratigraphic units from various ages are cropping out. Based on the
classification of Ali (2007), and depending on the hydrogeological and stratigraphically characteristics, the water bearing layers in the studied area are rearranged and categorized into several hydrogeological subdivisions. The hydrogeological map is constructed and presented in (Figure 1.4), and the classification of the main hydrogeological units is simply explained and
presented in (Table 1.1). Geological conditions and tectonic processes usually control the
hydrogeology of the study basin that affects groundwater occurrence, water level and movement. In addition, permeability and porosity are the main principal factors in determining the potential of the area to be considered as a water-bearing aquifer. According to the data recorded from field work and from groundwater level archives by Ground Water Directorate, the mountain series which surround the basin in the northeast and southeast are characterized by high water table level, while the center and the southeastern parts have a lower water table level. The groundwater movement is usually from north and northeastern to the southwest and from south and southeast to the southwest. Spring`s discharge represents the main groundwater outflow, mostly in the case of fissured karstic aquifer and intergranular aquifer and intergranular aquifers, (Figure 1.4). These springs are
classified into three classes (Ali, 2007), less than 10 l/sec such as Anab, Basak, Bawakochak and 30 other springs, 10-100 l/sec such as Sheramar, Qwmash, Khwrmal, Garaw and Kani Saraw springs and more than 100 l/sec such as Ganjan, Reshen, Sarawy Swbhan Agha springs.
4
Groundwater in the studied basin recharged by several rivers and streams such as Sirwan river, Zalm stream, Chaqan stream, Biara, Reshen stream and Zmkan stream. In addition, all these rivers and streams are considered as a main recharge source of Derbandikhan Lake, located in the southeast of the basin.
Figure 1.2: Geological map of the studied basin, modified from (Ali, 2007) 1.2.2.1 Seepage velocity of different groundwater aquifers (Paper 7)
Seepage velocity (vs) is the actual velocity following through voids or porous media
(n) is always higher than discharge velocity (v). The seepage velocity can be calculated by using the following equation, (ESRI,2017):
5
Figure 1.3: Cross Section through A-B Line Table 1.1: Aquifers system in the studied basin
Aquifer Type Formation Geologica Thickness (m) Regarding Aquifer References, Thickness
Intergranular
Aquifer (AIA) Quaternary Deposits 300 Author Fissured Aquifer
(CFA) Qulqula Group 500 Jassim and Goff,2006 Fissured-Karstic
Aquifer (CKFA) Balambo Kometan 250 Ali,2007 Karstic-Aquifer
(TKA) and (JKA) Avroman Jurassic 80-200 200 Jassim and Goff,2006 Non-Aquifer
(Aquitard, TAT) /Aquiclude
Tanjero 2000 Jassim and Goff,2006 Shiranish 225
6
Figure 1.4: Hydrogeological map of the studied basin modified from (Ali, 2007)
Where: vs is the seepage velocity in (m/day), v is the Darcy's velocity in (m/day) and n
is the effective porosity. Darcy's Law states that the Darcy velocity (v) in a porous medium is calculated from the head gradient (the change in the head per unit length in the direction of flow in an isotropic aquifer) and hydraulic conductivity (k), (ESRI,2017) as:
v = -k(dh/dl) ……… (1.2)
Where: v is the Darcy Velocity, k is the hydraulic conductivity (m/d), dh/dl is the hydraulic gradient (the change in the hydraulic head per unit length in the direction of the flow in an isotopic aquifer). The negative sign indicates that the flow of water is in the direction of decreasing head.
Where the hydraulic conductivity (k) can also be calculated from the transmissivity (T) and thickness (b) as k = T / b. Hydraulic conductivity define as the rate of flow under a unit hydraulic gradient through a unit cross-sectional area (A) of aquifer, T (Transmissivity) is the rate of flow under a unit hydraulic gradient through a unit width of the aquifer (b).
The Darcy Flow function calculates the groundwater volume balance residual, flow direction, and magnitude grids. The tool assumes a steady state flow within the modeled aquifer.
7
The inputs for the tool are a set of raster’s (all raster’s have to have the same extent and cell size); including groundwater elevation head, effective formation porosity, aquifer saturated thickness and aquifer transmissivity.
The groundwater elevation heads, and the aquifer saturated thickness were interpolated from a set of the wells using Inverse Distance Weight (IDW). Transmissivity of the aquifer is calculated from pumping well test analysis using AQTESOLV for Windows software and then interpolated using the interpolation tools, the transmissivity in the area decrease toward the south-western part with the range of (0.28-2431) m2/d. Porosity of each aquifer has been estimated from (Tood and Mays,2005) as explained in the (Table 1).
Darcy`s velocity map for the studied area was generated with the aid of groundwater command in the spatial analysis tools in GIS/ArcMap software 10.3 using IDW method for interpolation. From the groundwater head elevation above sea level in meter, the shallowest water table was found towards the South-western part; this means that the ground water is flowing from the Northeastern towards Southwestern. The study area was characterized by different groundwater aquifers of different lithological materials, for which the effective porosity of these materials which were estimated from recommended representative porosity, (Table 1.2). The effective porosity
estimated for these aquifer materials in the studied area was in the range of (26%-37%). Saturated thickness of each formation has been interpolated from a set of the wells using (IDW). The saturated thickness varies in the area due to different in hydrogeological properties, in general the saturated thickness decreases toward the North-eastern part.
Table1.2: Representative value of porosity, after (Tood and Mays,2005) Aquifer materials Porosity in percent
Dolomitic Limestone 26
Limestone >26-30
Mixture of clay, sand and gravel >30-34 Sandstone and marly limestone >34-37
Dolomitic Limestone 26
Limestone >26-30
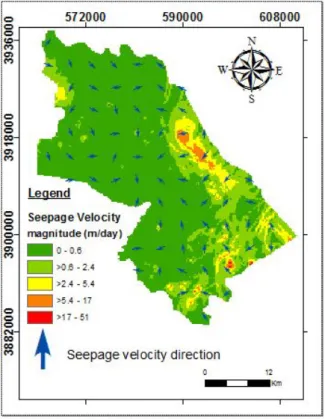
Seepage velocity direction and magnitude maps were constructed from Darcy Velocity command in the Arc-Map software, (Figure 1.5). The seepage velocity magnitude ranged
from (0-51) m/d. In general, the flow direction is from the Eastern part (higher velocity magnitude) to the Western part (lower velocity magnitude) of the studied area. The factor controlling the flow direction in this area refer to the direction of dipping strata of geological formation, the high elevation head of groundwater in the eastern part and low transmissivity in the western part.
1.3 Climate
According to Koppen's classification, the climate of Kurdistan Region has been identified as arid and semi-arid climate. It is hot and dry in summer and cold and wet in winter, with short spring and autumn seasons compared to summer and winter. In winter, Kurdistan Region falls under the influence of Mediterranean cyclones that moves east to a northeast over the region. The Arabian Sea cyclones move northward passing over the Arabian Gulf carrying great amounts of moisture causing large amounts of precipitation over Kurdistan Region. Occasionally, European
8
winter cyclones move eastward to the southeast part of Turkey and over the mountainous area of Kurdistan Region, bringing substantial amounts of rain and snow. In summer, the region falls under the influence of sub-tropical high-pressure belts and Mediterranean anticyclones. The sub-tropical high-pressure centers that move from west to north and northeast passing over the Arabian Peninsula carrying sand and dust to the region (Al-Ansari et al.,2014) and (Saeed and Abas, 2008).
Figure 1.5: Groundwater seepage velocity magnitude and direction in the studied basin
Due to the unavailability of gauging and recently operated meteorological stations in Saidsadiq area, the climatic data of meteorological department station in Halabja city during the periods of 2002-2014 was utilized to analyze the climatic condition for the entire study area. The available climatic variables for this station are daily relative humidity in percent (%), wind speed (m/s), wind direction and speed, minimum, maximum, and mean temperature (°C), open free surface evaporation (mm), rainfall (mm), and sunshine duration (hrs). The maximum average monthly temperature was around 45 oC in July and August while the lowest average degree was
around -2 oC recorded in January and February. This extreme characteristic is one of the main
conditions of continental climate.
Precipitation was one of the most important parameters in analyzing water balance and aquifer recharge, as well as in assessing aquifer vulnerability. The study area is a part of the region affected by the Mediterranean climatological system, so precipitation occurs entirely during winter and spring seasons. Most of the annual precipitation occurs from October to May. The four remaining months are commonly dry. The monthly maximum average precipitation is 135.74 mm
9
in February, (Figure 1.6). The average annual precipitation was 691.2 mm during the period of
2002–2014, (Figure 1.7).
Figure 1.6: Average monthly precipitation of Halabja Station, period (2002-2014)
Figure 1.7: Annual precipitation of Halabja Station, period (2002-2014)
The relative humidity was maximum in winter season and minimum in summer season. An inverse relationship between air temperature and relative humidity exists, as temperature increases the relative humidity decrease and vice versa, (Figure 1.8).
Oct. Nov. Dec. Jan. Feb. Mar. Apr. May Jun. Jul. Aug. Sep. Average 36,88 74,36 114,5 101,1 135,7 88,84 103,8 34,33 0,85 0,00 0,04 0,63 0 20 40 60 80 100 120 140 160
Pr
ec
ip
ita
tio
n (
m
m
)
2002-2003 2003-2004 2004-2005 2005-2006 2006-2007 2007-2008 2008-2009 2009-2010 2010-2011 2011-2012 2012-2013 2013-2014 Average 895,7 705,4 823,6 872,7 684,4 396,1 473,9 857,2 626,9 585,3 886,8 486,4 0 100 200 300 400 500 600 700 800 900 1000 Pr ec ip ita tio n-mm10
Figure 1.8: Relationship between temperature and relative humidity of Halabja Station 1.3.1 Climatic Classification
To establish the climate type and the aridity index of the studied basin, the recommended classification by AL–Kubaisi (2004) was applied as explained in (Table 1.2). Based
on this classification, the following modes were used:
• Mode (1), this option is to identify the possible climatic zonation as (Humid, Moist) and (Arid, Sub–arid), (Table 1.3), by using the following equation:
AI-1 = (1*P) / (11.525 * t) ... (1.3)
• Mode (2), this option is to evaluate the sub-zones from the results of type 2 mode as in (Table 1.1). It is calculated based on the following equation:
AI-2= 2√P/t... (1.4) Where: AI= Aridity Index
P = Annual rainfall (mm) t = Average temperature (C°)
Aridity index was calculated by applying equations (1.1 and 1.2), which are equal to
2.86 and 2.5, respectively. According to this classification, the climate of the studied basin classified as humid to moist and moist for both modes 1 and 2, respectively.
1.4 Literature Review
The vulnerability mapping approaches have been greatly studied. In the early 1980s, the uses of parameter weighting schemes and the utilization of GIS technology have been carried out (Corwin et al., 1997; Fuest et al., 1998). An excellent example of this is the DRASTIC approach
Oct. Nov. Dec. Jan. Feb. Mar. Apr. May Jun. Jul. Aug. Sep. Av.Humidity 35 52 57 59 60 51 49 39 23 29 30 36 Av.Temp. 23,82 14,35 9,03 8,18 8,80 13,45 18,33 23,70 32,14 35,27 35,08 30,00 0 10 20 30 40 50 60 70
Av
er
.Tem
per
at
ur
e (
oC)
an
d
Re
la
tiv
e h
um
id
ity
(%
)
Period of water surplus
11
of Aller et al., (1985). This entire analysis has been recently shown to be feasible using the GIS technology (Fabbri and Napolitano, 1995).
Table 1.3: Type1 and type2 mode options climate classification (Al–Kubaisi, 2004)
Mode 1 Evaluation Mode 2 Evaluation
AI. 1 > 1.0 Humid to moist
AI. 2 > = 4.0 Humid AI. 2 < 4.0
AI. 2 >= 2.5 Humid to moist AI.2 < 2.5
AI.2 > = 1.85 Moist AI.2 < 1.85
AI.2 >= 1.5 Moist to Sub- arid AI. 1 < 1.0 Sub–arid to arid AI.2 < 1.5 AI.2>= 1.0 Sub- arid
AI.2 < 1.0 Arid
Though DRASTIC has been successfully validated for the occurrence of a specific pollutant such as pesticides and nitrates in the groundwater system, (Navulur and Engel, 1998). Yet, it has been a poor predictor of general groundwater vulnerable regions (Maas et al., 1995; Barbash and Resek 1996; Garrett et al., 1989; Koterba et al. 1993; USEPA 1993). Groundwater vulnerabilities were studied in the world by several researchers such as the following:
• Secunda et al., (1998) have used composite models along with DRASTIC for the assessment of groundwater vulnerability in Israel. The methodology employed extensive agriculture land use data and empirical means to characterize aquifer vulnerability.
• Al-Adamat et al., (2003) have produced groundwater vulnerability and risk maps for Azraq basin of Jordan using GIS, remote sensing and DRASTIC.
• Lowe et al., (2003) applied a similar overlay index approach on the existing data for western United States of America to produce pesticide sensitivity and vulnerability maps using GIS methods.
• Babiker et al., (2005) have also used a GIS integrated DRASTIC model to evaluate the vulnerability of Kakamigahara aquifer in Central Japan.
• Worral and Kolpin (2004) have examined the validity of the UK vulnerability system and found it to be in complete statistical disagreement with the actual groundwater contamination observations.
• Hussain (2004) has studied groundwater vulnerability assessment of the Ganga-Yamuna interfluves area in India using GIS. It was visualizing the methods currently available for assessment of the groundwater vulnerability and to develop an appropriate method suitable for the alluvial aquifers of the Ganga-Yamuna interfluves' area. Attempts have been made to develop a multipurpose database in GIS environment, and to validate the developed method by comparing its findings against the observed water quality characteristics of the region. • Dixon (2005) has also developed similar ground water vulnerability maps using three newly
developed indices based on the detailed land use and land cover, pesticide and soil structure information and the selected parameters from the DRASTIC model. GIS, GPS, remote
12
sensing and fuzzy rule-based methods were used for generating groundwater sensitivity maps.
• Worrall and Tim (2005) have evaluated the vulnerability of groundwater to pesticide contamination based on a Bayesian method for the major aquifer units of southern England. • Groundwater vulnerability and risk mapping assessment based upon a source–pathway–
receptor approach is presented by Nobre et al., (2007) for an urban coastal aquifer in northeastern Brazil.
• Ducci (2010) has studied aquifer vulnerability assessment methods: The non-independence of parameter`s problem in southern Italy.
• Neha Gupta (2014) studied groundwater vulnerability assessment using DRASTIC method in Jabalpur district of Madhya Pradesh in India.
• A number of other alternative indices methods based on a range of parameters such as landuse (Crowe and Booty, 1995); travel time (Maxe and Johansson, 1998); chronic toxicity (Britt et al., 1992) and attenuation and retardation factors have been developed (Rao et al., 1985). For example, Shukla et al., (2000) have applied an attenuation factor-based method of Rao et al., (1985) to show that there was a general agreement between the vulnerability prediction and observed groundwater contamination. Zektser et al., (2004) used a Point Count System (PCS) to study the impact of pollution on the Snake River aquifer system in eastern Idaho, United States. Stewart et al., (2004) have applied a Type Transfer Function (TTF) approach to generate a regional-scale non-point-source ground water vulnerability assessment for the San Joaquin Valley, California. The development and application-based decision support framework of a GIS that integrates field scale models for assessment of nonpoint-source pollution of groundwater in canal irrigation project areas were presented by Chowdary et al., (2005).
In relation to studying of the groundwater vulnerability system for Kurdistan Region, for the first time in the Region, groundwater vulnerability mapping was studied by (Hamamin, 2011). He has studied hydrogeological assessment and groundwater vulnerability map of Basara Basin in Sulaimani Governorate using DRASTIC Model. Therefore, the current study is the second attempt in Kurdistan region and the first attempt on the study basin in terms of groundwater vulnerability mapping. Conversely, this study attempts to modify DRASTIC model based on the current groundwater quality and then to apply a different further recommended model for comparing and validating the result of vulnerability zonation achieved from different models.
Some other provincial studies are directly or indirectly related to hydrogeological and hydrological conditions, which have been done around the studied area. These studies can be summarized as follows:
• Parsons (1957) has investigated the groundwater resources in Sulaimani Liwa area. The investigation included collection, evaluation and correlation of geological and hydrogeological information pertaining to groundwater in the area.
• The Hydrological condition of Sharazoor plain was studied by Polservice (1980).
• Hydrology, climate, and morphometric measurements of some watersheds in Sulaimani region have been studied by Barzinji (2003).
• Rauf (2004) has studied the most feasible economically and technically proposed system to satisfy the present and the future water supply demand of Halabjay Shaheed, Sirwan and Said Sadiq.
13
• Stevanovic and Markovic. (2003 and 2004) have studied the regional geology and hydrogeology of the governorates of Sulaimani, Erbil, and Dohuk, through the FAO United Nation program.
• Ali (2005) has studied the effect of slide masses on groundwater occurrence in some areas of Sharazoor plain-NE of Iraq.
• Ali and Al-Manmi (2005) have studied geological and hydrochemical study of Zalim Spring, Shahrazoor, Sulamania, Iraq.
• Karim and Ali (2005) have examined the Origin of Dislocated Limestone Blocks on the Slope Side of Baranan (Zirgoez) Homocline: it is an attempt to outlook the development of western part of Sharazoor plain.
• Parsons (2006) has offered a report of public water supplies; the demand and growth parameters have also predicated on the expansion of the distribution systems in the urban areas to serve the full population.
• Stratigraphy and lithology of the Avroman Limestone Formation (Triassic) were studied in Iraq and Iran by Karim (2006).
• Ali (2007) has studied the investigation of the Sharazoor-Piramagroon basin in details in terms of Hydrogeological and morphometrical point of view. So, the aquifers` properties recharge estimation, chemical and bacteriological tests, sustainability of the groundwater resources, as well as the main risks and problems which have currently have an impact on the basin are also exposed.
• The water balance method was used by Al-Tamimi (2007) for conjunctive use of surface and subsurface water in Diyala basin. He had divided the basin into three sub basins, top Diyala, middle Diyala and south Diyala. The top Diyala sub-basin has represented by Darbandikhan basin.
• Baziany and Karim (2007) have re-studied possible the Qulqula conglomerate Formation in Halabja - Avroman area for the second time. They have proposed a new concept for the origin of accumulated conglomerate, those studies are considered the Qulqula conglomerate Formation as a part of Qulqula group, which overlies Qulqula radiolarian formation. • Muhammed (2008) has studied drinking water quality assessment of Halabja area.
• Al- Jaf (2008) has presented a research entitle Error Measurement in Digital Elevation Models in Penjween-Halabja Area, that made a comparative between the Digital Elevation Models (DEM) taken from the Shuttle Radar Topography Mission (SRTM) and the data taken by Global Positional System device (GPS) of Garmin type.
• Sharbazheri (2008) has studied the Cretaceous-Tertiary (K/T) boundary section, which crop out within the High Folded Zone, Imbricated Zone and extended in northwest- southeast direction as a narrow trend near and parallel to the Iraqi / Iranian borders.
• Saprof (2008) has arranged the implementation plan for a Sirwan river project in Halabja. The feasibility study analyzes the economic and technical aspects, as well as financial viability of the project.
• Al-Mashhadani, et al., (2009) have studied dominant Landcover/ Landuse type in Sharazur Plain by using remote sensing techniques. The results indicated that there are 12 classes of Landuse / Landcover.
14
• Karim, et al., (2009) have studied historical development of the lineaments of the Western Zagros Fold-Thrust Belt in the Halabja City. They have also studied sedimentology and geochemistry of the limestone successions of the lower member of the Qulqula Formation. • Raza (2009) has studied the lower member of Qulqula Formation in the Thrust Zone,
(Kurdistan Region) near the Iraqi-Iranian borders.
• Al-Jaf and Al-Azawy (2010) have studied the integration of remote sensing images and GIS techniques to locate the mineral showings in Halabja area. Using satellite data received from ETM+ sensor that borne on Landsat 7 satellites depended on band rationing mean bands,
band ratio color composite and threshold techniques.
• The environment, history, and archaeology of the shahrizor survey project have investigated by AL-Taweel, et al., in (2011).
• Land use / land cover changes of the Halabja city in the north part of Iraq over 1986 to 1990 by utilizing multi-temporal remote sensing Landsat images (TM) were studied by Al-Doski, et al., (2013 a & b).
• Zakaria et al., (2013) have estimated the annual harvested runoff at Sulaymaniyah Governorate, Kurdistan Region of Iraq.
• Rauf, (2014) has studied Groundwater Potential Mapping and Recharge Estimation of Halabja Area, North East of Iraq.
• Al-Ansari et al in 2014 has studied climatic change and long-term future trends of rainfall at north-eastern part of Iraq. In this research, long term rainfall trends up to the year 2099 were predicted in Sulaimani city northeast Iraq to give an idea about prospects.
• Hamamin (2016) has studied Groundwater Vulnerability Map of Sulaymaniyah Sub-basin using SINTACS model, Sulaymaniyah Governorate, Iraqi Kurdistan Region.
• Hamamin et al., (2018) also have studied hazard and risk intensity maps for water-bearing units: a case study in the Sulaimani sub-basin / North East of Iraq. They have applied the intrinsic vulnerability, hazard and risk intensity mapping to assess the risk harmfulness in the Sulaimani sub-basin by combining hydrogeological parameters using the DRASTIC system and the hazard components by taking the product of the weighted hazard value (HI), the ranking factor (Qn) and the reduction factor (Rf).
1.5 Environmental Impacts
Enough awareness stands for status of physical environment and understanding of the process involved is required for the health and safety assurance of the people who depend on urban resources particularly water resources. As declared by Montgomery (1997), human activities are modifying chemicals and element concentrations especially trace elements, which enter environment and cause pollution and disease and influence health. In the studied basin, rapid industrial and agricultural growth has taken place recently. This is likely to become manifold in near future, particularly in areas like Halabja City and SaidSadiq District.
The dispose of the municipals' wastewater to the environment in the studied basin is through much sewage effluent boxes around the city (Plate 1.1). This sewage is a complex mixture
of water consisting of wastes of human, domestic and industrial origin. Associated environmental hazards with use of sewage are contamination of groundwater and accumulation of heavy metals such as cadmium (Cd) and toxic organics in surface soils and water bodies (Roy, 2000). Sewage farm workers are also liable to become infected with cholera if irrigation is practiced with raw
15
wastewater derived from an urban area in which a cholera epidemic is in progress (Shuval et al., 1985). However, morbidity and serological studies on wastewater irrigation workers or wastewater treatment plant workers occupationally exposed to wastewater directly and to wastewater aerosols have not been able to demonstrate excess prevalence of viral diseases.
With the rapid increase in population and growth of industrialization in the area, pollution of surface and groundwater by municipal and industrial wastes has increased tremendously, as the method of waste disposal in the studied basin is land filling (Plate 1.2). This
process of waste disposal focuses on burying the waste in the land. In the absence of well-designed sanitary landfills, municipal and industrial solid waste is invariably dumped on land, creating general nuisance and degradation of soil and water in quality.
In addition, with the advent of industrial revolution and rapid growth of population in the studied basin came the demand for a better source of energy such as petrol filling station. Petrol stations are classified as objects of a potentially high environmental impact. Several petrol stations, fuel bases and fuel tanks are operated in the studied basin, (Plate 1.3). The establishment of such
industries has led to environmental pollution.
A: Sewage effluent boxes at south east -Halabja City
16
C: Sewage effluent boxes at NW of SaidSadiq District Plate 1.1: Sewage effluent boxes at the studied basin
A: Unsystematic waste disposing at Halabja City
B: Unsystematic covering waste after disposing with soil at Halabja City Plate 1.2: Municipal waste disposal method at the studied basin
17
With the expanding population during last few decades, agricultural production has also increased to meet their needs. The potential for irrigation has been increasingly tapped to raise both agricultural productivity and the living standards of the rural and urban population. Irrigated agriculture occupies a major place in the studied basin (Plate 1.4). Extensive use of fertilizers and
pesticides has been observed in the studied basin, increasing the risk of contamination of groundwater by nutrients and toxic pesticide residues.
Plate 1.3: Contaminated land from petrol products inside of the Halabja City
Plate 1.4: Agricultural land around the city of Halabja 1.6 Scope of the Work
Presently, there is no environmental groundwater quality and vulnerability assessments in Halabja Saidsadiq Basin, and the area which will mark the beginning of greater economic development and advancement. This leads to increase the contaminant materials from human waste and constructing several factories. In addition, groundwater aquifers in the study area are the main source of water supply to various urban requirements. This means that groundwater can be easily contaminated.
In the present study, environmental impacts on groundwater quality had been studied, in addition; different available methods were applied and revised for assessing groundwater vulnerability to pollution, namely, DRASTIC, COP and VLDA, along with the modifying DRASTIC model to build a suitable model for the studied basin. It is also planned to validate the
18
vulnerability by comparing the results with the observed groundwater quality and groundwater age using a radioactive isotope of hydrogen (Tritium) of the study basin.
1.5 Objectives of the research
The approach comprises the following steps adopted in this study:
• Reviewing different approaches and methods of aquifer vulnerability assessment.
• Characterizing the geological and hydro-geological setting necessary for applying the vulnerability analysis.
• Analyzing the climatic characterizes of the studied area using the most recently methods. • Evaluating the hydrochemical properties in different types of groundwater aquifers, to
establish the groundwater quality and its validity for drinking, irrigation and industrial usage depending on the most recently models.
• Investigating the soil characteristics and land use and land cover (LULC) in the studied area. • Using the remote sensing techniques to analyze land use and land cover and lineament
features in the studied basin from the most recent available satellite images.
• Preparing the aquifer vulnerability maps employing some of the available approaches including (original DRASTIC, weight modified VLDA and original COP) models.
• Modifying DRASTIC models to prepare the most accurate aquifer vulnerability map for the study area.
• Comparing between constructed groundwater vulnerability maps.
• Validating the result using the existing groundwater age and groundwater quality scenarios, to map the best vulnerability situation to reveal the probable contamination hazard.
19
CHAPTER 2 Groundwater vulnerability and Groundwater Quality 2. Groundwater vulnerability and Groundwater Quality
2.1 Groundwater vulnerability
As water moves through the hydrologic cycle, its quality changes in response to the differences in the environment through which it passes. The changes may be either natural or human induced. The fundamental concept of groundwater vulnerability assumed that the physical environment may provide some degree of protection or referred to as the barrier zone, regarding the threat or contaminants move into the groundwater resource. The earth materials may act as natural filters to screen out some contaminants. Water infiltrating at the land surface may be contaminated but is naturally purified to some degree as it percolates through the soil and other fine-grained materials in the unsaturated zone.
Generally, the term groundwater vulnerability is used to signify the intrinsic characteristics of the aquifer which establish whether it is likely to be affected by an imposed contaminant load (National Research Council, 1993). The fundamental concept of groundwater vulnerability is that some land areas are more vulnerable to groundwater contamination than others. There are two classes of vulnerability, intrinsic vulnerability, which depends exclusively on the properties of the groundwater system, and specific vulnerability, where these intrinsic properties are referenced to a contaminant or human activity.
Nowadays, aquifer vulnerability assessments are carried out in almost all developed countries in areas where water resources are under stresses originating from urbanization, industrial and agricultural activities.
Vulnerability assessment is based on the likely travel time for water to move from the ground surface towards the groundwater aquifers. The greater the travel time, the greater is the opportunity for contaminant concentration. Aquifer vulnerability can also be measured by employing the appropriate mathematical framework further subdivided into broad classes like very high, high, moderate, low, and very low, depending upon the governing criteria.
2.1.1 Groundwater vulnerability in the studied basin
Water has always played a crucial role in human societies. Water permeates all aspects of life on Earth. Like the air we breathe, water sustains human, animal and plant life. It provides vital services for human health, livelihoods and well-being and contributes to economic growth and sustainability of ecosystems. As surface water quantity and quality continue to reduce over the years as a result of rapid population growth, urbanization, and pollution, in developing areas, groundwater becomes the source of potable water supply, Halabja Saidsadiq Basin is a typical example of this situation. Furthermore, substantial unsystematic economic progresses of the studied basin were noted, such as, construction of many oil refineries, petrol stations with unsafe design in terms of oil leakage, in addition to unsystematic municipal waste disposal and sewage system that have many environmental impacts.
Likewise, it is important to point out; contamination assessment project has not been performed previously on this vital area of study, which makes this study of highly importance. This
CHAPTER 2 Groundwater Vulnerability and GW Quality
20
emphasizes the growing vulnerability and susceptibility of groundwater potential pollution challenges. In view of the above mentioned reasons, it was felt that there is a need for ascertaining groundwater vulnerability in different ways in the study basin, involving required modifications for the recommended standard models and applying additional dynamic factors like impact of land use and land cover changes, and the effect of surface features such as lineaments along with its validation using realistic groundwater quality and groundwater age data.
2.2 Groundwater Quality (Papers 1 & 5)
The insufficiency of freshwater resources has become an important concern worldwide. Groundwater is of importance for public drinking water supply, especially for the residents of arid and semi-arid regions (Mtoni et al, 2013). However, rapid urbanization and increasing populations have accelerated the consumption of groundwater resources and caused serious environmental problems and groundwater pollution in the last few decades (Yakirevich et al, 2013).
In order to evaluate the quality of groundwater in the studied area, 78 groundwater samples were collected and analyzed during the dry season (September 2014) and wet season (May 2015), for major, minor and heavy metals to evaluate the seasonal variation in groundwater quality. Temperature, electrical conductivity, pH, and turbidity in situ were measured instantaneously using multi-parameter portable device model (TPS/90FL-T Field Lab Analyzer). Sample collection from the drilled wells was often conducted after continuous pumping of 5 -10 minutes. For the chemical analysis, a 250 ml plastic bottle was filled at each locality.
2.2.1 Uncertainty Measurement of Chemical Analysis
Every measurement is subject to an element of uncertainty, which may be condensed by improving the method or re-analyzing but can never be eliminated. This uncertainty consists of two contributions: systematic error (accuracy) and random error (precision) (Gill, 1997; Appelo and Postma, 1999 and Rao, 2006).
2.2.1.1 Precision (Random Error) of Chemical Analysis
Random error of chemical analysis is the precision of a measurement, which is readily determined by comparing data to carefully replicated experiments under the same conditions. The term "precision" is used in describing the agreement with a set of results among themselves (Al– Manmi, 2002). Precision is usually expressed in terms of the standard deviation obtained from replicating measurements. The smaller the standard deviation, the more precise the analysis. As explained by Stoodly (1980), precision or "Coefficient of Variation" which represents standard deviation from a group data comparing with mean %. So, to calculate precision percentages, the following equation has been used:
CV(Precision)%= 2 𝑆𝑆𝑆𝑆
𝑋𝑋� 𝑋𝑋 100 ………...……. (2.1)
The accepted limit or certain limit (95 % confidence) according to Maxwell, (1968) is between 5 to 25 %.
The accuracy of analysis was calculated according to the equation (2.1). Four samples
were taken for this purpose for cations and anions for each dry and wet season, and two samples for heavy metals only for the wet season. Each sample was divided into three equal portions, and then