ENT OF AGRICULTURE URAL ENGINEERING USINESS
s,
Colorado.
c•• , ,041 L -2— -a--GC/ - , ';
e •PENALTY FOR PRIVA
AVOID PAYMENT OF POSTAGE $300
-/ 00 L c) /
146
(tEEDINGS
AMERICAN SOCIETY OF CIVIL ENGINEERS FOUNDED 1852American Society
of
Civil Engineers
SEPTEMBER
1935
VOLUME
61
NO.
7
1
PROCEEDINGS
OF THEAMERICAN SOCIETY OF CIVIL ENGINEERS
VOL. 61 SEPTEMBER, 1935 NO. 7
TECHNICAL PAPERS
AND
DISCUSSIONS
Published monthly, except June and July, at 99-129 North Broadway, Albany, N. Y., by the American Society of Civil Engineers, Editorial and General Offices at 33 West
Thirty-ninth Street, New York, N. Y. Reprints from this publication may be made on condition that the full title of Paper, name of Author, page
reference, and date of publication by the Society, are given.
Entered as Second-Class Matter, December 28, 1931, at the Post Office at Albany. N. Y.. under the Act of March 3, 1879. Acceptance for mailing at special rate of postage
provided for in Section 1103, Act of October 3, 1917, authorized on July 5, 1918. Subscription (if entered before January 1) $8.00 per annum. Price $1.00 per copy.
Copyright, 1935, by the AMERICAN SOCIETY OF CIVIL ENGINEERS Printed in the United States of America
CURRENT PAPERS AND DISCUSSIONS
Discussion closes An Asymmetric Probability Function. J. J. Slade, Jr Oct., 1934
Discussion (Author's closure) .Dec., 1934, Jan., Feb., Mar., Apr., May, Sept., 1935 Closed Analysis of Continuous Structures by Traversing the Elastic Curves.
Ralph W. Stewart Oct., 1931
Discussion (Author's closure) Dec., 1934, Feb., Mar., May, Sept., 1935 Closed Relation Between Rainfall and Run-Off from Small Urban Areas. W. W.
Horner and F. L. Flynt Oct., 1934
Discussion May 1935 Sept., 1935
The Silt Problem. J. C. Stevens Oct., 1934
Discussion Feb., Mar., May, Sept., 1935 Uncertain Effect of Secondary Stresses Upon Ultimate Strength. John I. Parcel and
Eldred B. Murer Nov., 1934
Discussion Jan., Mar., Aug., 1935 Sept., 1935
The Springwells Filtration Plant, Detroit, Michigan. Eugene A. Hardin... Nov., 1934
Discussion (Author's closure) Jan., Sept., 1935 Closed Analysis of Multiple Arches. Alexander Hrennikoff Dec., 1934
Discussion May, Sept., 1935 Sept., 1935
Rational Design of Steel Columns. D. H. Young Dec., 1934
Discussion Mar., May, Aug., 1935 Sept., 1935
A Direct Method of Moment Distribution. T. Y. Lin Dec., 1934
Discussion Mar., May, Aug., 1935 Sept., 1935
Elastic Properties of Riveted Connections. J. Charles Rathbun Jan., 1935
Discussion Feb., May, Aug., 1935 Oct., 1935
Analysis of Thick Arch Dams, Including Abutment Yield. Philip Cravitz ....Jan., 1935
Discussion Sept., 1935 Oct., 1935
Hydraulic Laboratory Results and Their Verification in Nature. Herbert
D. Vogel , Jan., 1935
Discussion May, Aug., 1935 Oct., 1935
The Hydraulic Jump in Terms of Dynamic Similarity. Boris A.
Bakh-meteff and Arthur E. Matzke Feb., 1935
Discussion Mar., May, Aug., Sept., 1935 Oct., 1935 Frictional Resistance in Artificially Roughened Pipes. Victor L. Streeter... .Feb., 1935
Discussion Aug., 1935 Oct., 1935
Stabilizing Constructed Masonry Dams by Means of Cement Injections
D. TV. Cole Feb., 1935
Discussion Aug., Sept., 1935 Uncertain
Weights of Metal in Steel Trusses. J. A. L. Waddell Feb., 1935
Discussion May, 1935 Oct., 1935
Line Load Action on Thin Cylindrical Shells. Herman Schorer Mar., 1935
Discussion Sept., 1935 Nov., 1935
Underground Corrosion. K. H. Logan Mar., 1935
Discussion Apr., Aug., 1935 Nov., 1935
The Adjustment of a Level Net. George H. Dell Apr., 1935
Discussion Aug., 1935 Nov.. 1935
Structural Beams in Torsion. Inge Lyse and Bruce G. Johnston Apr., 1935
Discussion Aug., 1935 Nov., 1935
Photo-Elastic Determination of Shrinkage Stresses. Howard G. Smits May, 1935
Discussion Sept., 1935 Nov.. 1935
The Shear-Area Method. Horace B. Compton and Clayton 0 Dohrenwend May, 1935
Discussion Aug., 1935 Nov., 1935
Flood-Stage Records of the River Nile. C. S. Jarvis Aug., 1935 Nov., 1935 Distribution of Stresses under a Foundation. A. E. Cummings Aug., 1935 Nov., 1935 Some Low-Temperature Characteristics of Bituminous Paving Compositions
Hugh W. Skidmore Aug., 1935 Nov., 1935
Failure Theories of Materials Subjected to Combined Stresses. Joseph Marin Aug., 1935 Nov., 1935
NOTE.—The closing dates herein published, are final except when names of prospective
1
VOL. 61 PROCEEDINGS No. 7
CONTENTS FOR SEPTEMBER, 1935
PAPERS
PAGE
Adaptation of Venturi Flumes to Flow Measurements in Conduits.
By Harold K. Palmer, M. Am. Soc. C. E., and Fred D. Bowlus, Assoc. M. Am. Soc.
C. E. 961
The Stress Function and Photo-Elasticity Applied to Dams.
By John H. A. Brahtz, Esq 983
Flood and Erosion Control Problems and Their Solution.
By E. Courtland Eaton, M. Am. Soc. C E 1021
DISCUSSIONS An Asymmetric Probability Function.
By J. J. Slade, Jr., Esq 1051
Analysis of Continuous Structures by Traversing the Elastic Curves.
By Ralph W. Stewart, M. Am. Soc. C. E 1065 The Silt Problem.
By Herman Stabler, M. Am. Soc. C. E 1075 The Springwells Filtration Plant, Detroit, Michigan.
By Eugene A. Hardin, M. Am. Soc. C. E 1083 Analysis of Multiple Arches.
CONTENTS FOR SEPTEMBER, 1935 (Continued)
PAGE
Analysis of Thick Arch Dams, Including Abutment Yield.
By Messrs. I. M. Nelidov, and A. Floris 1089 The Hydraulic Jump in Terms of Dynamic Similarity.
By Messrs. Nolan Page, Andrei I. Ivanch,enko, and F. T. Mavis and A. Ifuksch 1098 Stabilizing Constructed Masonry Dams by Means of Cement Injections.
By Charles W. Comstock, M. Am. Soc. C. E 1107 Line Load Action on Thin Cylindrical Shells.
By I. K. Silverman, Jun. Am. Soc. C. E 1112 Photo-Elastic Determination of Shrinkage Stresses.
By Messrs. Thomas H. Evans, and I. K. Silverman 1115
For Index to all Papers, the discussion of which is current in PROCEEDINGS, see page 2
The Society is not responsible for any statement made or opinion expressed in its publications
AMERICAN SOCIETY OF CIVIL ENGINEERS
Founded November 5, 1852
PAPERS
ADAPTATION OF VENTURI FLUMES TO FLOW
MEASUREMENTS IN CONDUITS
BY HAROLD K.
PALMER', M.
Am.
Soc. C. E., AND FRED D.
BowLys',
Assoc. M.
Am.
Soc. C. E.
SYNOPSIS
A weir can be considered as a control section through which water flows at critical depth. The sharp angle at the face and the fact that the flow is convex where it passes the critical section introduce energy losses between the point of measurement and the control section, the amount of these losses depending upon the setting of the weir in the channel. The ordinary weir formula is an empirical equation that is accurate only as long as the funda-mental conditions upon which it was cieveioped can be duplicated. These conditions can rarely be complied with in a confined channel, such as a- sewer or an irrigation canal.
This paper presents the theoretical hydraulic principles involved, and the results of special tests made, in the adaptation and construction of various Venturi flumes for measuring flow in conduits of uniform cross-section, where weirs have proved unsatisfactory.
Since the uncertainties or variations in weir coefficients are due to indeter-minable energy losses, it is reasonable to suppose that if these losses can be eliminated or reduced to a negligible amount by the use of some other device, the uncertainties in the rating curve will be eliminated. Such conditions are found in the so-called Venturi flume which, in this paper, includes any stream-lined device placed in an open channel, or a closed channel partly full, having a sufficient constriction to cause water to flow at critical depth with parallel filaments.
Any shape of throat may be used, and the flow can be determined from a single depth measurement, using a rating curve drawn from rational formulas. Several of these Venturi flumes have been constructed, including one that
NOTE—Discussion on this paper will be closed in December, 1935, Proceedings. 1 Chf. Draftsman, Los Angeles County Sanitation Dists., Los Angeles, Calif. 2 Res. Engr., Los Angeles County Sanitation Dist. No. 2, Whittier, Calif.
962 VENTURI FLUMES AND FLOW MEASUREMENTS IN CONDUITS Papers was simply a flat slab on the bottom, and had no side contractions; one that was rectangular in cross-section; and several with trapezodial-shaped throats, all of which have given good results.
The writers show how the rating curve may be drawn, and give graphs for use with circular conduits.
INTRODUCTION
Weirs have long been considered the standard devices for measuring run-ning water, but their use involves empirical formulas, and they must be built under restricted conditions, unattainable in many classes of conduits. The ponding effect of the water up stream from the weir causes deposits of sus-pended matter which often alter the hydraulic conditions so that the empirical formula fails to give the correct flow. In the case of sewers, sludge deposited in this manner will decompose in time and become an added source of trouble. Another objection to the use of weirs in a closed conduit is the relatively large loss of head.
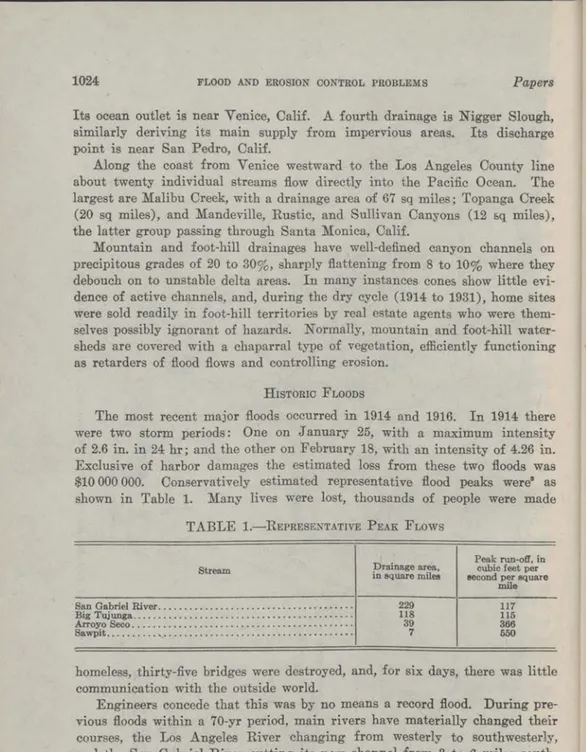
Many factors affect the proper installation of weirs as shown by Schoder and Turhers in an able discussion of precise weir measurements. The United States Bureau of Reclamation has found from experiments' that the ordinary sharp-crested Cipolletti or rectangular type of weir must have certain very definite requirements for a fair degree of accuracy; for instance, the distances from the bottom and sides of the channel to the edges of the weir must not be less than twice the depth of water over the weir, and the channel above the weir for a distance of 20 or 30 ft must have a cross-sectional area at least six times that of the over-flowing sheet of water at the weir crest. When the depth of the water passing over a weir exceeds three-tenths of its width, the engineers of the Reclamation Bureau have found that the standard formulas indicate quantities that are too small. The error ranges from zero at three-tenths to 30% when the depth equals its width. These restrictions
limit the capacity of the weir to about 40% of the capacity of a closed conduit.
Occasionally, the true Venturi flume has been used to advantage because it gives a minimum of ponding and the frictional losses, being small, result
in little loss of 'head. However, it has the disadvantage of requiring the
measurement of the area of cross-section as well as the velocity of the water flowing in the throat. This has only been possible in the past by making two simultaneous depth measurements.
Use of the Parshall meter,' which is one form of a Venturi flume, obviates some of the difficulties previously mentioned, but it is not readily installed in conduits already constructed because of the required 3-in, drop in the invert grade at the throat. It could scarcely be adapted to an existing, standard
sewer manhole, say, 4 ft in diameter. In the design of a new system of
con-"Precise Weir Measurements," by E. W. Schoder, M. Am. Soc. C. E., and the late Kenneth B. Turner, Esq., Transactions, Am. Soc. C. E., Vol. 93 (1929), P. 999.
4 "Measurement of Irrigation Water", U. S. Dept. of Interior, Bureau of Reclamation, Third Edition, 1925.
6 "The Improved Venturi Flume", by R. L. Parshall, Assoc. M. Am. Soc. C. E., Transactions, Am. Soc. C. E., Vol. 89 (1926), p. 841.
September, 1935 VENTURI FLUMES AND FLOW MEASUREMENTS IN CONDUITS 963
duits for which the desired points of flow determinations might be predeter-mined and a few inches of grade sacrificed, Parshall meters could be (and have been) installed to advantage. They have certain disadvantages in the continuous measurement of sewage, requiring daily inspection when a week or more of record is required, because the orifice between the channel and the wet-well often becomes clogged and the formation of sludge after a day or two in the wet-well tends to raise the float, thereby causing an error in the stage recorder reading.
Ordinary Venturi tubes may also be used for liquid flow measurement, but larger structures are required for their installation. Such a tube must be entirely submerged and in sewers this is likely to prevent the proper handling of light floating material. Its efficiency is often impaired by clogging of the pressure recording pipes and, including the recorders, the initial installation is more costly than the weir and stage recorder units.
In 1920, Hinds' suggested placing a sufficient constriction in a channel to cause the water to flow at critical depth, on the assumption that in this case the energy head is fixed, whereas the depth is uncertain. He presented experi-ments made by the U. S. Bureau of Reclamation,' on a flume similar in many respects to one type considered by the writers and showed an error of less
than 5% in measurement of flow, assuming no transition losses.
The following analysis of the adaptation of the Venturi flume to flow measurements in conduits of regular cross-section is applicable not only to clear water, but also to any liquid carrying suspended matter. Among the latter are included silt-laden irrigation water, storm water, and sewage. The investigations herein reported were made in connection with a sanitary sewerage system and as sewage presents most of the difficulties encountered in the other classes of water, the word, "sewage," will be used subsequently to denote water that carries settleable solids.
In passing, it may be stated that an accurate measurement of sewage flows in various parts of a sewerage system is quite important in order to be able to predict with reasonable accuracy the need of future works, relief sewers, additional pump capacity where pumping is required, etc. In joint sewerage works an accurate measurement of sewage is necessary to apportion costs to respective participants. Furthermore, as a check on pump-ing efficiency and power requirements, knowledge of the actual sewage flow is necessary. An accurate gauge of the flow is required for efficient and eco-nomical operation, where pre-chlorination' is practiced since the chlorine feed depends on both the strength and the quantity of the sewage. One difficulty encountered in an accurate measurement of sewage flow in new sewerage works is the fact that a sewer is usually constructed of a greater capacity than is required at the time it is first placed in operation. The flow in the line is then relatively shallow. Furthermore, in a new system of any large
6 "Venturi Flume Data Throws Light Upon Control Weir", by Julian Hinds, M. Am. Soc. C. E.. Engineering News-Record (1920), p. 1223.
"'The Improved Venturi Plume". by R. L. Parshall, Assoc. M. Am. Soc. C. E.. dis-cussion by Julian Hinds, M. Am. Soc. C. E., Transactions, Am. Soc. C. E., Vol. 89 (1926), p. 864.
"Control of Sewage Condition by Chlorination", by F. D. Bowlus. a7nd A. P. Banta, Assoc. Members, Am. Soc. C. E., Water Works and Sewerage, November, 1932, Vol. 79, p. 369.
964 VENTURI FLUMES AND FLOW MEASUREMENTS IN CONDUITS Papers extent, the increase in sewage from month to month or year to year is rela-tively large and many measuring devices which might be satisfactory at one time would prove totally inadequate at a later date. Sewage flows range from a minimum in the early morning to a maximum of as much as two or three times the minimum amount later in the day; it will also vary from day to day, and any meter used for the purpose must be adaptable to such variations.
' Difficulties encountered with ordinary weirs and other similar devices in
the measurement of sewage indicate that the most satisfactory meter would incorporate the use of a stream-lined flume, with minimum head loss,
pre-Ok
i\ venting deposits of sludge above it; without sharp edges to catch rags andother floating refuse; and with sufficient capacity to measure the entire designed flow and yet be sensitive enough to record low flows in the first years of its use. The flume must be adaptable to the use of a simple float mechanism for water-stage recording, and must be designed so as to be readily installed in an existing conduit with minimum interference to the sewage flow. This paper deals with a measuring flume designed so that the flow may pass without objectionable ponding up stream; which offers no obstruction to floating or ( suspended solids; and which affords an opportunity to measure the flow from a continuous record of the water-surface elevation at a single point in the ..___
channel up stream from the flume.
The formulas developed for the flume are not empirical but are based entirely on theory and can be applied to conduits of any regular size or shape. Irregular channels would require regulation for a short distance up stream by lining of some kind. Uniformity of shape rather than factors affecting friction are important. The method has been developed especially for sewers, but is equally applicable to other channels, irrigation canals, storm drains, etc.
NOTATION
The symbols introduced in this paper are defined as follows:
b = a bottom width.
c = a subscript denoting "a critical depth."
f = "function of."
g = acceleration due to gravity.
n = Kutter's coefficient of roughness.
v = a subscript denoting "velocity."
A = area.
B = surface width; width of water surface.
C = Chezy's coefficient.
D = diameter.
H = head; 11, = velocity head.
K = a constant in Kutter's formula = A C R.
Q = rate of flow, or discharge.
R = hydraulic radius.
S = hydraulic slope; slope of a conduit, expressed as a percentage.
T7 = average velocity in a section.
-_- "difference in;" A H, = difference in velocity heads in throat
and conduit.
e =. energy head; ee = energy head at critical depth.
September, 1985 'VENTURI FLUMES AND FLOW MEASUREMENTS IN CONDUITS 965 THEORY OF DESIGN
n
According to Bernoulli's theorem, the energy head of each pound of water i a conduit is the height of the water surface above a given datum plane, plus the velocity head. In passing from one section of a conduit to another, frictional and other losses are measured by the decrease in the total energy head regardless of changes in depths and velocities at the two places. There-fore, measurement of the total energy head is the logical basis for the develop-ment of any theory in the design of a Venturi flume of the general type illustrated in Fig. 1.
(a) SECTION AT CENTER OF THROAT
Pipe cte Loose Joint
Stage Recorder Manhole Float Support Critical Depth Energy Head Water Surface
(b) LONGITUDINAL SECTION OF METER IN 24-IN. PIPE
a
8-in. Copper Ball (c) PLAN OF FLOAT SUPPORTnu. 1.
viC,L7
'
4"
.;
K.
Under 9sLtaig_apaclitjayi a calculation of the flow may be made by simply
measuring the depth of the 'water flowing in a conduit of regular cross-section
at any convenient point immediately above the throat of the measuring flume. This is only possible when the throat is designed to cause the water to flow
k •
through it at critical depth. For any given quaritity of water, and size and shape of conduit, Fig. 2 shows that the energy head has a minimum value when the water is flowing at critical depth in the throat. For a given channel this critical depth is a function of the quantity of water, and attempts have been made by Woodburn' to use a broad-crested weir as a measuring device recording the critical depth. However, in this case, it was found impossible to locate the section of critical depth accurately as it changed position with different quantities of flow. Near the section of critical depth in the throat - of the Venturi flume, the depth is uncertain, but the energy head is fixed; therefore, if the throat is designed so as to cause the water to flow at critical depth the depth in the conduit of the regular cross-section above will be the average energy head less the velocity head at that point, except for frictional losses, which will be discussed subsequently.
"Tests of Broad-Crested Weirs", by James G. Woodburn, Assoc. M. Am. Soc. C. E., Transactions, Am. Soc. C. E., Vol. 96 (1932), p. 387.
966 VENTURI FLUMES AND FLOW MEASUREMENTS IN CONDUITS Papers
The proposed method of measurement is best illustrated by reference to Fig. 2. For simplicity, consider that a rectangular conduit is contracted on the sides only, forming a rectangular throat one-half the width of the conduit.
11.0 0.8 -V- • 0.6 • 0.4 0.2
io
- TN T. cr. Throat § ZZ-:Ar
cg,,,, ,
A
AL..
Thr Fiume 0.2 04 06 0.8 10 12 1.4Energy Head. e in feet
FIG. 2.—ENERGY HEAD CURVES IN A VENTURI FLUME.
16 1.8 1.6 1.4 'a. 0.8 0.6 0. 0.2 0o 2 4 6 8 10 12
Rate of Flow. Q, in cu ft per sec
FIG. 3.—DERIVATION OF RATING CURVE,
VEN-TURI FLUME. I 2.0 ft Elevation u 7_1 / 1 0 ft---)F1) 0.25 ft4/ <,5% re / suantihf eic.c " "6 in
For any given quantity of water, according to Bernoulli's theorem,
e = d ± —V2
2g
in which e = energy head; d = depth of flow; V = average velocity in a
section; and g = acceleration due to gravity.
Since V = —Q , A (1) \A / c = d .9-)2 (2) 2g
in which Q = rate of discharge; and A = area of cross-section. For a
rectangular cross-section: A = bd — Q bd and,
(3a)
.(3b) (4) \bd / 2gin which 1) = the bottom width of a channel; and e and d are the
vari-ables. In Fig. 2, Curves F and T represent Equation (4) for the conduit and
throat, respectively, Q being the same in both cases. Neglecting frictional losses there would be no loss of energy in or through the Venturi flume, and
if Q Cu ft per sec flowed at a depth, A, in the conduit, it would flow at a
depth, A', in the throat. Theoretically, Q could be determined by measuring these two depths, A and A'. The necessity in the past for the two
measure-September, 1935 VENTURI FLUMES AND FLOW MEASUREMENTS IN CONDUITS 967
ments has been an inconvenience in the use of the Venturi flume. If Q, in
cubic feet per second, flowed at the critical depth in the throat (Point C'),
its depth in the conduit would be represented by Point C which would be its
minimum depth above the throat, because for shallower depths the energy is insufficient to force Q through the throat.
By drawing similar pairs of curves for other values of Q, a rating curve showing the relationship between Q and d could be drawn, but in practice this requires an unnecessary amount of labor.
For a given size and shape of throat, the value of ec is a definite function
of Q, or to write the inverse case:
Q =
f
(ec)
(5)When e and Q are known, if,, in the conduit can be found by trial, and
sub-tracting this Hv from e gives d (Fig. 3).
For rectangular throats, Equation (5) takes a simple form which will be evaluated from the general formula, but for other throat shapes, this becomes a transcendental function too complicated to be considered, and it is easier to compute a few points on the curve and prepare the rating curve graphically. It has been found from practice in computing these points that the best
pro-cedure is to assume various critical depths in the throat and compute Q and e
by the following formulas:
At critical depth, —de = 0; differentiating Equation (2) :
dd
de , Q2 -1 dA
dd g A2 dd
(6) dA
Equating this formula to zero, and substituting B for its equivalent", ,
dd Equation (6) becomes: Q2 B 1 —-- x — — 0 g A' and, therefore, (7) Q = A NI—A g (8)
Equation (8) is the accepted formula for the quantity flowing at a critical
depth in a channel of any shape. Since Q = A V, by substituting the value
of Q in Equation (8) :
and Bernoulli's equation becomes,
A
2g 2B
2B
""Hydraulics of Open Channels", by B. A. Bakhmeteff, M. Am. Soc. C. E., p. 31, Equation (19).
968 VENTURI FLUMES AND FLOW MEASUREMENTS IN CONDUITS Papers
In a rectangular throat in which A = B dc, Equation (8) becomes,
Q B V-9 dc3 • (11) dc (12) 2g 2 and, e =-- dc (13) 2
Substituting the value of dc obtained from Equation (13) in
Equa-tion (11) :
Q = 3.09 Be ...(14)
which is the form taken by Equation (5) for a rectangular throat. For all other shapes it is necessary to use Equations (8) and (10).
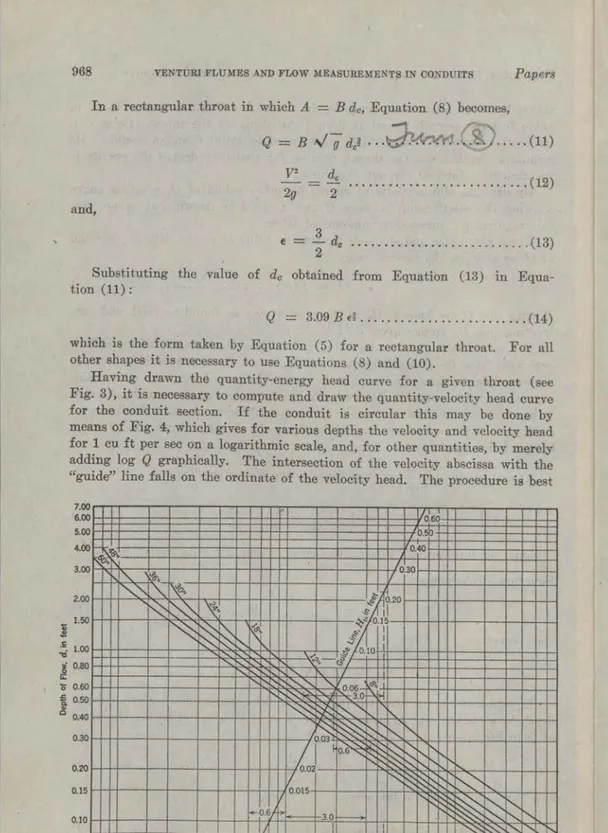
Having drawn the quantity-energy head curve for a given throat (see Fig. 3), it is necessary to compute and draw the quantity-velocity head curve for the conduit section. If the conduit is circular this may be done by means of Fig. 4, which gives for various depths the velocity and velocity head for 1 cu ft per sec on a logarithmic scale, and, for other quantities, by merely adding log Q graphically. The intersection of the velocity abscissa with the "guide" line falls on the ordinate of the velocity head. The procedure is best
Depth of Flow, d, in feet 7.00 6.00 5.00 4.00 3.00 2.00 1.50 1.00 0.80 0.60 0.50 0.40 0.30 0.20 0.15 0.10
h1k.
NI11
,
<d), 0.6 0.02 0.015 0.20 I 0.15 0.10e
ni!
/.50 30 0.07 01 0.15 02 03 04 0 5 0 6 0.8 10 1.5 20 30 40 5 6 Values of F, and Velocity, in ft per secFIG. 4.-VELOCITY IN PIPES WITH WATER FLOWING AT VARIOUS DEPTHS.
September, 1935 VENTURI FLUMES AND FLOW MEASUREMENTS IN CONDUITS 969
explained by two examples: First, when Q > 1; and, second, when Q < 1.
For example, let Q = 3 cu ft per sec with water flowing 0.55 ft deep in a
30-in. pipe. Set a pair of dividers to the distance from 1 to 3 and measure this distance to the right from the intersection of the 30-in, pipe with
d = 0.55 ft, giving v = 3.8 ft per sec. The vertical line for v = 3.8
inter-sects the "guide line" at 11, = 0.225. In the second case let Q = 0.6 cu ft
per sec, with water flowing 0.27 ft deep in a 36-in. pipe. Set the dividers for the distance 1.0 to the left to 0.6 and measure this distance to the left from the
intersection of the 36-in, pipe with the d = 0.27 horizontal line, finding
v = 1.86 ft per sec. The vertical line for v = 1.86 intersects the guide line
at 11, = 0.056 ft.
To find the velocity head for any value of Q, first assume an approximate value of the velocity head, subtract it from the quantity-energy head, and note the assumed depth. Enter Fig. 4 with these values of Q and d and read the velocity head. If this differs materially from the assumed value, a second approximation should be made. To draw the velocity-head curve it is obvi-ously better to begin with a small value of Q because the error in the assumed value of the velocity head is correspondingly small and one or two approxi-mations are usually sufficient. It will be found that only a few points are required to draw in the quantity-velocity head curve. Ordinates on the quantity-depth curve are merely the differences between the ordinates of the quantity-energy head curve and the quantity-velocity head curve. This quantity-depth curve is the required rating curve.
As an illustration of the method of computing a rating curve, consider a Venturi flume with trapezodial throat cross-section as in Fig. 1(a), 12 in. wide at the base with side slopes of 2 on 1 and a flat slab base 3 in. above the invert of a 24-in. pipe. All measurements are in feet and quantities in cubic feet per second. As previously recommbnded, various critical depths will be assumed and Q and E computed. In this case the formulas for the cross-sectional area and water-surface width in the throat are:
and,
A = (1 t) c dc (15)
B = 1 ± de (16)
The computations for energy heads are arranged in Table 1. In comput-ing the velocity heads (see Table 2), it must be remembered that the crest of the throat is 0.25 ft above the invert; hence, the depth in the conduit must be increased by that amount. The velocity head in the conduit can be obtained only by trials preferably starting with the small values of Q. In
Table 2 when Q = 2 cu ft per sec, the depth in the conduit will be somewhat
less than e +0.25 = ,908. For 2 cu ft per sec, at a depth of 0.9 ft in a 24-in.
pipe, Fig. 4 gives lIv > 0.03. Assuming Hi, = 0.03, the depth becomes 0.88
with a resultant value of Hi, = 0.035. This is not a sufficient change to effect
970 VENTURI FLUMES AND FLOW MEASUREMENTS IN CONDUITS Papers
throat is taken as the datum, this 0.035 is to be subtracted from the value of e.
The velocity heads for other values of Q are found in the same way, except that after two or more have been computed an assumed value for the next one may be obtained by extending the curve drawn through the known points.
TABLE 1.-QUANTITY-ENERGY HEAD CURVE
d o 0.2 0.4 0.6 0.8 1.0 1.2 0.5 do 0.1 0.2 0.3 0.4 0.5 1 + 0.5 doA 0.221.1 1.2 1.3 1.4 1.5 0.48 0.78 1.12 1.50 1.88* BA 1.2 1.4 1.6 1.8 1.93* 1.79* 0.183 0.343 0.487 0.622 0.777 1.050 Q 0.53 1.60 3.09 5.02 7.50 11.00 II, e 0.092 0.292 0.1720.572 0.244 0.844 0.311 1.111 0.389 1.389 0.5251.725 *By scale and planimeter (see Fig. 1).
Table 1 is extended to a value, Q = 11.0. The energy head was so
regu-lar that it was extended by eye to Q = 12, and Table 2 is computed to this
limit although it is subject to some suspicion for Q > 11.0. These curves are all shown in Fig. 3.
TABLE 2.-QUANTITY-VELOCITY HEAD CURVE.
Q = 2 4 6 8 10 12 e = 0.658 0.978 1.225 1.438 1.630 1.812 e-1-0.25 = 0.908 1.23 1.48 1.69 1.88 2.06 Assumed 1-1, = 0.03 0.07 0.09 0.14 0.19 0.25 e -1-0.25-,U, = 0.88 1.16 1.39 1.55 1.69 1.81 H, (final) = 0.035 0.064 0.100 0.145 0.198 0.256 d=e-H, = 0.623 0.914 1.125 1.293 1.432 1.556
An exponential formula may be written for some small sections of the final rating curve, but it is not advisable. The inaccuracies of such a
formula can be appreciated by equating the value of a in Equation (2) for
both the throat and conduit sections; thus,
which reduces to,
HF () 2 _1_ d (R:)2 2 g A (17) A, 2 g Q = \I 2 g (d - dc) A A, A - A,, Writing A = f(d) and A, = 4 (dc) : Q = Ni 2 g (d - dc) f (d) 4 (d,)
f
(d) - (dc)Since f(d) is not a simple function in a circular pipe, it is evident that the use of an exponential formula is generally inadvisable because of the many different combinations depending on the relative size of the pipe and throat, and the height of the crest of the throat above the invert.
(18)
September, 1985 VENTURI FLUMES AND FLOW MEASUREMENTS IN CONDUITS 971 ENERGY LOSSES
One of the chief disadvantages of water measurement with a weir is the relatively large and uncertain loss of energy. Schoder and Turner' show how the so-called constant of a weir is subject to wide changes depending on the size and setting. This change in the constant can be interpreted as a variation in the energy loss, and it follows that if such variations can be limited by the use of other devices, the change in so-called constants will likewise be restricted. In the case of the weir such control is difficult and at times impossible; with a Venturi flume it may be accomplished easily.
In the adaptation of the Venturi flume, to the writers' ideas, considerable attention was given to the design of the transitions to minimize loss of energy. In the hydraulic design of flume transitions Hinds" found, in making twenty-nine tests on ten flume inlets, that only three had losses
amounting to more than 0.1 A Hy. In a number of cases no measurable loss
occurred and the average was about 0.04 A Hy. The 4-ft diameter of a
stand-ard sewer manhole limits the length of the transition that can be built readily in an existing sewer. In the sewerage system of the Los Angeles County Sanitation Districts, a ratio of three longitudinally to one trans-versely has been adopted as a compromise. To determine the energy losses through Venturi flumes constructed by the Districts, a differential meter acting on the principle of a Pitot meter was devised. This is shown in Fig. 5.
Brass 1-Connection Rubber--Tube Upstream Funnel 2-Hole Rubber Stopper 1.5 a 1.0 0 —Rubber Tube 250 cu cm Bottles Glass Tubes Pilot Tubes Firmly Mounted at Same Elevation:,-, Downstream 2.5 2.0 0.5 I I I I' '<c' _ 3.72 ft 2 ft 1‘
-4
Q = 50 ft per sec - 8 ft ---,-1 Q cu 6b/ // / Q= 25.7 cu ft per sec / / / / / / / / / 05 1.0 15 20 Energy Head, e, in feet25 3.0 FIG. 5.—DIFFERENTIAL ENERGY FIG. 6.—ENERGY CURVES, CONTROL SECTION WEIR.
METER.
Two bent tubes are set at two points in the stream with orifices at the same elevation and pointing up stream, one in the throat and one above the inlet transition. These two tubes are connected by means of air tubes to a mano-meter filled with colored water; the displacement of the water column in the manometer after all water is blown out of the bent tubes measures the differ-ence in energy head at the two points. To allow for any compression of the
""The Hydraulic Design of Flume and Siphon Transitions", by Julian Hinds, M. Am. Soc. C. E., Transactions, Am. Soc. C. E., Vol. 92 (1928), p. 1423.
972 VENTURI FLUMES AND FLOW MEASUREMENTS IN CONDUITS Papers air which might occur in the tubes it was found advisable to blow air into each from time to time during the test. This was accomplished by pouring water into the two bottles, forcing air out through the orifice tubes. In sewage, one or the other of the orifice tubes may become clogged by floating matter, throwing the manometer out of balance. The manometer resumes its balance when the obstruction has been cleared away and a little more air forced into the tubes. Any type of meter in which water is drawn into the tubes will be clogged by sewage. This simple, head-differential apparatus has been found to be accurate and sensitive.
Several tests with the differential-energy meter (Fig. 5) integrated over the entire cross-section have shown that no energy losses greater than 0.005 ft occur in any of the meter throats thus far installed, and as many stage recorders are not sensitive to such small changes this energy loss is practically negligible. Should an appreciable loss be found in a given installation for high velocities it can be added to the quantity-energy head curve.
In sewage measurement, the mean daily flow is usually required. This may be calculated with sufficient accuracy by using a planimeter on a water-stage record to get the mean depth. If it is suspected that there are energy losses through the Venturi flume at higher flows the differential energy meter
can be used at various stages, including the maximum, to correct the curve;
and if the flow is increasing from year to year, the corrections may be deter-mined beforehand, as the maximum flow of to-day will be the mean flow some months or some years hence.
Another possible source of error seems to be that in an open conduit the surface velocity is about 25% greater than the mean, which should cause the velocity head at the surface (where the float is installed for
measure-ments), to vary as the ratio of 1.002 to 1.252, or 56% greater than the mean.
If this condition existed, 1.56 H„ should be subtracted from the quantity-energy head instead of 1.0 Hy, in order to obtain the proper depth in making a rating curve. This condition was tested at one meter formed by placing a ftat slab, 6 in. thick (at the invert), on the bottom of a 54-in, sewer pipe without side contractions. In the regular pipe channel, at the upper end of the transition section and at mid-stream, a Pitot tube was turned up stream and then at right angles to the current. The difference between these two measurements was the true velocity head, which, added to the measured depth, gave the total-energy head. Applying this energy head to the previously com-puted quantity-energy head curve gave the quantity. Readings taken at various depths between the center and sides of the stream showed substantially TABLE 3.—RELATION BETWEEN THE MEASURED AND THE THEORETICAL VELOCITY
HEADS AT MID-STREAM.
Quantity, Q, in cubic feet per second
Calculated velocity, V,
in feet per second Theoretical head, H.,in feet Measured head, in feet H., 8.2 10.25 17.5 2.18 2.50 3.15 0.074 0.097 0.153 0.076 0.096 0.142
September, 1935 VENTURI FLUMES AND FLOW MEASUREMENTS IN CONDUITS 973 the same velocity head at all points. Table 3 shows the relation between the measured and the theoretical velocity heads at mid-stream. These results indicate that within the accuracy of the measurements the velocity had in the conduit may be assumed to be the mean velocity head.
An investigation of the velocity-head correction for hydraulic flow by O'Brien and Johnson' indicates that, in this case, such a correction might
amount to from 4 to 10% of the velocity head. As this is less than the limit
of accuracy for a stage recorder with a float set in the main stream it may be neglected. For measurements in clear water, using a float-well for more accurate measurements, it should be determined experimentally.
When the velocity above the meter is less than 2 ft per sec the water surface is usually smooth, but above this velocity waves begin to form, probably caused by the difference in velocity heads in the region adjacent to the sides of the conduit. The waves are too small to affect the ball-float, but would affect very precise measurements made with a hook-gauge. Where they are usable float wet-wells would obviate this trouble, but in sewers the floats are affected by the accumulation of decomposing sludge.
One question that may be raised is the effect on the energy head of dif-ferent velocities at various points in the cross-section of the throat. It was found that the energy head was the same at all points in a transverse plane. As another check, small floats were dropped simultaneously into the upper end of the throat in pairs, one being near the side and the other nearer the center. Every time, both floats reached the lower end together. As another test a string was dropped into the throat transversely to the flow line and reached the lower end straight. The explanation of this phenomenon is that at, and near, the critical velocity in a short flume the side friction is not an appreciable factor.
Efforts were made to find a coefficient to be applied to Hv in the conduit. The flow was determined by measuring the energy head in the throat with a Pitot tube. Using this value of Q, the measured depth was subtracted from
the energy head to give C Hv. Within the accuracy of measurements, flows
of 10.3 cu ft per sec, at a velocity of 2.4 ft per sec, and 17.5 cu ft per sec,
at a velocity of 3 ft per sec, in the conduit both gave C = 1. These were
the largest flows and velocities available.
EXPERIMENTAL VERIFICATION
In the experiments made by the U. S. Bureau of Reclamation,' a wooden throat with a bottom width of 2 ft and side slopes of 1 on 1 was installed in an earthen canal with a bottom width of 8 ft and similar side slopes.
The bottom of the throat was 8 in. above the base of the canal and the
down-stream apron end of the throat sloped downward to a point 8 in. below the elevation of the canal base, similar to the Parshall meter. The gauge-point was placed in the upper transition where the bottom width was approximately
12 "Velocity Head Correction for Hydraulic Plow", by M. P. O'Brien, Assoc. M. Am. Soc. C. E., and J. W. Johnson, Jun. Am. Soc. C. E., Engineering News-Record, Vol. 113. 1934, p. 214.
974 VENTURI FLUMES AND FLOW MEASUREMENTS IN CONDUITS Papers 3.72 ft. It was placed only 0.4 ft down stream from the upper end of the wooden flume section where it was certain no silt deposit would occur. The writers have drawn energy curves for the flume (Fig. 6) at the control, or throat section, the gauge-point, and in the main canal for 50 and 25.7 cu ft per sec, respectively.
Had the gauge-point been moved back into the main canal, the measured
depth would have been greater by about 0.1 ft in the case when Q = 50 cu ft
per sec, but the main argument in favor of moving up stream is that the drop in the water surface indicates convexity, especially as it increases rapidly with the tapering of the channel, and it is in the convex water surfaces that the relation of the water surface to energy head is not correctly given by the Bernoulli theorem. Had the gauging-point been placed in the regular channel above as suggested, and the sides and bottom lined for a few feet to maintain a uniform cross-section, the stream filaments would have been parallel and the calculated flow would have followed more closely the volumetric measure-ments. Friction due to the longer distance between the point of measurement and the throat could have been measured by means of the differential energy-head meter (Fig. 5) and the energy energy-head increased by this amount.
With this change in the point of measurement the recorded tests would have shown closer agreement with the calculated rating curve. Since the quantity of water flowing through this Venturi flume tested by the Bureau of Reclamation was carefully measured volumetrically the data are considered most reliable. From the known dimensions a quantity-depth or rating curve was readily constructed by the writers using the method previously outlined. As stated by Hinds the difference between the quantities taken from this curve for given depths and the actual measurements in no case exceeded 5 per cent. Since the writers have pointed out that greater accuracy could have been attained by the selection of a better place for measuring the depths, and by measurement of frictional losses, this test is sufficient proof that all forms of the Venturi flume will give accurate measurements when it is possible to measure the depth in the conduit of a regular cross-section immediately above the throat and where the throat is properly designed to insure that the water reaches critical depth.
In the absence of an experimental laboratory the writers have had to make use of active sanitary sewers in the development and adaptation of the Venturi flume designs. Standard weirs were set in adjacent manholes, but comparative results were poor except where the flow was small in comparison with the capacity of the sewer, since the weir coefficients were uncertain. Therefore, these measurements were not considered sufficiently accurate to verify those obtained from the Venturi flumes.
The experiments made by the U. S. Bureau of Reclamation, previously referred to, were considered a positive check on the accuracy of the method outlined herein. Furthermore, a field test, comparing measurements of a temporarily installed Venturi flume with a permanent Parshall meter (made through the co-operation of the Cities of Los Angeles and Beverly Hills), supplied added proof of the accuracy of the adapted Venturi flume.
September, 1935 VENTURI FLUMES AND FLOW MEASUREMENTS IN CONDUITS 975
At the point selected for the test an elaborate underground structure was constructed on a 21-in, sewer line which included a standard 12-in. Parshall meter and an indicating and recording register, showing the depth of flow through the flume and the rate of flow, in cubic feet per second. Water con-tinuously running into the float-well prevented the accumulation of sludge which otherwise would affect the float results. The wooden throat of the temporary Venturi flume was installed in an ordinary standard manhole
about 1 000 ft above the permanent gauging station, where the grade of the
21-in, sewer was 0.70 per cent. The bottom of the throat with a width of 10 in. was placed 2 in. above the invert. Although the boards forming the side slopes were intended to be set at a slope of 2 on 1, the irregularities of the
pipe caused them actually to be placed on slopes of 2 on 1 to 12 on 1.
Tin transitions for stream-lining the upper end were attached to the boards, but could not be set in exact position due to the roughness of the chan-nel through the manholes. Some caulking had to be done with oakum. The entire apparatus was quickly installed in the sewer during the low early morning flow and readily withdrawn a few hours later when the flow was at its peak of about 6, cu ft per sec. The elevation of the bottom of the throat was referred to a straight-edge placed across the manhole rim in the street pavement and measurements to the water surface above the flume were made with a steel tape.
Readings were taken simultaneously at the Venturi flume and .the Par-shall meter, a correction in time being made between the two stations as determined by passing floats occasionally from one to the other. A correc-tion was also required for the small flow entering the sewer from ,a side branch at a point between the two testing stations. Occasional depth measurements over a V-notch gave this correction with sufficient accuracy.
Table 4 gives the results of tests when the flow was within the capacity of
the Venturi flume. In Table 4(a) the average discrepancy between the two methods of measurement was 4.2%, with a probable error of -± 0.4 per cent.
During the period of high flow (8: 28 to 8: 58) it was found that the
critical depth in the throat exceeded the depth of the Venturi flume. These results are shown in Table 4. In this second group the discrepancy was
+ 6% -± 0.7%, showing that even when poorly adapted it was still
compara-tively correct. The 4% error in the first group could be corrected by allowing
a head loss of 0.25 Hy, or by subtracting 0.75 17, irtstead of Hv from the energy head. Doubtless the discrepancy could be reduced materially by care-fully installing a permanent concrete Venturi flume instead of the temporary wooden one which was used. Any obstruction placed in this sewer laid on a slope greater than the critical causes the water to jump immediately to the conjugate depth on the energy-head curve (Fig. 1) and unless allowance is made for this effect, the capacity of the sewer would be curtailed seriously. Therefore, it was necessary to use a large throat with a consequent rather high velocity of approach. It has been found that the slower the velocity of approach the greater the accuracy. This is limited by the capacity of the conduit and the possibility of forming deposits in the approach channel which would affect the rating curve.
976 VENTURI FLUMES AND FLOW MEASUREMENTS IN CONDUITS Papers
TABLE 4.-Co3IPARATIVE MEASUREMENTS WITH A VENTURI FLUME AND
FARSHALL METER.
(Flow Q, in cubic feet per second.)
Time (1) VENTURI FLUME Parshafl, (4) Side inflow, Q", (5) Qp = Column (4) minus Column (5) (6) Q = Column (6) minus Column (3) (7) Ratio: Column (6) Depth, in feet (2) Q. (3) Column (3) (8) (a) FIRST GROUP
5:57 6:01 6:03 6:05 6:06 6:07 6:08 6:09 6:10 6:13 6:15 6:17 6:18 6:19 6:22 6:24 6:27 6:31 6:32 6:37 6:42 6:48 6:50 6:52 7:23 7:26 7.28 7:31 7:33 7:34 7:35 7:37 7:38 7:39 7:41 7:43 7:48 7:52 7:53 7.55 7:58 8.01 8:03 Mean. 0.545 0.545 0.495 0.485 0.465 0.443 0.443 0.443 0.433 0.437 0.433 0.453 0.516 0.558 0.730 0.745 0.790 0.813 0.830 0.850 0.870 0.910 0.953 0.985 0.975 1.015 1.015 1.45 1.45 1:22 1.18 1.11 1.04 1.04 1.04 0.98 1.00 0.98 1.06 1.31 1.50 2.43 2.53 2.78 2.91 3.00 3.13 3.28 3.56 3.86 4.12 4.02 4.37 4.37 1.57 1.57 1.50 1.43 1.30 1.20 1.10 1.07 1.07 1.07 1.05 1.04 1.09 1.39 1.48 1.62 2.47 3.05 3.42 80 3.89 4.47 0.14 0.14 0.14 0.14 0. i3 0.13 O:ii 0.12 0.12 0.12 0.12 0.13 0.13 0.14 0.16 o:F7 0.18 0.19 o:io 45:io 0.20 1.43 1.43 1.36 1.29 1.23 1.17 1.12 1.07 1.06 1.02 0.99 0.97 0.96 0.95 0.95 0.95 0.93 0.92 0.92 0.96 1.26 1.34 1.41 1.48 2.31 2.48 2.58 2.77 2.88 2.95 3.02 3.17 3.24 3.31 3.54 3.61 3.70 3.89 3.99 4.08 4.21 4.27 4.31 -0.02 -0.02 • • • . +0.01 --0.06 -0.02 -0.05 -0.08 -0.03 -0.07 -0.06 -0.10 -0.05 -0.09 -0.12 -0.05 -0.20 -0.14 -0.05 -0.11 -0.11 -0.25 -0.32 -0.23 +0.06 -0.16 -0.06 0.98 0.98 iloi 0.95 0.95 0.98 0.95 0.92 6:4i 0.94 6:4i 0.96 O:oi 6:6 0.98 0.93 0.95 (1.4 0.97 0.97 6:4 0.92 O:oi 1.02 0.96 0.99 0.958 (b) SECOND GROUP 8:28 8:32 8:33 8:38 8.40 8:43 8:44 8:48 8:50 8:53 8:56 8:58 1.057 1.067 1.077 1.083 1.120 1.120 1.135 1.140 4.75 4.87 4.97 5.00 5.35 5.35 5.50 5.55 5.33 5.50 5.65 5.79 5.83 81 0.20 0.21 O:i 5.13 5.26 5.29 5.44 5.51 5.58 5.59 5.62 5.61 5.60 5.65 5.71 +0.38 +0.39 +0.32 +0.51 +0.24 +0.26 +0.15 +0.16 1.08 1.08 1.06 i:io i:6 i:Oi 1.03 1.06 Mean. AM=
September, 1935 VENTURI FLUMES AND FLOW MEASUREMENTS IN CONDUITS 977 DESIGN OF VENTURI FLUME
The proper design of a Venturi flume requires that parallel flow occur in the channel' above the flume and in the throat. The necessary critical velocity is obtained only when a drop in the energy head occurs just below the throat. A small jump in the water surface at this point (see Fig. 1) is positive evidence that critical velocity is occurring. In addition, the throat section must have sufficient length or the water will not be flowing in parallel filaments at the point of critical depth. The first meter stations installed by the Sanitation Districts of Los Angeles (Calif.) County had short throats which gave good results only on the small flows. Lengthening
the throat to 3 ft insured parallel flow through more of the length, and tests
with a Pitot tube showed no apparent change in energy head except at the ends. Data are lacking to formulate a rule as to the proper length, but experi-ence indicates that the throat should be at least as long as the diameter of the pipe. A comparison of flow through two Venturi flumes in consecutive manholes, with 36-in. and 6-in, throat lengths, respectively, showed a ratio of 1.0 to 0.8, the longer throat indicating the larger flow.
The important features of the Venturi flume are its adaptation to stream-flow measurement in all shapes of conduits not stream-flowing under pressure and its ready installation in lines to which access is much restricted. The device can always be installed in an existing line and often without serious interrup-tion to the flow.
The size of the flume throat depends upon the size and grade of the con-duit and the range of flow it is desired to measure. The ideal flume throat would have such a size and shape that the ratio of the cross-section of the water in the throat to that in the conduit would be the same for all quantities; but such a throat would be impossible to design and build because the ratio of the critical depth to the depth in the conduit is not a constant.
For a flow that is only a small percentage of the designed capacity of a conduit, a throat, V-shaped, or narrow at the bottom, with sloping sides, is satisfactory. However, such side walls are difficult to hold in place. A rec-tangular narrow throat may contract the flow so much as to give inadequate capacities for larger flows.
For circular pipes it has generally been found advisable to install a bottom slab in addition to the two sides, a feature which helps to support the side walls. The slab acts as a broad-crested weir when flows are only a small percentage of the designed capacity. Since a thin bottom slab properly stream-lined by approach transitions causes no deposition of solids except possibly at the very lowest velocities, such a slab is recommended, especially on the lighter grades, to offset any possible chance of back-water from an unforeseen obstruction below that might otherwise prevent critical velocity from being attained. In general, the flatter the slope, the more necessary is this precaution and the greater the slab thickness needed.
A throat of rectangular cross-section with proper transitions may be
adapt-able in some cases, as in the instance of a semi-elliptical section, or a
978 VENTURI FLUMES AND FLOW MEASUREMENTS IN CONDUITS Papers
tangular-shaped conduit, where its use is recommended. Lack of accuracy in very low flows and inability always to pass the full design capacity, how-ever, are restricting limitations to its general use.
Where a large flow in either rectangular or circular-shaped conduits pre-vents the placing of forms for building the side walls, a simple device to create critical velocity consists of placing on the invert a pre-cast flat slab with transitions. Deposition can only occur above this type at extremely low velocities. In similar cases involving large flows critical velocity may be produced by simply inserting vertical side walls with the proper transitions. The important factor in the construction and installation of any form of enturi device is that a constriction of some sort be placed in the channel to produce critical velocity with the least loss of energy, and that the shape, size, and dimensions of the device are important only in so far as they meet the specific problem at hand in a practical manner.
The correct size and shape of throat for use in a given conduit is that one for which the energy head is greater than the normal energy head in the
free flowing conduit at all values of Q, and with a bottom slab thin enough to
prevent deposition of sludge at low flow. A practical method of making this selection is first to prepare quantity-energy head curves for several sizes of Venturi flume throats (Fig. 7) on tracing cloth. Table 5 can be used for
3.0 3.0 2.5 0.5 (i
• '
2
'?'
,„,
_
mispopp, I i . Energy Head .:. Og Iddill .,.z,_
;frAAnt=
wo-4 — Bottom of Throat \ 5 10 15 20 25 30 35Rate of Flow, Q, in cu ft per sec
40 45 50 2.5 — 2.0 1.5 0.5 00 5 10 15
Rate of Flow, Q, in cu ft per sec
(
Shaded Area Repre-sents the Energy — Lost in the Flume
,EBottom of Throat
1-FIG. 7.—Q LUNT ITY-E NERGY HEAD CURVE FOR VARIOUS FIG. 8.—ENERGY HEAD CURVE, VARIOUS THROAT SIZES.
constructing these curves for trapezoidal throats having side slopes of 2 on 1. Next, on the same scale, a quantity-energy head curve is drawn for the con-duit under consideration, assuming unobstructed flow. Any formula for flow in open channels may be used for first constructing a quantity-depth curve, but the following procedure is suggested. Bakhmeteff" expresses the Chezy formula, as follows,
THROAT SIZES WITH SIDE SLOPES OF 2 ON 1.
20
in which,
Q=K (20)
K=AC (21)
September, 1935 'VENTURI FLUMES AND FLOW MEASUREMENTS IN CONDUITS
Computing K as a function of the depth in a
of K are shown for several pipe sizes in Fig. 9
n = 0.013 and S = 0.01 in Kutter's formula.
TABLE 5.-ENERGY-HEAD TABLES FOR THROATS
979 pipe is rather tedious. Values which has been computed for Drawn to a logarithmic scale,
WITH SLIDE SLOPES OF 2 ON 1 Rate of
flow, Q, in cubic feet per
ENERGY HEAD, IN FEET, FOR BOTTOM WIDTHS, IN INCHES
Rate of flow, Q, in cubic feet per
ENERGY HEAD, IN FEET, FOR BOTTOM WIDTHS, IN INCHES second 6 8 10 12 18 second 6 8 10 12 18 0.2 0.232 0.198 0.176 0.156 0.121 10.00 1.941 1.820 1.719 1.623 1.388 0.5 0.401 0.348 0.311 0.280 0.219 12.00 2.117 1.993 1.887 1.786 1.540 1.0 0.594 0.526 0.474 0.431 0.342 ' 14.0 2.276 2.149 2.041 1.936 1.679 2.0 0.865 0.779 0.713 0.654 0.529 16.0 2.422 2.294 2.183 2.075 1.809 3.0 1.070 0.975 0.897 0.829 0.680 18.0 2.558 2.428 2.315 2.205 1.930 4.0 1.239 1.136 1.054 0.978 0.810 20.0 2.439 2.327 2.045 5.0 1.384 1.279 1.191 1.109 0.926 25.0 2.604 2.308 6.0 1.515 1.406 1.314 1.228 1.032 30.0 2.852 2.544 7.0 1.634 1.522 1.426 1.337 1.130 35.0 3.078 2.759 8.0 1.743 1.628 1.530 1.438 1.221 40.0 2.958 9.0 1.845 1.727 1.627 1.532 1.306 ....
it is merely necessary to add one-half the logarithm of the slope (expressed as a percentage) to obtain the quantity for any depth in, the pipe. Velocity
heads are obtained from Fig. 4 in the manner previously described. Adding
these velocity heads to the depths shown on the quantity-depth curve gives the quantity-energy head curve. Fig. 8 shows a typical diagram.
Referring to Fig. 9, the capacity, Q, of a pipe is given by Equation (20)
C
---when S = the slope, expressed as a percentage; K = A X - ,s/ R for any
10
given depth; and C = Chezy's coefficient. The curves are drawn for a 1% slope.
For values of S less than 1% the flow for any depth will be to the left of
the curve and for more than 1% to the right. To find the value of S
measure from the slope guide to the right 10-line for S <1% and to the left
for S >1 per cent. For example: Let S = 0.25%; D = 8-in, pipe; and,
Q = 0.1 cu ft per sec. In this case S <1 per cent. Set the dividers for the
distance between the inclined slope line in percentage line and the right
1.0-line of the diagram at S = 0.25. Transfer this distance to the Q =
0.1-line, measuring to the right and intersect the 8-in, curve at d = 0.20 ft.
If Q is given in million gallons daily, set the dividers for the distance between the inclined line and the million-gallon-daily guide line on the extreme right.
For S = 0.25% and Q = 0.1 mgd, d = 0.25 ft in an 8-in. pipe.
On the other hand, let S = 2.25; D = 60-in, pipe; and Q = 15 cu ft
per sec. In this case S > 1 per cent. Set the dividers for the distance
from the inclined slope line to the 0.1-line to the left at S = 2.25. Transfer
this distance to the Q = 15-line, measuring to the left and intersect the
D = 60-in, line at d = 0.66 ft.
By superimposing the quantity-energy head curves for the throat upon
that for the pipe and then moving the throat tracing up or down, it is possible
to decide quickly which throat size should be used and how high it should be set above the invert. The difference in the two energy heads shows the
8.0 7.0 6.0 5.0 4.0 3.0 2.5 2.0 1.8 1.6 +1), 1.4 1.2 "ti 1.0 ,2 0.8 0.6 0.5 0.4 0.3 0.2 0 . 1 0 Va ues of \/i -FIG. 9.-DISCHARGE OF PIPES WITH WATER FLOWING AT VARIOUS DEPTHS . WHEN KUTTHR'S n = 0.013.
Iflhl
11
,
1,.65
.'0
..00.5 0 I1
•
ir
0.5r EM• 11111.11MMIUMEMEMENIE EMI IMMINE 0' ab 1111111.11 1111111111111/ 0.40 '7
0.45 111 II 1111111111111111111111 =MIMI cy. , a Mar' NNW I II ,. 3 r •IN
0 .35 s'ss -5C' s . -A A 0.30 II•
M E " II 0 25 \.,1 2,!`os
,
'2-r,kir
IIII
1111111M11111111111111•111111111=1111•111 -6 4A-,
--,,.:4'mummimaiumiumor
A4Cgillommommumm
"
64'
r • ,ono
, A =II
II
0.12 ci,..Ze. 1.0.10 4. ,-, ----v, 0.2541'..Viill
MIME Ela irp1Mr: le I B= V • c; 1 111I
S' VS 0.08 , ASP ir7 ..Se! pAt-l.PiIlM.I.'00J" ...IiilFl-I : N5 mnm.[.. I/W
B => I 600A0.06 0 F 01111
VS= 2.25 = 1.5 A=0.25 11 11 4%00°000I1111°I0-00P11N°00,A 4° 04•
II'p40•iill
I 0 _ 41.00001.0.00 00, 0°0 ° ;"0•40 -, ,. 4P 00-W°1.°1 0 0 II/ 3 3 I i 11 20 ..,....-':II
II/
pro
,
•01
11
0.01
o
30 40 60 80 01 0.15 0.20 0.30 0.4 0.6 0.8 10 b—Measure to this Line foVillion Gallons DailySeptember, 1935 VENTURI FLUMES AND FLOW MEASUREMENTS IN CONDUITS 981
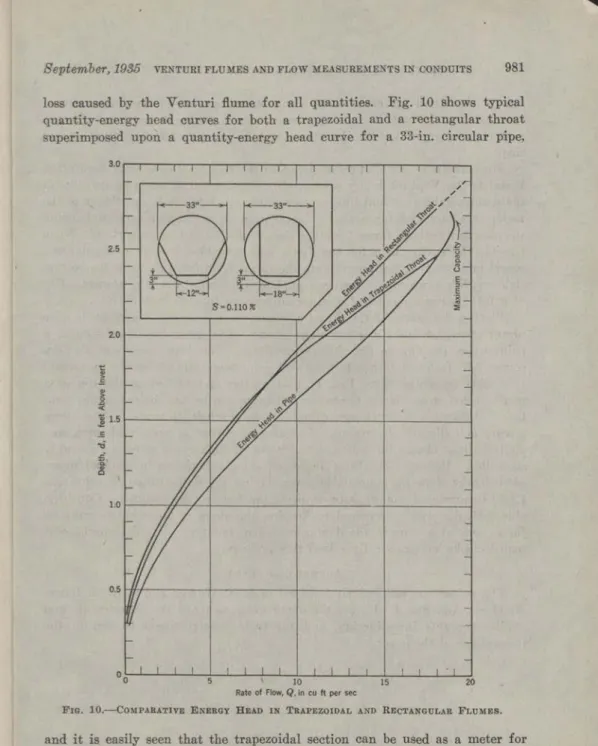
loss caused by the Venturi flume for all quantities. Fig. 10 shows typical quantity-energy head curves for both a trapezoidal and a rectangular throat superimposed upon a quantity-energy head curve for a 33-in, circular pipe,
3.0 2.5 2.0 1.0 0.5 _ _ _ _ — — — 1 1 1 1 II I 1 1 1 I 1 6• 1 I .3, 1 /— / / — ,, , 0 S=0.110% / ik° Cc\ ,,,,,,,b6 6 •Sx`' i — E = — .E 7<- _ _ .._ 12" 18" — — — — _ _ _ _ — — — _ _ _ _ _ _ 7 .11 — — — 1 1 1 1 1 _ _ _ — 5 10
Rate of Flow, Q, in cu ft per sec
15 20
FIG. 10.—00MPARATIVE ENERGY HEAD IN TRAPEZOIDAL AND RECTANGULAR FLUMES.
and it is easily seen that the trapezoidal section can be used as a meter for flows as great as 18 cu ft per sec and that at 19 cu ft per sec, which is the maximum capacity of the pipe (there being no loss in energy through the flume), the carrying capacity of the pipe is not curtailed. The quantity-energy head curve of the rectangular flume (Fig. 10) being always above the energy head for the pipe, shows loss of energy through the flume at maxi-mum designed capacity. This type of Venturi flume would interfere with the use of the sewer at full capacity. It is more accurate to compute the
rat-982 VENTURI FLUMES AND FLOW MEASUREMENTS IN CONDUITS Papers ing or quantity-depth curve from actual measurements of the flume as con-structed than to base it upon the design curves. Figs 4 and 9 are for use with circular pipes, but similar curves may be computed for conduits of any shape.
For permanent installation in sewers of the Los Angeles County Sanitation Districts the Venturi flumes were readily constructed of concrete directly in
the sewer manhole without interruption to sewage flow. A layout sketch of the
meter was prepared for a single installation in a circular pipe and, using
the plan as a pattern, forms for other sizes were obtained by proportion. When
possible the entire form for the flume was assembled in the sewer manhole invert and concrete was poured into the forms from one side until the bottom slab was filled in order to assure complete displacement of the sewage. Use of a fast-setting cement had distinct advantages in such installations.
Placing the center of the throat at about the lower side of a manhole gave proper space for installing the stage-recorder float near the upper side at a point where the _flow in the pipe was uniform. The float consists of an 8-in. copper ball fastened to a 2-ft length of 1-in. pipe, hinged loosely up stream to a pipe framework (see Fig. 1). The latter is attached to the top of a plank placed cross-wise to the sewer and supported by the shelves of the man-hole. Without some such apparatus to hold the ball, it tends to float down stream and disturb the record. The stage recorder is suspended on a spe-cially built steel seat immediately under the manhole cover where it is readily accessible. Repeated checks of indicated stage records against actual meas-ured depths show no appreciable error during the daily range of velocities. Braided, insulated, copper wire connects the float to the recorder. Consider-able difficulty was experienced in keeping the stage recorder clocks running for a week at a time in the damp, gas-laden, sewer air, but the purchase of sealed clocks has practically solved this problem.
ACKNOWLEDGMENTS
The writers are particularly indebted to A. K. Warren and to A. M. Rawn,
Members, Am. Soc. C. E., for the opportunity to make the experiments and studies for this investigation, and for their constructive criticism in the preparation of the paper.
AMERICAN SOCIETY OF CIVIL ENGINEERS
Founded November 5, 1852
PAPERS
THE
STRESS FUNCTION AND
PHOTO-ELASTICITY APPLIED TO
DAMS
BY JOHN H. A. BRAHTZ,1 ESQ.
SYNOPSIS
The object of Part I of this paper is to familiarize engineers with the use of the Airy stress function for the solution of problems in plane stress and plane strain when ordinary engineering methods fail to give even approxi-mate results.
The object of Part II is to familiarize the engineer with the photo-elastic phenomenon and its application to civil engineering structures and to com-pare results obtained in this way with the theoretical results obtained in Part I.
A brief popular outline of the theory is given accompanied by a descrip-tion of the apparatus developed at the California Institute of Technology, at Pasadena, Calif. Methods of evaluating stresses are explained and applied to experiments on Morris Dam.
INTRODUCTION
Ordinarily, the theory of the Airy function found in textbooks' is based on the assumption that body forces (weight and inertia) can be neglected. This is entirely inadequate in civil engineering structures in which the stresses due to weight often are greater than those caused by boundary forces.
Furthermore, in texts in which the body forces are included the definitions of
stresses are generally such that the form of the function is not invariant to a change in co-ordinates. The stress definitions given herein, including both boundary and body forces, are such that the stress function will be of the same form in rectangular and polar co-ordinates.'
NOTE.-Discussion on this paper will be closed in December, 1935, Proceedings.
With the U. S. Bureau of Reclamation, Denver, Colo. 2 See, for example, "Applied Elasticity", by J. Prescott.
3 "Notes on the Airy Stress Function", by John H. A. Brahtz, Bulletin, Am. Math. Soc., June, 1934.
984 STRESS FUNCTION AND PHOTO-ELASTICITY APPLIED TO DAMS Papers The stress function is restricted to isotropic materials which follow Hooke's law in both compression and tension. It may also be applied, however, to con-crete masonry structures if the resulting stresses are those of compression, or very slight tension, even if the elastic constants are not strictly constant for all stresses. It is generally conceded that a slight variation in the elastic modulus has little effect on the final stress distribution, except, of course, at singular points or at points of high stress concentration. With these assumptions the stress function may then be applied to a slice of a gravity dam. The question of uplift is not considered in this treatment, but it is assumed: (1) That there is sufficient resultant average compression at all points of the dam to overcome any internal pore pressures that may exist; and (2) that the pores are so small that the average stress distribution at a point may still be found as in isotropic material.
This paper, together with theoretical and experimental work done by others, shows that for purposes of analysis the triangular gravity dam on an elastic foundation may be divided conveniently into three regions: (1) The upper two-thirds of the dam proper; (2) the lower one-third, including the base region of the foundation; and (3) the foundation proper. Finally, special investigation must be made in the regions close to the heel and toe as to whether they are sharp corners or fillets, and near the crown. Conse-quently, in the present application, stress functions have been derived for four cases and a twofold purpose is served: (a) To show the methods of deriving stress functions; and (b) to obtain specific results applicable to the gravity dam on an elastic foundation. In most cases the derivations have been omitted, due to the limitation of space. The original manuscript is on file in Engineering Societies' Library, in New York, N. Y., and at the Cali-fornia Institute of Technology, at Pasadena, Calif.
Application I.—The stress functions, stresses, and deflections valid in
the upper part of triangular dams are derived for hydrostatic, and are given
for body, forces with computed results plotted in the case of Morris Dam.
In addition, the stress functions are given for a number of special loadings.
Application II.—The stress functions applicable in the foundation are
given with stresses and deflections for concentrated and distributed loads, the
computed results being plotted for a study of Grand Coulee Dam.
Application III.—The "corner-function" applicable at sharp re-entrant corners is derived. Two methods of procedure are given for the determina-tion of stresses in the lower part of gravity dams. The results are plotted for a study of Grand Coulee Dam.
Application IV.—An approximate method is derived for the, determination of stresses at re-entrant sharp and rounded corners. Examples are computed for Morris Dam.
It should be emphasized that even if the gravity dam is used for illustra-tive examples of application, the aim is not to advance new design criteria. The writer hopes, however, that the methods described will help to obtain a closer estimate of the stresses that actually occur. It is worthy of note that a state of stress computed by the Airy stress function is in equilibrium and compatible with Hooke's generalized law.
September, 1935 STRESS FUNCTION AND PHOTO-ELASTICITY APPLIED TO DAMS 985 ACKNOWLEDGMENT
Acknowledgment is freely given to Theodor von Karman, Elwood Mead,
S. B. Morris, J. L. Savage, and R. F. Walter, Members, Am. Soc. C. E., and
to Professor H. Bateman, of the California Institute of Technology, Pasadena,
Calif., for their valuable suggestions and co-operation in the preparation of this paper. The photo-elastic experiments on Morris Dam were made possible through the financial support of the Pasadena Water Department.
PART I.—THE THEORY OF THE AIRY STRESS FUNCTION
In this section the stress function is defined in rectangular and polar co-ordinates. Convenient forms of boundary conditions are treated.
A two-dimensional elastic system under plane stress or plane strain is in equilibrium if the stress components are defined as follows:
By rectangular co-ordinates: z — -21 and, 62F oy2 62F ox2 — gx x y — gx x — g1, y (la) (lb) o2F (1c) V — ox by
in which gx and cry -= components of normal stress parallel to the X-axis and
the Y-axis, respectively; Tx, y --- shear stress in the direction of the X-axis
or the Y-axis; F = a stress function; and g = the total body force per unit
volume.
In the polar co-ordinates:
62F ▪ OF — gr cos (0 — 13) (2a) r2002 rOr and, Or, — 02F co — — gr cos (0 —
p)
(2b) 67-2 oF (2c) Or r 60If, now, F is so restricted that it is a solution to the differential equation:
F -0-11 + 2 04F ZOF — 0
bx4 ox2 0y2 0y4 ... (3a)
v4 F
?,2 62 )2
F — 0 (30
0?-2 r ▪ r2 002
the stress defined in Equations (1) and (2) will also be compatible with the generalized Hooke's law. Problems in plane stress or plane strain have thus