On the Importance of Spatial Correlation in Stochastic Precipitation
Used in Water Supply Modeling
Matthew C. Carney1
Natural Resources Consulting Engineers, Inc., Fort Collins, Colorado Marijan Babić
Civil Engineering Institute of Croatia, Zagreb, Croatia Woldezion Mesghinna
Natural Resources Consulting Engineers, Inc., Fort Collins, Colorado
Abstract. This paper discusses the importance of accounting for spatial correlation in
stochastically generated precipitation records used in water supply modeling studies. By means of a case study, it is shown that the failure to reproduce the spatial correlations among stochastic precipitation records in a large watershed leads to an under-estimation of the variance of basin-wide precipitation volumes and consequently an over-estimation of water supply reliability. This in turn can lead to under-estimation of the active storage requirements for proposed reservoirs and, ultimately, water supply infrastructure that fails to deliver the design water demands at the
expected reliability level.
A proposed improvement to one commonly used stochastic weather generator is presented and tested on a case study in Eritrea, East Africa. The results obtained using the modified stochastic model are presented and discussed.
1. Introduction
In data sparse regions, water supply and reservoir sizing analyses are often performed using stochastic hydrology. In particular, if streamflow records in a region are few and of short duration, then they are not adequate for use in reservoir sizing. Short flow records do not capture the cycles of droughts and wet periods, nor do they provide an adequate
number samples to characterize statistical properties. If in such cases there exist one or more precipitation records that are of long duration, then one possible approach is to develop a stochastic model of precipitation. The stochastic precipitation data may be entered into a precipitation-runoff (P-R) model to simulate the water supply available to a potential reservoir site. The P-R model may be calibrated by simulating flows using short-term observed climatic inputs and comparing the results with the available (short-short-term) streamflow records. Then the long-term sequences of flows necessary for reservoir sizing may be simulated by applying the stochastically generated precipitation inputs to the calibrated P-R model. By means of a case study, this paper explores a particular area of concern in the application of this approach: The need to account for spatial correlation in the stochastic precipitation time series when simulating the flows of sizeable watersheds.
1 Natural Resources Consulting Engineers, Inc.
2. Case Study Background
Several years ago, Natural Resources Consulting Engineers, Inc. (NRCE) was contracted by the government of the State of Eritrea (GoE) in East Africa to identify and prepare designs and cost estimates for a new water supply system for that country’s second largest city, Keren, which had a 2001 population of approximately 104,000 (NRCE, 2001). This city, located in the semi-arid Anseba River basin, approximately 70 kilometers (km) northwest of the capital city, Asmara, has suffered from inadequate water supplies. This area, located at about 15º North and about 90km inland from the Red Sea in the central highlands region of Eritrea, is characterized by the semi-arid tropical climate. Mean annual rainfall ranges from 0.4 to 0.7 meters (m) per year across the basin, with an average of about 0.5 m. The study area location is shown in Figure 1.
Figure 1. Map Showing the Relative Locations of Keren, Asmara, and the Upper Anseba River
Basin in Eritrea, East Africa
Keren is presently supplied solely by alluvial groundwater wells whose productivity has declined in recent years due to persistent drought conditions and declining alluvial water tables. Hydrogeological investigations have concluded that the regional groundwater resources would not be sufficient to fully supply the city’s long-term water demands, which were projected to grow from approximately 2.76 million cubic meters (mcm) in 2006 to as much as 14.7 mcm in 2050 with its expanding population and economy (NRCE, 2002). The available discharge records (1997-2000) for the Anseba River near Halib-Mentel, located about 13 km upstream of Keren, indicated an average flow of
approximately 65 mcm per year; previous studies have estimated much larger flows, suggesting that the several years of gage records may reflect drought conditions (e.g., National Water Resources Commission, 1987; Selassie, 1997). Such flows are more than sufficient for supplying Keren’s needs. However, as is often the case in semi-arid regions, the Anseba River is intermittent. It flows mostly during the summer months of July and August when the intertropical convergence zone (ITCZ) brings rains to the upper Anseba River basin and surrounding areas (Seleshi & Demaree, 1995). Thus, for Keren to obtain a reliable year-round water supply from the Anseba River, a storage reservoir is necessary. Previous studies, field visits, and examination of topographic maps were used to identify a number of potential storage sites in the basin, some on-stream and others off-stream (i.e., on smaller tributaries to the Anseba River). An analysis of Anseba River sediment discharge data led to the conclusion that the on-stream sites would be infeasible due high
sediment loads and the resulting huge inactive storage requirements. Therefore, several potential off-stream storage sites were selected as being the best candidates to serve as Keren’s new water supply source (NRCE, 2001).
3. Approach
To determine which of the potential off-stream storage sites would be most feasible, and to determine the active and inactive storage capacities that would be required to deliver Keren’s growing water demands reliably throughout the design period, a hydrologic modeling study was conducted.
The study area is comprised of the 1,570 km2 portion of the upper Anseba River drainage basin that is above Tsebab Gorge, as shown in Figure 1. Below this location, the Anseba flows north to Sudan and ultimately discharges to the Red Sea. Of the 1,570 km2 drainage area, approximately 70 km2 in the headwaters area is closed by the recently completed Toker Dam, which provides water to Asmara, along with several small reservoirs in the basin upstream of Toker Dam (NRCE, 1995).
Based on its use of the well known Soil Conservation Service (SCS) runoff-curve number method and its prior use in other river basin studies in Eritrea (Euroconsult, 1998; NRCE, 1995), the U.S. Department of Agriculture (USDA) Agricultural Research Service’s (ARS) Soil & Water Assessment Tool (SWAT) was selected for use in this study (USDA, 2001). Using Geographic Information Systems (GIS) data coverages of elevation contours, land use / land cover, and hydrography, the 1,570 km2 upper Anseba River basin was delineated and segmented into 23 sub-basins of varying size. Sub-basins were delineated based on features of interest, such as the gage location, stream confluences, and potential storage sites.
The principal climatic and hydrologic data available in the basin include: • A 90-year daily precipitation record at Asmara, in the basin headwaters,
• Daily precipitation records of one to eleven year durations at 18 weather stations, many located in upstream portions of the basin that are closed by Toker Dam,
• Monthly precipitation records of 10 to 40 years duration at several locations, including Keren,
• Daily temperature, wind speed, humidity, and solar radiation records for two years at Asmara,
• Average monthly distributions of maximum and minimum temperatures, wind speed, humidity, and cloudiness at Asmara and Keren,
• Discharge and sediment sampling records for the Anseba River at the gage draining an 1,118 km2 portion of the basin for 1997-2000.
On the basis of these records, the following conclusions were drawn:
1. The Anseba River discharge record is too short for the reservoir sizing analyses, and is available at only one location, but it may be used in hydrologic model calibration.
2. The gage record cannot be extended by regression analysis versus other gages, since all gage records in Eritrea are of short durations.
3. The short daily precipitation records at 18 locations throughout the basin could be used as inputs to the hydrologic model during the calibration period, but are not sufficient to simulate the long-term hydrologic sequences needed for the reservoir sizing analyses.
4. The 90-year daily Asmara precipitation record is long enough for the reservoir sizing analyses, but one weather station is not sufficient for modeling the entire 1,570 km2 drainage basin.
5. The Asmara precipitation record is long enough to enable an accurate statistical characterization of precipitation at daily, monthly, and annual time scales.
From these conclusions, it was determined that the most technically feasible option would be to use the Asmara climatic records, supplemented by the climatic data at other locations in the basin, to develop stochastic climatic inputs to the hydrologic model to simulate the long-term streamflow sequences needed for the reservoir sizing analyses.
The SWAT model is driven by daily climatic time series, one set for each sub-basin. The climatic inputs may consist of observed or stochastically generated records. In the
calibration model, geographic proximity and similarity of elevation were used to determine which climate station record to apply to each sub-basin. In the long-term modeling,
SWAT calculates a unique set of stochastic climatic inputs for each sub-basin.
4. Problems with the SWAT Weather Generator
For there to be any possibility of obtaining realistic simulated streamflows from the modeling, the stochastically generated precipitation data must be statistically consistent with the long-term historical data in the basin.
As mentioned above, the hydrologic model SWAT has a built-in stochastic weather generator: WXGEN (Sharpley and Williams, 1990). This weather generator was developed for use in the contiguous United States of America. Upon analysis of the climatic data in the Anseba River basin and a review of the performance of the WXGEN generator, it was determined that modifications to this generator are required to correctly represent the long-term climate in the basin. The main problems with the WXGEN generator, as applied to the Anseba River basin for this study, were found to be: • WXGEN generator did not accurately reproduce the probability distribution of the
annual precipitation at Asmara.
• WXGEN generator did not accurately reproduce the temporal auto-correlation of the annual precipitation at Asmara.
• WXGEN generator cannot generate multiple correlated precipitation inputs (i.e., implies zero spatial correlation of precipitation).
The Anseba River water supplies simulated using the WXGEN stochastic climatic inputs were found to be very reliable on an annual basis, which resulted in the estimation of small active storage capacities for the potential reservoir sites, since carry-over storage was
minimal and droughts were few and of short duration. Even the few years of flow records at the gage, which varied from 39 to 84 mcm per year, were sufficient to indicate that the actual variability of annual flows may be greater than the model had indicated.
To test the sensitivity of the simulated flows to the spatial correlation of stochastic precipitation, a SWAT model simulation was performed in which the same stochastic precipitation record was applied to all 23 sub-basins, implying a cross-correlation of 1.0 throughout the basin. The cumulative density functions (CDFs) of the resulting annual flows are shown in Figure 2.
Figure 2. CDFs of Annual Flows of the Anseba River Simulated Using Stochastic
Precipitation Inputs Containing Spatial Cross-Correlation Coefficients of Zero and Unity
As may be seen from Figure 2, there is a wide disparity in the simulated annual flows near the tails of the CDFs. The 95% reliable simulated annual flow of the Anseba River, the accurate determination of which has huge implications for Keren’s water supply
development, was 0.3 mcm for a =1, and 36.1 mcm for a = 0.
5. Proposed Improvements
To resolve the problems discussed above, an attempt was made to develop an improved version of the WXGEN generator. The modified generator uses a multivariate
contemporaneous auto-regressive moving average model of order one [CARMA(1,1)] to generate temporally and spatially correlated random annual precipitation data at the desired locations in the basin (Salas, 1993).
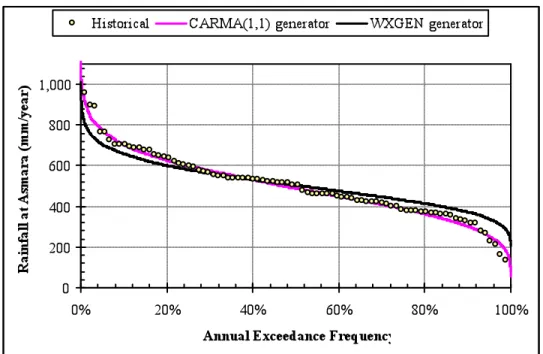
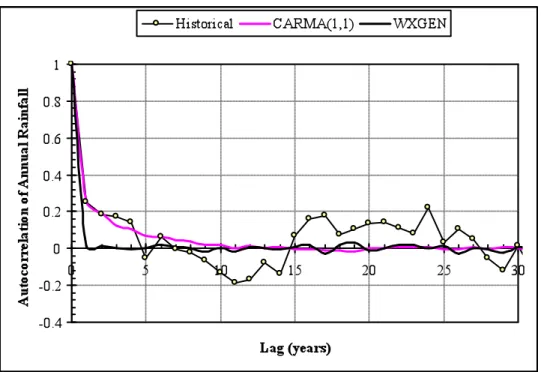
Figure 3 presents a comparison of the cumulative distribution functions (CDFs) of the annual rainfall time series generated using the WXGEN weather generator and the
comparison of the autocorrelation functions for annual rainfall obtained using the WXGEN weather generator and the CARMA(1,1) generator vs. the sample autocorrelation function for the historical record at Asmara. Because the CARMA(1,1) model is derived for use on normally distributed time series, the historical annual rainfall data were transformed to the standard normal distribution using the Box-Cox transform prior to estimating the
CARMA(1,1) model parameters (Salas, 1993). The generated standard normal time series were then inverse-transformed to obtain the stochastic annual rainfall records.
The limited number and duration of rainfall records in the Anseba River basin are
inadequate to accurately estimate the cross-correlation matrix for the CARMA(1,1) model. Therefore, the eleven CARMA(1,1) generated stochastic annual rainfall records are
modeled using an exponential cross-correlation function. In their study of surface water resources, Euroconsult (1998) performed a nationwide analysis of annual rainfall records in Eritrea. It was found that cross-correlation coefficients, a, are “only consistently greater than 0.7 when the (separation) distance is less than about 20 to 30km”. Based on this statement, the exponential cross-correlation function used in the CARMA(1,1) model was assigned a lag distance parameter of 30 km.
Figure 3. Cumulative Distribution Functions of the Historical and Stochastically
Figure 4. Autocorrelation Function of the Historical and Stochastically Generated
Annual Rainfall at Asmara
The cross-correlation decreases to a small value as the distance approaches the magnitude of the separation distance between Asmara and Keren, about 70km. A scatter plot of the annual rainfall records at Asmara and Keren, for which the cross-correlation coefficient is equal to 0.0535, is shown in Figure 5.
Figure 5. Scatter Plot of Annual Rainfall Records at Asmara and Keren
Each of the eleven CARMA(1,1) generated stochastic annual rainfall records were adjusted so that its long-term average rainfall would correspond to the average annual rainfall of the sub-basin to which it is applied. The average annual rainfall of each sub-basin was
calculated from the mean annual rainfall map of Eritrea that was produced by Van Buskirk (2000).
Subsequently, the generated annual rainfall time series were disaggregated into daily rainfall records using a modified version of the stochastic daily rainfall generator
implemented in the WXGEN generator. This generator preserves the monthly statistical properties of the rainfall records that are preserved when using the WXGEN generator, but in addition also preserves the statistical properties of the annual rainfall records as
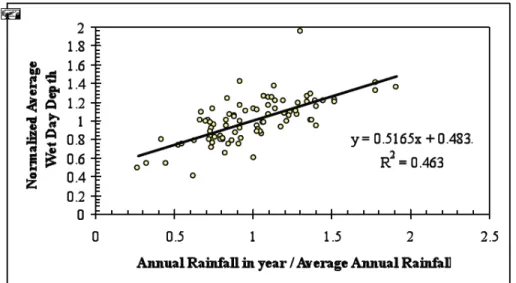
generated by the CARMA(1,1) model. The WXGEN generator uses a Markov chain-skewed model, whereby a first-order Markov chain is used to define a day as wet or dry, and a skewed distribution is used to generate precipitation depths for wet days. In the modified version of the daily generator used here, the monthly probabilities of obtaining a wet day following either a wet or dry day are adjusted each year based on relationships between these probabilities and annual precipitation that were derived on the basis of historical data at Asmara, as shown in Figure 6.
Figure 6. Relationships of Wet-Dry Transition Probabilities to Annual Rainfall at
Asmara
Similarly, in the modified generator, the averages and standard deviations of wet day rainfall depths were also adjusted based on the historical data at Asmara. Plots of the average wet day rainfall depths and of the number of wet days per year to annual rainfall are shown in Figure 7.
After generating rainfall events and depths for a particular year, the generated daily depths were multiplied by an adjustment factor so that the sum of the generated depths would total to the CARMA(1,1) annual rainfall for that year.
Figure 7: Relationships of Wet Day Rainfall Depths and the Number of Wet
Days per Year to Annual Rainfall at Asmara 6. Results and Discussion
Table 1 and Table 2 show a comparison of the statistical properties of the historical and generated precipitation for Asmara. It can be seen that the generated data reasonably preserves most of the statistical properties of the historic precipitation record.
The new stochastic precipitation records generated using the CARMA(1,1) model and the modified version of WXGEN were entered into the SWAT model of the Anseba River basin. The CDF of the resulting simulated flows is shown in Figure 8 along with the data from Figure 3 for comparison.
It may be seen from Figure 8 that the CDF based on the newly generated stochastic rainfall falls between the CDFs for the cases of spatial cross-correlation equal to zero and unity. The newly simulated flows exhibit wet and dry periods, including extended droughts, but avoid the extremes that were exhibited by the simulation for which cross-correlation equaled unity. Thus, it appears that the proposed improvements have had the desired effects on the resulting simulated flows. The improved model results were subsequently used in reservoir sizing and selection analyses, and engineering designs have since been completed on the selected alternative, an off-stream dam site on the Metemek stream, a tributary to the Anseba River.
7. Conclusions
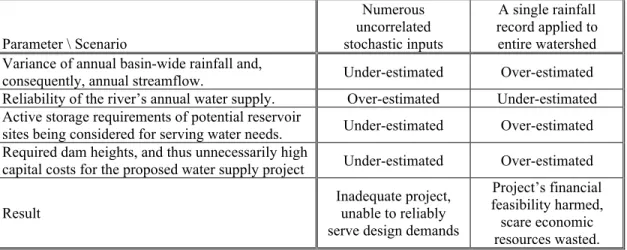
Spatial correlation must be accounted for when generating stochastic precipitation for use in water supply modeling studies. Failure to adequately characterize spatial precipitation in such studies may have serious consequences for the design of water supply projects, as shown in Table 2.
Table 1. Comparison of Monthly Statistical Properties of the Historical and Generated
Precipitation for Asmara
Month Average Monthly Rainfall (mm) Standard Deviation of Wet Day Depths (mm) Skewness Coefficient of Wet Day Depths (mm) Prob (Wet| Dry) Prob (Wet| Wet) Average Number of Wet Days in Month Average Wet Day Depth (mm)
Monthly Statistics of the Historical Asmara Precipitation
Jan 1.7 3.9 3.53 0.019 0.262 0.78 2.18 Feb 2.4 3.9 1.77 0.021 0.269 0.80 3.00 Mar 10.9 6.3 3.21 0.063 0.300 2.54 4.29 Apr 31.6 7.9 2.96 0.119 0.456 5.33 5.93 May 39.3 9.5 3.51 0.115 0.496 5.88 6.68 Jun 38.9 8.6 2.13 0.109 0.525 5.41 7.19 Jul 165.3 11.9 2.32 0.416 0.664 17.08 9.68 Aug 158.8 13.1 2.56 0.391 0.625 15.88 10.00 Sep 23.0 7.7 3.14 0.104 0.387 4.43 5.19 Oct 11.5 5.8 2.54 0.061 0.306 2.49 4.62 Nov 15.4 7.3 2.00 0.055 0.461 2.77 5.56 Dec 3.0 3.5 2.46 0.026 0.407 1.31 2.29
Monthly Statistics of Stochastically Generated Asmara Precipitation
Jan 1.8 3.9 3.24 0.019 0.283 0.81 2.27 Feb 2.4 4.0 2.43 0.021 0.263 0.76 3.20 Mar 9.4 5.5 3.48 0.064 0.306 2.59 3.61 Apr 30.7 7.9 3.16 0.116 0.457 5.24 5.85 May 37.3 9.2 3.48 0.113 0.502 5.75 6.50 Jun 40.6 8.5 2.36 0.109 0.534 5.70 7.11 Jul 161.5 11.7 2.47 0.412 0.671 17.09 9.45 Aug 160.3 13.3 2.72 0.387 0.629 15.85 10.11 Sep 22.6 7.3 3.28 0.105 0.388 4.54 4.97 Oct 11.9 6.1 2.83 0.061 0.311 2.53 4.69 Nov 17.0 7.6 2.47 0.055 0.473 2.84 5.99 Dec 3.2 3.4 2.84 0.026 0.418 1.37 2.35
Differences Between the Stochastic and Historical Statistics (%)
Jan 6% 1% -8% 0% 8% 4% 4% Feb 0% 2% 37% 0% -2% -5% 7% Mar -14% -13% 8% 2% 2% 2% -16% Apr -3% 0% 7% -3% 0% -2% -1% May -5% -3% -1% -2% 1% -2% -3% Jun 4% -1% 11% 0% 2% 5% -1% Jul -2% -2% 6% -1% 1% 0% -2% Aug 1% 2% 6% -1% 1% 0% 1% Sep -2% -4% 4% 1% 0% 2% -4% Oct 3% 5% 11% 0% 2% 2% 2% Nov 10% 3% 24% 0% 3% 3% 8% Dec 7% -3% 15% 0% 3% 5% 3%
Table 2. Comparison of Annual Statistical Properties of the Historical and Generated
Precipitation for Asmara
Annual Statistics Historic record Stochastic record Difference (%)
Average (mm) 500.1 500.8 0.1%
Standard Deviation (mm) 157.7 158.2 0.4% Coefficient of Variation 0.315 0.316 0.2% Skewness Coefficient 0.368 0.316 -14.3% Lag-1 Autocorrelation Coefficient 0.252 0.255 1.1% Lag-2 Autocorrelation Coefficient 0.185 0.180 -2.4%
Figure 8. Comparison of the CDFs of Annual Flows of the Anseba River Simulated
Using Stochastic Precipitation Inputs Containing Varying Degrees of Spatial Correlation
Table 2. Consequences of Failing to Account for Spatial Correlation of Precipitation in
Water Supply Modeling and Design Studies. Parameter \ Scenario Numerous uncorrelated stochastic inputs A single rainfall record applied to entire watershed Variance of annual basin-wide rainfall and,
consequently, annual streamflow. Under-estimated Over-estimated Reliability of the river’s annual water supply. Over-estimated Under-estimated Active storage requirements of potential reservoir
sites being considered for serving water needs. Under-estimated Over-estimated Required dam heights, and thus unnecessarily high
capital costs for the proposed water supply project Under-estimated Over-estimated Result Inadequate project, unable to reliably
serve design demands
Project’s financial feasibility harmed, scare economic resources wasted.
It has also been shown that the WXGEN stochastic weather generator, which is built into the USDA ARS’s SWAT model, should be modified when it is to be used for water supply studies involving large watersheds. Potential improvements to WXGEN were presented by way of a case study in East Africa, and the results were discussed.
Disclaimer: The problems with the WXGEN weather generator discussed in this paper
are mainly relevant to water supply modeling studies. The objective here is to raise awareness of the importance of spatial correlation in such studies, and to suggest possible improvements. Use of WXGEN for small watersheds or for other kinds of studies without modification may be unaffected by the issues discussed in this paper.
Acknowledgements. The work presented in this paper was initially performed through an NRCE
contract with the government of Eritrea. References
Euroconsult, 1998: Sector Study on National Water Resources and Irrigation Potential, Stage I
Report (Draft), Component 1 Report, Surface Water Resources.
National Water Resources Commission, 1987: The Multi-Purpose Development of the Anseba
River with the Tzebab Reservoir, Prefeasibility Study, Interim Report, People’s Democratic
Republic of Ethiopia, Addis Ababa.
Natural Resources Consulting Engineers, Inc. (NRCE), 1995: Toker River Water Supply Project. NRCE, 2001: Final Feasibility Report, Keren Water Supply Project.
NRCE, 2002: Final Preliminary Design Report, Keren Water Supply Project. Salas, J.D., 1993: Handbook of Hydrology, edited by D.R. Maidment, McGraw-Hill.
Selassie, H. G., 1997: Technical Evaluation: Keren Water Supply and Sanitation Project,
1992-1996, Water Resources Department, Ministry of Mines Energy and Water Resources,
Asmara, Eritrea.
Seleshi, Y., and G. R. Demaree, 1995: Rainfall Variability in the Ethiopian and Eritrean Highlands and its Links with the Southern Oscillation Index J. Biogeography, 22(4/5), Terrestrial Ecosystem Interactions with Global Change, 2, 945-952.
Sharpley, A. N., and J. R. Williams, eds., 1990: EPIC-Erosion Productivity Impact Calculator, 1.
Model documentation. U.S. Department of Agriculture, Agricultural Research Service,
Tech. Bull. 1768.
U.S. Department of Agriculture (USDA) Agricultural Research Service (ARS), 2001: Soil and
Water Assessment Tool User’s Manual, Version 2000, Draft, Neitsch, S. L., J.G. Arnold, J.
R. Kiniry, and J. R. Williams, Grassland, Soil and Water Research Laboratory.
Van Buskirk, R., 2000: High-Resolution Digital Average Annual Rainfall Map, obtained online at http://www.punchdown.org/rvb/.