3D Printed Novel
Zeolite 13X - Magnesium Chloride
Composites for Ammonia Storage
Rafael Acosta Laisequilla
Materials Engineering, master's level (120 credits) 2019
Abstract
In today’s world regulations to reduce vehicle emissions are only getting tougher, from said regulations the concept of a Selective Catalytic Reduction (SCR) unit was born, designed to provide a healthy dose of ammonia (NH3)
to reduce the NOx compound into harmless components such as water and
nitrogen. In this thesis novel approaches where investigated, by combining the fast physical absorption and desorption properties of a highly porous ma-terial such as zeolites with the high storage capacity of metal chlorides we can potentially improve NH3 dosing in the low temperature operating range,
such as when vehicles have just been turned on. Additive manufacturing pro-vides a faster and convenient processing route, that can cut down costs and allows for an inexpensive prototyping phase. With the aid of 3D printing we prepared a prototype cage-like shape using zeolite 13X with a combination of PVP, binders and solvent,this structures would be used in conjunction with MgCl2, the latter would be enclosed the cage and so that their volume
ex-pansion could be contained. This approach provides a low temperature range friendly solution for the release of NH3 in a SCR unit. The experimentation
and characterization of the composites mixed by mechanical process showed great promise of what it can be achieved by incorporating zeolites and metal chlorides for ammonia storage and dosing. In the end a successful formula and process to 3D print zeolite 13X using a PAM approach was delivered that showed similar results to untreated 13X.
Acknowledgements
The road to get here has not been easy but it has been fruitful and full of valuable experiences. First I want to thank Zhejian Cao “Jerry” for his guidance and support during the master thesis, as well as Dr. Farid Aktahr for accepting me into his research group and providing me with an interesting research topic as well as his continuous supervision during the whole project. I would also like to express my gratitude towards Dr. Mohammed Elbadawi, for allowing me to use the rheology equipment, the 3D printer and sharing his knowledge on all things 3D printing rheology.A shout out to all the people in the material science department for making it a pleasant stay and providing support on equipment training.
I would also like to extend my full gratitude to EUSMAT and the AMASE coordination team, for granting me this amazing opportunity to complete my Masters studies with full financial support for the entirety of the program. It was an honor and a privilege to study abroad and gain invaluable different cultural perspectives of life.
A very special thanks to my girlfriend Michelle for providing much needed emotional support during this time away from home. Also a I would like to thank my family specially my mom for everything that she made for me that eventually brought me here.
Contents
1 Purpose 1 2 Theory 2 2.1 SCR system . . . 2 2.1.1 Amminex SCR . . . 4 2.2 Physical Absorption . . . 5 2.2.1 Zeolite 13X . . . 5 2.3 Chemical Absorption . . . 7 2.4 Additive manufacturing . . . 8 2.4.1 Ceramic 3D printing . . . 82.4.2 Pressure Assisted Micro-syringe . . . 9
3 Zeolite-Salt Composite 11 3.1 Materials . . . 11
3.2 Method . . . 12
3.2.1 Speedmixing of Mixture . . . 12
3.2.2 SEM . . . 13
3.2.3 TGA and NH3 absorption/desorption of raw materials . . . 13
3.2.4 BET surface analysis . . . 14
3.2.5 XRD . . . 15
3.3.1 SEM . . . 16
3.3.2 TGA and NH3 absorption/desorption of raw materials and composites 17 3.3.3 BET surface analysis . . . 24
3.3.4 XRD . . . 26 4 3D Printing 28 4.1 Materials . . . 28 4.2 Method . . . 29 4.2.1 Ink Production . . . 29 4.2.2 Rheological studies . . . 30
4.2.3 Pressure Assisted Micro-syringe . . . 32
4.2.4 TGA of binders . . . 34
4.2.5 Sintering/Debinding of printed samples . . . 34
4.2.6 SEM . . . 35
4.2.7 BET Surface Analysis . . . 35
4.2.8 NH3 absorption and desorption kinetics of printed samples . . . 35
4.2.9 XRD . . . 36
4.3 Results . . . 36
4.3.1 Ink production . . . 36
4.3.2 Rheological studies . . . 37
4.3.3 Design of the prototype . . . 42
4.3.4 PAM Printing . . . 43
4.3.5 TGA of binders . . . 45
4.3.6 Sintering/Debinding of printed samples . . . 47
4.3.8 XRD . . . 50 4.3.9 BET Surface Analysis . . . 53 4.3.10 NH3 sorption performance . . . 55
5 Future Work 57
List of Figures
2.1.1 Formula describing the reduction of NOx using NH3.[1] . . . 2 2.1.2 Illustration of an urea based SCR (top) and a direct ammonia dose SCR
(bottom).[2] . . . 3 2.1.3 Schematic of AdAmmine unit installation in a vehicle.[3] . . . 4 2.2.1 Flowchart describing the methods and phenomena present in physical adsorption.[4] 5 2.2.2 Schematic of the structure of Faujasite main phase present in zeolite 13X.[5] 6 2.3.1 Comparison between physisorption and chemisorption schematic.[6] . . . 7 2.3.2 Pressure-temperature diagrams for NH3 sorption in metal chlorides.[7] . . . . 8 2.4.1 Different extrusion mechanisms found on 3D bioprinters.[8] . . . 10 3.2.1 Temperature profiles for the different atmospheres for NH3 desorption inside
the TGA . . . 14 3.3.1 SEM images using secondary electrons A,B) 13X powder C,D) H13X powder
E,F) MgCl2 . . . 16 3.3.2 SEM image of zeolite 13X interacting with a MgCl2 crystal. . . 17 3.3.3 TGA curves showing NH3 absorption capacity for raw materials used in the
creation of the composites. . . 18 3.3.4 NH3 absorption kinetics of the raw materials. . . 19 3.3.5 TGA curves showing the desoprtion capacity under A)Ar atmosphere B)NH3
Atmosphere. . . 20 3.3.6 Bar graph showing the kinetics on NH3 desorption . . . 21 3.3.7 TGA curves of zeolite/salt composites showing A) NH3 absorption capacity,
B,C) . . . 22 3.3.8 Bar graph showing the composites kinetics on, A) NH3 Absorption B) NH3
desorption . . . 23 3.3.9 Bar graph showing materials BET surface area results. . . 24 3.3.10XRD patterns obtained from the different raw materials. . . 26
4.2.1 Image of the TA Discovery HR-2 Rheometer.[9] . . . 31
4.2.2 Image of the Inkredible + Bio-printer used to produce our samples. . . 32
4.3.1 Solid loading vs viscosity relationship A)InkNH B)InkH . . . 38
4.3.2 InkH A)Shear rate vs Stress curves B) Shear rate vs viscosity. . . 39
4.3.3 Amplitude sweep at 10 rad/s of final formulation plotting storage and loss modulus. . . 40
4.3.4 Viscosity vs shear rate curves of 4 different batches of the final formulation. . 41
4.3.5 Prototype design exploded view of final assembly. . . 42
4.3.6 Nozzle tip 0.8 mm and 3cc cartridge used in the bioprinter. . . 43
4.3.7 Picture showing the printer in action. . . 44
4.3.8 TGA curves of A)PVP B)Bentonite. . . 46
4.3.9 Progression of the prototype as temperature increased from 25◦C up to 700◦C. 47 4.3.10Progression of the debinding process under SEM. Top left at room tempera-ture, top right at 500◦C, bottom left 600◦and bottom right at 700◦C. . . 49
4.3.11XRD patterns of Bentonite and 13X. . . 51
4.3.12Stacked XRD patterns of the 3D printed sample using batch 4 of the final formulation at different temperatures. . . 52
4.3.13Comparison between 13X and the 700’degree C sintered sample XRD patterns. 53 4.3.14BET Surface Area results from the debinding progression. . . 54
4.3.15TGA curves showing the NH3 absorption capacity of the 3D printed sample at RT and the sintered version vs raw 13X. . . 55
4.3.16TGA curves showing the NH3 desorption capacity under NH3 atmosphere of the 3D printed sample at RT and the sintered version vs raw 13X. . . 56
1 Purpose
The aim of this Master Thesis project was to evaluate the sorption perfor-mance of zeolites in combination with magnesium chloride as NH3 carriers. The need to have NH3 dosing in a lower temperature regime below 60◦C led to the proposal of zeolites which have high physical sorption capacities that can be triggered without excessive heat input, while magnesium chloride’s chemical sorption properties needs to reach 60◦C to be activated and thus we have a portion in the start of a vehicle with no NH3 dosing until the tank heats up.
In combination with the proposal to explore zeolites it was also interesting to find a way to 3D print said materials to provide a fast and easy approach to produce prototypes to test them. The reason to choose 3D printing was its precision and it facilitated the design of a enclosed structure made from zeolite 13X to contain the volume expansion that MgCl2 experiences when it
2 Theory
2.1 SCR system
With today’s even increasingly tougher emissions regulations, it is necessary to find alternative fuel sources that have a cleaner nature, but while humanity works on developing such alternatives other solutions have been put into play to reduce contaminants from fuel combustion. One of those solutions is the selective catalytic reduction (SCR) approach which is a targeted chemical reaction in which contaminants hazardous to the environment in this case nitrogen oxides (NOx) in exhaust gas are transformed into water nitrogen.[10]
Figure 2.1.1: Formula describing the reduction of NOx using NH3.[1]
A representation and formula of the chemical process can be seen in Figure 2.1.1, where a reducing agent in this case NH3 that when heat is applied in the range of 120-200◦C it turns nitrogen oxides into nitrogen plus water, the basic fundamental is to have the double amount of hydrogen atoms available to bond with the oxygen atoms to form water the remaining nitrogen atoms would be released as a gas.[11][12]
SCRs have gone through several generations, the most common is the one that uses urea tanks. The form this works each tank is filled with a mixture of liquid urea and de-ionized water, and then this tank releases via elec-tronic control an amount of the mixture and its heated inside a compartment were the water is vaporized and the urea is melted. This process forms NH3 and isocyanic acid (HNCO), then HNCO is hydrolyzed to form another NH3 molecule and CO2 at the of the process we have 2 molecules of NH3 and
1 molecule of CO2 per each of liquid urea, which will be dosed in to the
catalyst.[13]
State of the art SCR have the same principle but use a different approach instead of having an air or air-less urea based NH3 dosing, they work by direct NH3 dosing a schematic is shown in Figure 2.1.2. Current technologies in the market that are consider state of the art are combinations using Vanadium, a composite of Copper-zeolite and Iron-zeolite based, and the novel chabazite that has a small pore size, yet we will focus on the newest technology from Amminex that uses Strontium Chloride.
2.1.1 Amminex SCR
Amminex’s AdAmmine provides almost double the capacity as the previous generations of SCR systems. The direct NH3 dosing requires less energy and is safer, the NH3 storage capacity is also almost doubled as the urea sys-tems. This is achieved by utilizing SrCl2 chemisorption capacities to store as much as twice its weight of NH3 with a usable quantity of 450g per liter of AdAmmine. This systems are safe at room temperature and no pressuriza-tion, with no leakage whatsoever.[2]
Figure 2.1.3: Schematic of AdAmmine unit installation in a vehicle.[3]
Figure 2.1.3 shows us the configuration of the complete unit, where we can see the main unit which contains a heater to release NH3 from SrCl2 at 100◦C, this NH3 gets trapped in a manifold which opens when the NH3 is required inside the SCR catalyst unit. The key thing to notice is the use of a start up unit which helps dose NH3 at lower temperatures when the vehicle has just been turned on and the main unit has not reached the operating temperature, this seems bulky and inefficient and here the idea to use a material capable to dose NH3 at lower temperatures was born.
2.2 Physical Absorption
Figure 2.2.1: Flowchart describing the methods and phenomena present in physical adsorption.[4]
Physical absorption also known as physisorption can de defined as an adsorp-tion process in which only inter molecular forces of the same type as the ones present in imperfections of gases and vapours, this type of adsorption does not create a change in the electronic orbitals of the samples involved in said process. The forces involved in physisorption are merely van der Waals forces which are not very strong.
2.2.1 Zeolite 13X
What we commonly know as zeolites are actually named tectosilicates and they can be easily found in nature but can also be synthesized artificially. The zeolite group consist of more than 50 different variations that all have the base elements silicon, aluminum and oxygen this combination makes them have a
deficiency in positive charge and that is the reason we can also find single or double charged cations in their structures such as sodium, potassium, calcium or magnesium. Their structure arrangement consists of a series of cages and channels giving an appearance of an organized network. And as mentioned they can also be produced synthetically so is the case of Zeolite 13X made from fly ash and the cation balancing the charge is Na. [14]
Figure 2.2.2: Schematic of the structure of Faujasite main phase present in zeolite 13X.[5]
Zeolites have been used because of their narrow porosity of 1.5nm ¿ as molecu-lar sieves to separate gas molecules and particles from liquids but this struc-ture limits their diffusion time, that is why their are being tailored as a mesoporous structure to have a wider application.[15] We can appreciate the structure of zeolite 13X in Figure 2.2.2 were we have a super cage in the middle and each vertex is a connected by a channel, also each vertex also functions as another cage so we can see that this zeolite consist of 2 differ-ent types of cages which increase is physical absorption properties. A study was done to quantify the NH3 absorption properties of different materials which included 13X were it was concluded that at pressures below 101 KPa it had the greatest efficiency of absorption, since the maximum saturation only occurs at higher pressures in zeolites the study found that Amberlyst 15 provided a higher amount of absorption.[16] [17] [18]
2.3 Chemical Absorption
Not only are we relying on the physical absorption properties of zeolites in this project we are also using the chemical absorption or chemisorption abilities of MgCl2 to provide a complete product that has fast sorption
ki-netics and a high sorption capacity [19]. First we have to see the difference between the two types of adsorptions, in Figure 2.3.1 we see a simple repre-sentation of both of them, with physisorption basically just staking into the surface without any chemical change to the formula of the recipient, while in chemisorption a reaction occurs and the absorbed molecule disintegrates and bonds with higher strength to the recipient, these bonds can be covalent, metallic, ionic depending on the reaction and materials involved. The condi-tions for chemisorption to occur are more strict, the surface has to be clean from any other adsorbents, temperature has to right and both the molecule and the surface have to come into contact. [20]
Figure 2.3.1: Comparison between physisorption and chemisorption schematic.[6]
MgCl2 is a very suitable metal chloride to store NH3, because for NH3 storage
it is better to have a pressure lower than the atmospheric pressure and for the release of said NH3 we need to be able have a higher NH3 pressure above 101 kPa and a low temperature below 473 K to avoid the need to re-pressurize
the system to dose the NH3.[7] MgCl2 provides all those conditions and in the
graph in Figure 2.3.2 we can see a comparative diagram with both of these condition for all metal chlorides that have NH3 storage capacities and it is confirmed that MgCl2 is one of the best.
Figure 2.3.2: Pressure-temperature diagrams for NH3 sorption in metal chlorides.[7]
2.4 Additive manufacturing
2.4.1 Ceramic 3D printing
Much has been done in terms of development to improve 3D printing, we now live in an era where we can even have 3D printer in our homes. Granted most of the know techniques of this technology are based in the printing of polymers either thermoplastics or thermosets. The state of the art in regards of printing ceramics is called robocasting, where a colloidal solution is formed and deposited via layers.[21][22] In general, in order to print a a ceramic colloidal solution using this technique it is needed: 1) the behaviour of the solution must be of pseudoplastic nature to be able to be sheared through a small orifice 2) it must be able to retain its shape before sintering
and 3) it must be able to withhold many layers after printing to create a 3D structure. The typical contents for robocasting slurries are 50-65% ceramic particles, higher than that the solid particles start to consolidate an behave more like sand and loose the ability to shear thin.[23] [24]
The group of Feilden et al. [25] were able to produce structural parts using robocasting with Alumina powders and they mixed them with hydrogels, this study make a good approach in how we are able to 3D print ceramics with a less binder content. They also produced a diagram where they made a relationship between ceramic volume fraction and temperature of printing were the were able to categorize the printability and shrinkage of their samples and this is possible to be used as a reference when working with other types of ceramic powders such as zeolites.[26]
2.4.2 Pressure Assisted Micro-syringe
The approach we implemented was similar to robocasting but it is newer, PAM is a technology currently only being used in the bio-printing community. It consists of a syringe that acts as a cartridge and a nozzle tip with a diameter smaller than 1 mm. The solution inside the syringe is the extruded using air pressure and aided by a small piston that is not connected to the equipment. Figure 2.4.1 illustrates the different extrusion modes used in current PAM printers, our printer the Inkredible + uses a combination o pneumatic and piston extrusion. Much has been doe trying to bioprint tissues and in some cases ceramics such as hydroxyapatite have been used in this technique but in very low quantities, we are going to try and use it with zeolites and at quantities similar to those of robocasting.
3 Zeolite-Salt Composite
The first part of this research has the purpose to evaluate the performance and characteristics of a basic mechanical mix of Zeolites with Metal chlorides, the purpose was to understand the perfect ratios for the mixture as well to declare if the composite would provide any improvements to the current application material.
3.1 Materials
Table 3.1.1: List of materials used in the fabrication of the zeolite-salt composite Materials List
Material Supplier Form Zeolite 13X HIPOR materials AS Powder Zeolite H13X Provided by Farid Powder Magnesium Chloride Alfa Aesar Powder
Metal chlorides have great NH3 storage capacity through chemisorption, thus they are the preferred materials to be used in current systems. Amminex is currently using SrCl2, yet the disadvantage that it provides is linked to their chemisorption is activated on the presence of higher pressure. MgCl2 was
chosen given that it can provide NH3 absorption at atmospheric pressure. All in all metal chlorides are great in terms of quantity of absorbed NH3 but still have several drawbacks such as, the chemical desorption starts from 60 degrees and their volume expands drastically after the absorption. In the other hand we have zeolites which are highly porous and have affinity to provide physisorption, and are less sensitive to temperature so makes them a great complement to the metal chlorides. Zeolite 13X and its hierarchically structured version where chosen based on the BET surface area they present over other zeolites previously examined on past work on our group.
Pairing the ability of great absorption quantity of MgCl2 with the
tempera-ture independent desorption kinetics of Zeolite 13X promise a suitable com-posite that will provide faster release rates of NH3 and will be able to operate
during engine start off and low temperature ranges below 60 degrees and thus making SCR of diesel engines more effective when NOx emissions are higher,
that is when the engine is just started and it is still cold.
3.2 Method
3.2.1 Speedmixing of Mixture
To produce the composite we mixed the zeolite powders (13X & H13X) in a 50% - 50% wt. concentration with magnesium chloride (MgCl2) using the
speed mixing machine DAC 150.1 FVZ-K. The parameters were set at 2,500 rpm for 5 minutes to achieve an uniform mixtures, trying to obtain the best dispersion and distribution of both materials. A theoretical calculation of the amount of NH3 that could be absorbed by the composites was performed so in order to confirm this an additional composite was produced with only a 20% wt. concentration of MgCl2 and 90% zeolite.
Table 3.2.1: Zeolite/salt Composites composition
Sample 13X H13X MgCl2
13X50M 50% - 50% 13X20M 80% - 20% H13X50M - 50% 50% H13X20M - 80% 20%
Table 3.2.1 shows the powder composites mixtures to be analyzed. Powders had to be poured in a 40 mm diameter mixing cup, cups were then transferred into a a holder that goes into the machine. After the mixing was done no more necessary steps were needed, the composite was ready.
Ball milling with a 5:1 weight ratio of milling media was also explored but the extra handling needed made the results not very trust worthy. It was also used to reduce particle size, but it proofed to be unsuccessful so it was no longer considered for the project.
3.2.2 SEM
To obtain images of MgCl2 crystals and zeolites particle, scanning electron
microscopy was performed on each of the raw materials and the composites, in order to define particle shape, size and morphology. was also intended to analyze the effect of the mixtures in the surface of our particles/crystals.
3.2.3 TGA and NH3 absorption/desorption of raw materials
Understanding the absorption and desorption kinetics of the materials was essential to analyze their capacities and the results of the composite perfor-mance. For these experiments a hybrid DSC/TGA machine was used, the SDT 650 from TA with the ability to perform thermogravimetric analysis and DSC under NH3 atmosphere.
The zeolites 13X and H13X where analyzed using alumina ceramic crucibles. They were first degassed under Ar atmosphere at 50ml/s to 500deg with a heating rate of 10deg/s to remove all humidity and gases that could be present inside them, when the chamber reached 25deg, they where exposed to NH3 at a flow of 100 ml/s without Ar flow to measure the absorption kinetics after the samples where saturated with NH3. To evaluate the desorption kinetics two temperature and atmosphere profiles were studied, the first seen in figure under Ar atmosphere at 50ml/s and the second profile shown in figure was performed under NH3 at 100ml/s to simulate a real world application where samples are always inside NH3 atmosphere in their respective tanks.
Figure 3.2.1: Temperature profiles for the different atmospheres for NH3 desorption inside the TGA
MgCl2 and the composites where studied using platinum crucibles. They
were first degassed under Ar atmosphere at 50ml/s to 350deg with a heating rate of 10deg/s to remove all humidity and gases that could be present inside them, when the chamber reached 25deg, they where exposed to NH3 at a flow of 100 ml/s without Ar flow to measure the absorption kinetics after the samples where saturated with NH3. The desorption profiles where the same as the zeolites so they could be compared directly.
3.2.4 BET surface analysis
Surface area can tell us if a material has absorption capacities, by measuring the BET surface area you can obtain the physisorption capabilities of your sample. Gemini VII BET surface analyzer was used to acquire the surface area and the porosity of raw materials and the composite mixtures.
A high BET surface area means the material is highly porous and or it is nanostructured. By introducing an inert gas which will not react with our sample we can measure the ability of our samples to absorb gas molecules with the assistance of applied pressure. The BET analysis was performed using liquid nitrogen as the bath at 77K the boiling temperature of N2. N2 gas
was used as the gas to be introduced in the sample surface. The atmosphere pressure for the analysis was set at 0.15 to 0.35 bar. Sample mass ranged from 0.100g - 0.120g.
3.2.5 XRD
Further experiments to characterize the structure and phases present in the materials were needed. XRD was chosen for this task, with a program set to sweep from 5 to 60 in value of 2θ.
The results from this experiment section will provide a whole profile on our materials and give us more insight on how to interpret our performance under the absorption and desorption kinetics of NH3. It is also important to identify if our materials contain impurities or has other elements present that could hinder the overall performance.
3.3 Results
It was possible to obtain clear images of the raw materials used to make the composites while also calculating an approximate particle size. Figure 3.3.1 A and B shows how the Zeolite 13X of the X family has the the cage like struc-ture with an approximate 2 microns size, they also show a tendency to form agglomerates this quality will prove to influence how the composite behaves. C and D illustrates the hierarchical version of 13X, it can be observed that the individual particles of less than 1 micron agglomerate and form rock like structures larger than 10 microns this confirms their hierarchical structure in comparison o the commercial zeolite 13X. In images E and F it is shown that MgCl2 crystals have the largest size ranging from 60-150 microns, they have
a flaky appearance.
Figure 3.3.2 shows how the zeolite 13X charge particles get attracted to the MgCl2 surface and attach to it, this characteristic may prove to be difficult
when preparing the samples to be analyzed in the TGA, making it hard to calculate the actual ratio of zeolite to salt mixture inside the crucibles.
Figure 3.3.2: SEM image of zeolite 13X interacting with a MgCl2 crystal.
3.3.2 TGA and NH3 absorption/desorption of raw materials and composites
All samples were degassed were degassed to remove any moisture and or other gases present inside them, as mentioned before zeolites were degassed
at 500◦C and MgCl2 at 400◦C to prevent a phase transformation of the salt.
When the samples were degassed and cooled to 25◦C the argon flow was shut down and NH3 was introduced in the furnace chamber.
Figure 3.3.3: TGA curves showing NH3 absorption capacity for raw materials used in the creation of the composites.
Figure 3.3.3 shows the absorption capacities of the materials and if the curves are analyzed we can also define the kinetics on how NH3 is absorbed into the materials. It is clearly visible that MgCl2 provides the best performance
in terms of absorbed quantity, with a capacity of over 60.03 mmol/g wich turned out to be double its weight, in the other hand zeolite 13X has the lowest capacity with a mean value of 7.29 mmol/g. H13X provides better capacity than its non hierarchical version with a mean average of 9.51 mmol/g absorption value.
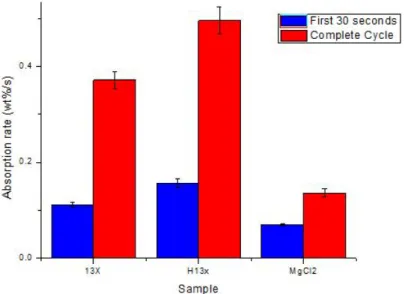
In terms of absorption kinetics, the TGA curves where analyzed 2 times the values can be found in figure 3.3.4, the first using only the first 30 seconds of when the absorption started this to compare the speed in which NH3 is absorbed in the first segment of the curve and to define which material had the
steepest slope, this was done by dividing the weight percentage increase and divided by 30 seconds. In this first analysis it was found that Both zeolites had a faster absorption rate than MgCl2 with H13X with a value near 0.15
wt%/s and 13X had a 0.11 wt%/s value compared to the 0.07 wt%/s. The second analysis was performed using the TGA curve from 0 seconds up to saturation time regardless if the time differed from each specimen. In this analysis the difference was more significant with H13X presenting a value near 0.5 wt%/s, 13X 0.37 wt%/s and MgCl 0.13 wt%/s. The results tell us that the materials have a possibility to complement one another if a composite was done using both of them. The great absorption capacity provided by MgCl2 combined with the fast absorption rate from the zeolites can provide
a great solution to be used in the low temperature range of diesel engines provided that zeolites perform better in the RT to 35◦C range.
Figure 3.3.4: NH3 absorption kinetics of the raw materials.
Once the absorption capacity and kinetics were studied, the raw materials were subjected to the NH3 desorption program in the TGA, starting with the desorption sing Ar as the atmosphere. Both temperature profiles were detailed in the method section, scenario 1 including isotherms at 35◦C, 60◦C and 200◦C, to evaluate the chemical desorption of MgCl2 in different steps and
compare it in the low temperature zone with the zeolite desorption kinetics. Figure 3.3.5 A shows the TGA curves of the first scenario of desorption and it is clearly seen that MgCl2 practically does not release NH3 in the
first step solidifying our position on mixing the materials. zeolites release a considerable amount of their content at this step, since our motive to make a composite out of these materials was to improve the performance of a SCR when an engine is cold or has just been started, the desorption rate was only analyzed using the first 100 seconds of the TGA curves.
Figure 3.3.5: TGA curves showing the desoprtion capacity under A)Ar atmosphere B)NH3 Atmosphere.
Image B makes a more realistic approach to the conditions which an actual SCR system is subjected to, being under NH3 atmosphere, it is observed that both zeolites 13X and H13X have a steady release until the temperature was set at 200◦C when it stopped. MgCl2 in the other hand has virtually
no release until 120◦C when a pronounced drop in weight is shown until it stabilizes at the 200◦C isotherm.
Figure 3.3.6: Bar graph showing the kinetics on NH3desorption
The first we can produce by looking at the desorption kinetics graph in fig 3.3.6 is that when we are under NH3 atmosphere the rate decreases almost by a factor of 3 this is due to the fact that NH3 in the atmosphere starts to absorb via physical or chemical means into the material while it is also releasing NH3, in the zeolites if we stop increasing the temperature thus no increase in energy to release NH3 from inside its super cage like structures, the TGA curve stabilizes. The NH3 release will have a continuous slope if the heating rate is maintained. In the other hand MgCl2 has almost no
apparent release until temperatures surpass 120◦C and we can appreciate a drastic weight reduction meaning a high quantity of NH3 has been chemically detached from the salt. MgCl2 under Ar atmosphere had a similar behaviour
to zeolites but much slower and he release started once reached the 60◦C mark.
After having characterized the raw materials and understood their absorption and desorption performance/kinetics under different conditions, the compos-ites produced with the speed mixer were subjected to the same test parame-ters so they could be compared to their raw counterparts. It was expected for
the composites to have a mixed performance, showing a faster desorption rate than MgCl2 by itself while having an increased volume capacity to contain
more NH3.
Figure 3.3.7: TGA curves of zeolite/salt composites showing A) NH3 absorption capacity, B,C) NH3desorption performance under NH3 and Ar atmospheres respectively.
First off we compare the absorption capacities, raw zeolites showed 7.29 mmol/g of weight absorption capacity whilst the H13X had 9.51 mmol/g, the 13X20M and H13X20 saw a 14.67 mmol/g and 18.71 mmol/g absorption respectively, this results adhered to the theoretically projected absorption ca-pacity. Both zeolites had a double increase of absorption capacity, the higher surface area of H13X greatly benefited the composite providing more super cage pores from the faujasite phase present in the 13X zeolite family. 13X50M showed great promises by being able to increasing its absorption capacity up to 29.94 mmol/g, H13X50M went up as high as 38.75 mmol/g. The values confirmed the calculated projections thus allowing to interpolate values for different concentrations. If we now take a close look at the absorption kinetics displayed on figure 3.3.8A its is possible to see that practically all compos-ites have the same absorption rate in the complete cycle, yet the higher the MgCl2 content the lower the absorption rate during the first 30 seconds of
the absorption process, confirming what we have seen previously that the physical absorption properties of the zeolites have a superior absorption rate than our salt. Also if we now compare both zeolites we can see kinetics even though higher in the H13X composites the difference is not too high to talk about using the more expensive version to move on with the project, it came
down to their desorption kinetics.
Figure 3.3.8: Bar graph showing the composites kinetics on, A) NH3 Absorption B) NH3 desorption
Looking into the performance of NH3 desorption under NH3 atmosphere it is clear that the composite shoes a mixed performance, the first 500 seconds we can appreciate a steady release the only change between specimens is the steepness of the line that is higher the lower the amount of MgCl2 resembling
the performance of raw our raw zeolites, it is also curious to see that 13X has a greater release rate and steeper curve in the first segment than H13X. When temperature reached 120◦C same as pure MgCl2 we see the dramatic
weight drop in the composites. The performance of the composites under Ar complemented the performance under NH3, showing a mixed performance. Looking closer at the desorption kinetics on figure 3.3.8B we can see that 13X and its composites are the best choice for our application, being cheaper and having a greater availability than its hierarchical version. The release of NH3 shown under NH3 is very promising because we are able to have a steady release from 25◦C up t0 120◦C meaning that we could have NH3 inside the SCR chamber at low temperatures such as when the vehicle has just been started without the need of an additional tank.
To conclude the thermal analysis of the powder composites is important to mention that with our current equipment it was not possible to evaluate the absorption and desorption of NH3 under different pressures, this is relevant because zeolites can have a higher absorption rate is the atmosphere is
pres-surized as well it can be hindered if pressure is preventing from NH3 molecules to leave the super cage sites.
3.3.3 BET surface analysis
Table 3.3.1: Materials and their BET surface area readings Material Form BET S.A. Zeolite 13X Powder 601.6 Zeolite H13X Powder 703.9 Magnesium Chloride Powder 2.9 13X50M Powder 226.0 13X20M Powder 463.8 H13X50M Powder 315.0 H13X20M Powder 511.1
Zeolites are highly porous materials and their absorption method is physical so the best approach to characterize or quantify their absorption capacities is through a surface area quantification. Figure 3.3.9 shows us the values obtained from our materials as supplied and the prepared composites. We can evaluate both zeolites in the first 2 columns, and the result confirms what was exposed on the TGA absorption curves, having zeolite H13X a higher BET surface means its particles are in a lower scale. In contrast it can be seen that the BET values for MgCl2 are almost negligible compare to our
zeolites’, this can be attributed to the smooth like surface of the salt with non existent porosity.
Looking at the right half of the BET surface area plot we find the values for the produced composites, it was interesting to see that both formulas at the 50% concentration had average values of less of the 50% value for their as supplied counterparts 13X and H13X, this surely can be attributed to higher particle size of MgCl2 that would take a larger area on the surface when
the readings took place and thus appearing to have a higher concentration of salt than zeolite, nonetheless all 4 composite configurations show a high BET surface in terms of overall value. Due to the phenomena explained of the larger MgCl2 it was not possible to find a correlation or conversion
between BET surface area values and the absorption capacities during the TGA experimentation.
The information gathered during this step of experimentation was a crucial point to characterize the potential of having a composite made from both materials, zeolites and a metal chloride (salt). The size and volume of the MgCl2 did not overpower the physical absorption sites from the zeolites, and
the final conclusion to this can be elaborated by looking back at the SEM picture showing both materials coexisting. The fact that zeolites attached to the surface of the salt crystals made them available to the nitrogen molecules despite being smaller and possibly being covered by them.
3.3.4 XRD
Performing X-ray diffraction to our raw materials was necessary specially to identify possible impurities that could produce unexpected results as well to find out the phase present in each of the materials. When we analyze the XRD patterns seen in Figure 3.3.10 we can determine that both zeolites have the same intensity peaks at the same angles meaning they have the crystal structure they do present some bumps and impurities but these can be at-tributed to the production process that introduces an Anatase contamination into the zeolites[27]. Continuing with the zeolites the commercial grade 13X has a neater pattern than H13X, this can be a result of the arrangement of the H13X particles that form a big agglomerate and each particle has a different orientation, simulating a slightly amorphous structure. In the top of the graph we can appreciate a clean pattern for our MgCl2 sample with no
impurities present.
Figure 3.3.10: XRD patterns obtained from the different raw materials.
If we look at the reference provided by the XRD analysis software we can make a peak by peak comparison and can pinpoint that the zeolites are
mainly Faujasite a zeolitic structure common in zeolites containing sodium in their structure, as mentioned above the remaining peaks in the pattern seen in our samples belong to the Anatase impurity. The XRD results ensure that we are working with the right materials and provide an extra element of characterization of our materials.
4 3D Printing
The second part of this project consisted on printing solutions that contained the materials previously studied on this work using the PAM approach of 3D printing, trying to overcome the volume expansion of MgCl2 designing a 0
expansion shape. The desired outcome of the second part was to develop a printable solution with content of Zeolite that could contain a printable solution of our salt to act as the powdered composites researched beforehand. Ideally our prints should be able to withstand thermal treatments to remove the binders.
4.1 Materials
Table 4.1.1: List of materials used in the fabrication of the 3D printed structure Material Supplier Category
Zeolite 13X HIPOR Solid load PVP Alfa Aesar Binder HPMC Alfa Aesar Binder Distilled water - Solvent NMP Sigma Aldrich Solvent
Bentonite Sigma Aldrich Solid load/Binder Magnesium Chloride Alfa Aesar Solid load
PEG400 Sigma Aldrich Solvent
As seen in table 4.1.1 for the development of out 3D printing inks we focused on only using Zeolite 13X given the cost and availability of its hierarchical counterpart. The performance data from both zeolites was not far apart from each other so if a successful development using the commercial 13X, it would be of interest to explore the investment to use H13X. The materials will be divided in three categories: Solid load, binders and solvents.
Solid loading normally refer to the solids that are suspended in a viscous solution, for this project the material of interest to provide absorption prop-erties will be our solid loading, zeolite 13X and MgCl2. It is difficult to label
it increases viscosity dramatically given its hydrophilic nature, but it will also be considered as a binder as a result of it becoming a clay and joining adjacent particles together when in presence of water.
To bind our solids a research and a cross reference on water soluble and commonly used polymers in ceramic 3D printing was performed [28] [29], PVP was the most adequate to be the binder given its low viscosity would not compromise the total solution’s viscosity allowing for more solid loading in the mix[30]. HPMC was also studied given its good mechanical properties and its wide use in 3D bio printing to create stable scaffolds.[31] [32]
Distilled water was defined as our primary solvent, it provides better thermal stability and less volatility than ethanol and acetone at room temperature. NMP and PEG400 were used as thickening solvents and to explore different formulas that could be less volatile at room temperature.
4.2 Method
4.2.1 Ink Production
In order to produce a stable printable ink several experiments and batches were developed. Starting by identifying the appropriate amount of binder and solvent in the mixture, by trying different concentrations of only binder and solvent mixes stirred by hand. Evaluation of PVP and water going from 10%wt PVP up to saturation and evaluating its behaviour by eye and consistency. The same process was used with HPMC as the binder also using only distilled water as the solvent. More complex combinations where then tested to find the right amount of water combined with NMP to be used as a solvent. After more than more than 20 different concentration experiments the current list shows the more promising combinations to be used in the production of the solid load containing inks:
• S2: 15%wt HPMC - 75%wt Distilled water
• S3: 20%wt PVP - 40%wt Distilled water - 40%wt NMP
The next step after defining the binder and solvent concentrations was to experiment with the amount of solid loading that each formulation could withhold while still being able to be pushed trough a syringe and have no visible solid particles. The speed mixer used to mix the powder composites in the first part of the project was used to mix our components to produce the inks. First we added the dry materials and mixed them at 1500 rpm for 2 minutes to ensure a well distributed sample, that would allow our binding agents to be in contact with more of our solid load particles when the solvent were to be added, therefore producing a well bonded mixture. After the dry mix was completed, the liquid solvents were introduced in the pots and introduced again in the speed mixer at 3000 rpm for 4 minutes.
Bentonite and PEG400 were then added to the mixtures to modify, viscosity, stickiness and to provide integrity to the final structure. Since Zeolite 13X goes through a phase transformation above 800◦C and looses its cage shape that provides the physisorption capabilities, bentonite is needed to provide mechanical stability after the printed samples go through the de-binding pro-cess [33]. Since bentonite does not possess absorption capacity, the amount added should be limited to minimize the impact on our final absorption prop-erties. It was decided to compromise the performance only by adding 10% of bentonite, that amount would be sufficient to add stability while having a low impact on performance overall.To have less volatile inks and preventing them from drying at the tip of our syringes we added PEG400 to compare different volatility samples.
4.2.2 Rheological studies
Characterizing the inks to be printed was crucial to understand their be-haviour and their possibility to be printed. A TA Discovery H2 rheometer
using a 20mm diameter flat plate was used to perform the experiments. To prevent the samples from drying at the plate and ruining the data obtained the temperature was set at 10◦C to avoid moisture in the samples to escape.
Figure 4.2.1: Image of the TA Discovery HR-2 Rheometer.[9]
Prior to obtaining viscosity measurements amplitude sweeps in an oscillatory setting were needed, this were performed with the goal to identify the viscoe-leastic region of our inks and their yield point. The amplitude sweeps were necessary to define the parameters for the flow programs to measure viscos-ity,, finding the viscoelastic zone ensures that you can run the flow program without yielding your sample and thus having accurate data. The amplitude sweeps where perfromed from 0.0001 pa.s shear rate to 10,000 pa.s using a 10 rad/s oscillation speed.
After obtaining the information from the amplitude sweeps the next step was to perform a relationship between solid loading % vs viscosity. Using
a flow analyzing program going from 0.001 pa.s to 1000 pa.s shear rate for 60 seconds with 10 points per logarithmic scale. This program was also applied to characterize final samples to obtain viscosity measurements and to evaluate if the sample presented shear thinning properties desired to be extruded through the nozzle tip.[34]
4.2.3 Pressure Assisted Micro-syringe
3D printing comes in many forms, for this project it was decided to use a PAM approach given the accessibility to a bio-printer on campus, and the streamlined process to produce the inks to be printed through nozzles making it very appealing to investigate if it were possible to produce stable structures. If a mechanically stable sample could be produced using a method that required a high solvent content, future research on using a more robust and complex 3D printing technology would be interesting to pursue.
Figure 4.2.2: Image of the Inkredible + Bio-printer used to produce our samples.
The printer available to the project was the Cellink Inkredible + Bio-printer as seen on figure 4.2.2 that includes two print heads with heating capacity. The printer is actuated with the use of an air compressor. Equipped with a
USB connection to connect your computer to control the printer or with the option to introduce your files with a micro SD card slot and manual controls in the front panel.
Each print head can be fitted with a 3CC printing syringe that has a modular nozzle, it was first experimented using the standard 400 microns nozzle but the prints where not stable and the sample easily dried at the tip, so the 800 microns nozzles were used for the inks containing zeolites and a 1.2mm nozzle for the inks with MgCl2. There was no temperature profile to print,
the chamber and the nozzles were used at room temperature.
Each sample geometry was designed using CAD specifically CATIA V5, a 3D shape was modeled and then saved as a STL file. The STL files were then imported to the Heartware software which is the program needed to run the bio-printer. The software simulates the print bed, in this project a 90 mm petri dish was used as the print bed, so after importing the STL files the geometry could be positioned inside the print bed and scaled in order to fit. Before printing the STL has to be ”sliced” using the software Slic3r the file is then sliced into thin layers and transformed into G-code which is the language the printer understands. After the slicing is complete the software creates a printing path for the print head to extrude the material, depending on your shape and needs you can select the infill % and the pattern to to print, for the sake of continuity and better reproduce-ability the infill was set at 100 % and the pattern chosen was a rectilinear pattern.
After finishing setting up the software we connect the printer with our com-puter using the USB connection and ensure a successful connection when the printer’s LED’s flash. Before printing a calibration of print head axis is needed, the axes are homed and then positioned at the 0 position and then it is necessary to calibrate the Z axis allowing only around 500 microns between the print bed and the nozzle tip. When all this calibration is finished the last thing needed before printing is to set up the pressure of the compressor going from 1-400 KPa, the pressure needed widely differed between samples, the
higher solid loading content and thus higher viscosity needed more pressure, but it was important to stay below 300 KPa because the compressor acted erratically not maintaining the desired pressure steady.
4.2.4 TGA of binders
Removing he binders after the samples were dry was one of the key tasks of this project, if the removal was successful it meant that our samples theo-retically had almost the same kinetics and NH3 absorption and desorption kinetics as the raw material. The binders were subjected to TGA analysis to find the temperature of degradation onset and the temperature of total burn out. Using the the TGA curve from [35] for PVP the binder was analyzed for degradation at 500◦C with a heating rate of 10◦C/s. No previous literature was found on degradation curves for commercial nanoclay bentonite so the program was set at 700◦C emulating the actual temperature in which the samples where going to be debinded.
For bentonite it was important to see if the binder presented almost negligible percentage of degradation, because it would play the role of providing me-chanical stability to our printed samples after the removal of our polymeric binder.[36]
4.2.5 Sintering/Debinding of printed samples
A final product would need to have the polymeric binder removed because they could block the zeolite pores and impeding them to interact with NH3 molecules and in turn not being able to to allocate those said molecules inside their cage structure. Using the information obtained from the TGA of the binders a temperature profile was developed to remove the binder. The removal of the binders was done under atmospheric conditions inside a box furnace.
4.2.6 SEM
It was necessary to observe the microstructure of our samples to see the effects that the binder produced and to evaluate if the shear stress applied during printing did not compromise the particles, in this section we only evaluated the samples printed from the inks containing zeolites, since the samples containing MgCl2 contained too much moisture and once debinded
only MgCl2 remained.
The samples to observe were the dried samples just after printing and the samples after debinding, it was crucial to understand how the zeolites inter-acted in the binder matrix before they were removed, those images needed to be compared against samples that had no more binder left and identify any differences in the particle shape and structure.
4.2.7 BET Surface Analysis
Before measuring the NH3 absorption and desorption capacities of the printed and debinded samples, a BET experiment was done 3 times on a printed sample prior to debinding and the same was done to those that were debinded. We expected to obtain vastly different results from both types of samples with the debinded samples having a higher BET surface area that tend to assimilate that of the raw material.
4.2.8 NH3 absorption and desorption kinetics of printed samples
The dried samples produced via 3D printing before and after debinding were studied at the SDT-650 TGA/DSC machine to measure their NH3 absorption and disorption capacities and its kinetics, the samples where degassed at 300◦C for the samples that had not been debinded and to 500◦C for those that were for both types the heating rate was 10◦C/s under argon atmosphere at 50 ml/s flow. The samples where then cooled using argon at 500 ml/s flow.
After cool down the samples were introduced to an isotherm profile at 25◦C and exposed to an NH3 atmosphere until saturation was reached. TO study their desoprtion kinetics in this case we only used the program that involved exposing them to an NH3 atmosphere at 100 ml/s flow and applying program no.1 seen previously on the TGA method for the raw materials of the powder composites.
4.2.9 XRD
X-Ray diffraction was performed again using thee same program as for the powders examined in the powder composite section, but this time we analyzed the binded and debinded 3D printed samples. This were performed to under-stand if any phase transformation occurred during the thermal degradation of the binders, and also to confirm the removal of the polymeric binder, typ-ical XRD patterns for non-crystalline polymers show wide and broad peaks so a sample before debinding should present similar peaks to those of the raw materials but with lower counts also they would be wider and not so well defined.
4.3 Results
4.3.1 Ink production
Using the speed mixer we produced over 25 different samples but just a handful were useful to the application. Table 4.3.1 shows the most promising formulas that showed potential for being 3D printed. The use of HPMC as a binder was discarded due to the fact that the inks had a very high increase in viscosity with very small quantities of solid load limiting the overall content of zeolite. Formula InkH and InkNh were the contenders to be the base of the final formula so 5 samples of each were creating using the same amount of binder and solvent and changing the % of zeolite, this with the intention
to plot the viscosity vs solid load relationship. Regarding the final formulas the only stable formula that could be printed was F1.
Table 4.3.1: List of material concentrations and % composition of inks. Sample 13X Bentonite PVP HPMC H20 NMP PEG 400 InkHBase 0 0 20 0 80 0 0 InkNHBase 0 0 20 0 40 40 0 InkHPBase 0 0 0 20 80 0 0 InkH1 10 0 18 0 72 0 0 InkH2 20 0 16 0 64 0 0 InkH3 30 0 14 0 56 0 0 InkH4 40 0 12 0 48 0 0 InkH5 50 0 10 0 40 40 0 InkNH1 10 0 18 0 36 36 0 InkNH2 20 0 16 0 32 32 0 InkNH3 30 0 14 0 28 28 0 InkNH4 40 0 12 0 24 24 0 InkNH5 50 0 10 0 20 20 0 F1 50 5 10 0 35 0 0 F2 50 5 10 0 30 0 5 4.3.2 Rheological studies
Table 4.3.2: Rheometer parameters optimized to perform viscosity tests. Parameter Value
Gap Height 500 microns Cut Height 550 microns Plate Al 20mm diameter Plate Temperature 25◦C
Test Duration 60 seconds Points per decade 10
The person in charge of the rheology lab provided several rheological studies as an example so we could formulate the best parameters to perform our tests. The parameters on Table 4.3.2 were the values used in all of our rheology tests, we chose a 20 mm aluminum plate because it provided more surface to o the test than the standard 8 mm, this plate had a flat surface and was maintained at 25◦C simulating the print conditions. To gather enough data to produce decent quality graphs 10 points were collected per decade.
Figure 4.3.1: Solid loading vs viscosity relationship A)InkNH B)InkH
The first thing to find was the solid load vs viscosity relationship, so all 10 samples (5 of each) from InkNH and InkH were submitted to a flow test, this gave us their viscosity value at shear rate of 0.01 1/s, we can appreciate in Figure 4.3.1A that InkNH shows a huge increase from 20% to 40% concentra-tion in 3 orders of magnitude, but then it has a strange behaviour by showing a significant drop, after taking a close look at the ink and comparing InkNH4 and InkNH5 the first thing we notice is the color change from a white sandy texture it turned yellow and very runny. InkNH5 was inserted in a syringe to simulate print conditions and pushed through and we were able to see that as pressure was applied the ink got harder to push through until it became im-possible. This was the effect of having a phase separation inside our ink and when we tried pushing it through all the solid ceramic particles got pushed together forming a semi solid texture and blocking the syringe nozzle.
In graph B we have the same relationship but for the Ink H formula and we can see almost no viscosity change from 10% to 30% until it shoots up at 40% and once more in 50% concentration going from a 1.3 pa.s liquid to 200 pa.s (0 to 50 %).This graph shows an exponential increase once we added more than 30% of solid load, this formula did not show phase separations and showed great potential to be used as the base of the final formula.[37][38]
Figure 4.3.2: InkH A)Shear rate vs Stress curves B) Shear rate vs viscosity.
A more detailed study of the properties of each of the 5 samples of InkH was needed to see the evolution after adding more solid load. A flow test on each sample was performed using the known parameters, but in this case we first wanted to evaluate the progression of stress inside the sample at the increase of shear rate. This graph seen in Figure 4.3.2A can be considered the stress vs strain curve or rheology, and we can appreciate that all samples have a linear stress increase as the strain (shear rate) is increased, meaning that between 0.01 and 1000 shear rate the material has not reached the yield strength, providing a stable stress reading was a crucial point to consider before printing because we do not want to yield our ink while printing, that would make it unusable after wise. Graph B demonstrates in a wider spectrum the viscosity increase of each sample, for this part of the characterization we were looking for either a straight horizontal line or a descending curve with no increases. InkH5 has our ideal behaviour because it starts with a high viscosity but as we apply shear stress it starts to lower meaning that the mixture shear thins and this is very important because we desire this property to ease the extrusion of our material to the small nozzle tips of our printer. The shear rate applied by the printer is 10 1/s so we can still have printed solution of 50 pa.s after print and that would be beneficial for the mechanical stability of the sample while drying. The viscosity characterization of the base formulas was
needed to discard potential phase separations inside the mixture, possible shear thickening and to find the relationship seen in the solid loading vs viscosity graphs.
Figure 4.3.3: Amplitude sweep at 10 rad/s of final formulation plotting storage and loss modulus.
After deciding that InkH5 was going to be used as a base formula we then proceeded to add Bentonite to the Formula and it was found that with by adding a 5 weight % we reached a desired clay like consistency and with great stability after shear. The first step in characterizing F1 (final formula) was to perform an amplitude sweep which is a test in an oscillation setting. Using a frequency of 10 rad/s and 10 points per decade we performed the amplitude sweep going from 0.1 to 1000 strain, the purpose was to find the amount strain % that would produce plastic deformation in our ink, in order to e able to set the parameters for the viscosity flow test we need to be sure that our material is not being deformed as soon as the test starts because it would make impossible to apply models to extract more information from it and the results would e inaccurate and not consistent. The amplitude sweep shown in Figure 4.3.3 gives us information regarding the storage modulus which is the energy that is stored and a decrease in the curve means that the material is deforming as well as the Loss modulus which measures the energy dissipated as heat which can be considered a viscous response of the ink. We will focus on the storage modulus and its behaviour on the amplitude sweep suggest
that at 0.1 up to 10 % oscillation strain the ink has an elastic response to the applied force so we can tune the parameters of the final viscosity test to stat below that range.
Figure 4.3.4: Viscosity vs shear rate curves of 4 different batches of the final formulation.
Finally to finish characterizing the rheological properties of our ink we duced 4 different batches using the same concentration of materials and pro-cedures but done at different days to measure the reproduceability of the process. A flow stress test was applied and the results are shown in Figure 4.3.4, we able to say that the final ink has stable results and was able to be reproduced without difficulty. The add of bentonite increased the viscosity by 2 orders of magnitude going from 200 to over 40,000 Pa.s and yet the material keeps its shear thinning behaviour and if we compare the viscosity at shear rate of 10 1/s F1 has a viscosity of 230 vs 70 Pa.s of the base InkH5 so F1 will be able to be printed. If we apply the cross model which in the rheology software we can analyze the curves and find the viscosity at 0 shear
rate and the infinite viscosity and this is possible because of the shape of our curve meets the requirements of the model, a plateau on the initial portion followed by a drop after applied shear ending with another plateau. The value for the 0 shear rate viscosity using the model is 47,390 Pa.s and 6.28 Pa.s for the infinite shear viscosity.[39] [40]
4.3.3 Design of the prototype
The whole point of 3D printing our zeolites was to create a structure capable to encapsulate the volume expansion of MgCl2. With the aid of CATIA VR5
a computer aided design a shape was designed. Thinking about a shape that could test the printers capabilities and precision and also the ink’s stability after print, the shape seen in Figure 4.3.5 was chosen having a complex infill pattern proved to be the perfect fit for the task.
Figure 4.3.5: Prototype design exploded view of final assembly.
could de placed and expanded freely after the absorption of NH3 without compromising the shape and structure. Many different shapes were explored, some with an approach similar to a sieve, eventually at the end the final product would just look as a tube so over designing the prototype was not necessary.
4.3.4 PAM Printing
Figure 4.3.6: Nozzle tip 0.8 mm and 3cc cartridge used in the bioprinter.
Once the rheological tests were done we pin pointed the final formulation for our ink and we proceeded to create our first prototypes. Using the software form Cellink, Heartware, the print could be optimized to produce the best quality prototypes possible. After importing the STL files into the propri-etary software we chose the best options available to create the samples, each sample had to be configured uniquely.
The prototypes took 4 minutes and 30 seconds to print each, the air pressure was optimized at 80-110 KPa to obtain the best ink output without over-flowing the print, it was of out most importance to prevent the overover-flowing because an overflow meant that the shape would be compromised. After we imported the STL file and before being able to print, it was necessary to
con-vert our file into G-code which is the language that 3D printers understand. After choosing a rectilinear infill pattern, we proceeded to calibrate the X,Y and Z axis of the printer.
Each sample was printed into a 90 mm petri dish substrate ad then they were left to dry. The formula containing water proved to have the perfect level of volatility, being able to be dried after 4 hours of being exposed to room temperature. Most of the first samples cracked during the drying process because they where left exposed to the environment once dried and during the months the experimentation was done the environment was very dry, so the drying process was modified so after 4 hours passed and the samples were able to be handled they were introduced into a sealed container, by doing this the samples maintained their shape crack free for over a month.
Figure 4.3.7: Picture showing the printer in action.
It is clear if we look at the image in Figure 4.3.7 that the has a great behaviour and was not plastically deformed after being sheared through the nozzle, we can say this because the shape is maintained without and of the ink running or over extruding.The print was successful and more than 10 samples were
printed without troubles once the air pressure was adjusted to the 80-100 KPa range.
Table 4.3.3: List of variables that were optimized to obtain the best printing setup Parameter Value Pressure 80-110Kpa Print Speed 125% Layer Height 0.7 mm Infill density 100% Printhead temperature 25◦C Slice height 5.8 mm 4.3.5 TGA of binders
As mentioned several times before PVP was chosen because it had a low onset point of degradation, so it was necessary to characterize its thermal behaviour to compare literature TGA curves vs what our supplied material would produce. The curve in Figure 4.3.8 tells us everything about the ther-mal behaviour of our polymer, the green curve presents the weight change over time, the red one show the temperature change with a steady heat in-crease of 10◦C per second and finally the blue curve belongs to the DSC profile. PVP is seen to degas at 100◦C and that is why we see a 5% weight decrease in the material at low temperature. The curve maintains a steady line up until 400◦C when it starts to climb down meaning the material is loos-ing mass until it stabilizes at 500◦C again with only 6% of mass remaining. The DSC also shows a downside peak at the same temperature we see the mass drop, this means that PVP has melted. The thermal characterization was done under Ar atmosphere.
Figure 4.3.8: TGA curves of A)PVP B)Bentonite.
But not only PVP was used to provide a stable matrix in our printed compos-ite.Bentonite acting as a reinforcement clay bonding the zeolite 13X particles together once the PVP was removed, for that it needed to be also subjected to thermal characterization. Figure 4.3.8B corresponds to the thermal studies done to pure Bentonite. The first thing to notice is that due to the hydrophilic nature of bentonite it carries more moisture and this can be appreciated by the 14% weight reduction that happens from 30◦C to 200◦C which was just degassing. After that we can see that we only have another mass drop at 600◦C that amounted around 3% of mass reduction. And we can see no clear peaks in the DSC curve which means that Bentonite did not have a phase change and will remain stable if subjected to a thermal treatment up
to 800◦C.
The information gathered during the thermal characterizations of our binders allowed to proceed with the designed thermal treatment of the 3D printed samples because there was clear indication that we would get rid of all if not almost all of the polymer binder and that our reinforcement binder would still be present providing mechanical stability to the print once the thermal treatment would be completed.
4.3.6 Sintering/Debinding of printed samples
Figure 4.3.9: Progression of the prototype as temperature increased from 25◦C up to 700◦C.
Getting rid of the polymer was a crucial task because PVP tended to intro-duce itself into the super cage pores of zeolite 13X and thus reducing the absorption capacities of out 3D printed prototype. If we look at the TGA curve of PVP we see that we can remove 94% of it if we heat our sample to 500◦C so, yet we wanted to remove all of the polymer so it was proposed to
submit the sample to 700◦C to remove all the polymer without destroying the zeolite which degrades at 800◦C. The binder degradation was captured at different stages shown in figure 4.3.9 a 1◦C per minute heating rate was applied inside a box furnace under air atmosphere.
At room temperature the prototype has a bone/white color appearance, which is a product of the zeolite itself. PVP starts to degrade at 400◦C so when we took it out at 500◦C we are able to observe a black appearance that is caused because of the carbon that is left behind after the burn of PVP, so we can say that the sample is covered in char. When the polymer is burned the chains are destroyed and the only thing left is carbon which is black in color. So 100 degrees later at 600◦C the sample has turned dark gray meaning that some of the carbon of the charred sample has reacted with the air atmosphere of the furnace and have left the sample.
At 700◦C we can see a total transformation of the sample going back to the color it had at room temperature, this is a sign that we were successful upon removing the polymer binder of the sample. After the thermal treatment was completed we left the sample to cool for 1 hour at room temperature. No cracks were formed from the thermal treatment or the cooling process, the sample as able to be handled without breaking, this can be attributed by the addition of bentonite which was now acting the role of primary binder of the zeolite.
The thermal treatment was repeated 3 times, and no irregularities were found. Zeolite 13X was able to maintain its stability if we maintained a tempera-ture below the 800◦C threshold. At the moment no mechanical tests where planned to characterize the samples properties in regards to stiffness and ulti-mate strength, since we only needed a prototype strong enough to be handled by hand without breaking.
4.3.7 SEM
Figure 4.3.10: Progression of the debinding process under SEM. Top left at room temperature, top right at 500◦C, bottom left 600◦and bottom right at 700◦C.
Even if by the naked eye we could tell that we got rid of PVP during the thermal treatment it is necessary to confirm this using special techniques such as SEM we can look inside the microstructure of our samples. By taking SEM images of the samples after going through different stages of the thermal treatment we can understand what is happening inside our material. Figure 4.3.10 provides a clear transformation progress of our samples. At room temperature we can see that we have PVP chains entangling the zeolite 13X particles holding them together, as well as a slime looking material which is the added bentonite also providing adhesion to the zeolite. This arrangement
![Figure 2.1.3: Schematic of AdAmmine unit installation in a vehicle.[3]](https://thumb-eu.123doks.com/thumbv2/5dokorg/4297420.96114/12.892.236.656.421.675/figure-schematic-adammine-unit-installation-vehicle.webp)
![Figure 2.2.1: Flowchart describing the methods and phenomena present in physical adsorption.[4]](https://thumb-eu.123doks.com/thumbv2/5dokorg/4297420.96114/13.892.124.777.213.578/figure-flowchart-describing-methods-phenomena-present-physical-adsorption.webp)
![Figure 2.2.2: Schematic of the structure of Faujasite main phase present in zeolite 13X.[5]](https://thumb-eu.123doks.com/thumbv2/5dokorg/4297420.96114/14.892.278.618.336.602/figure-schematic-structure-faujasite-main-phase-present-zeolite.webp)
![Figure 2.3.1: Comparison between physisorption and chemisorption schematic.[6]](https://thumb-eu.123doks.com/thumbv2/5dokorg/4297420.96114/15.892.188.710.578.826/figure-comparison-between-physisorption-and-chemisorption-schematic.webp)
![Figure 2.3.2: Pressure-temperature diagrams for NH 3 sorption in metal chlorides.[7]](https://thumb-eu.123doks.com/thumbv2/5dokorg/4297420.96114/16.892.288.607.287.578/figure-pressure-temperature-diagrams-nh-sorption-metal-chlorides.webp)
![Figure 2.4.1: Different extrusion mechanisms found on 3D bioprinters.[8]](https://thumb-eu.123doks.com/thumbv2/5dokorg/4297420.96114/18.892.137.768.473.681/figure-different-extrusion-mechanisms-d-bioprinters.webp)