Towards promoting the well-being of
wheelchair users by measuring physical activity
VT2020-DA340ADaniel Abella
Course: Ingenjörsmässig problemlösning och examensarbete Main field: Computer science
Programme: Datateknik och Mobil IT
Supervisor: Dario Salvi & Carl Magnus Olsson Examiner: Arezoo Sarkheyli-Hägele
Contents
1 Introduction 6
1.1 Background . . . 6
1.1.1 Purpose and goal . . . 7
1.2 Limitations . . . 8 2 Theory 9 2.1 A variety of wheelchairs . . . 9 2.2 Sensors of movement . . . 9 2.2.1 Accelerometer . . . 9 2.2.2 GPS . . . 9 2.2.3 Rotational sensor . . . 10 2.3 Energy expenditure . . . 10 2.3.1 Physical activity . . . 11
2.3.1.1 The average human . . . 11
2.4 Heart-rate sensor . . . 11
3 Related work 12 3.1 The use of physics models related to wheelchair use . . . 12
3.1.1 Rolling frition of a rugby wheelchair . . . 12
3.1.2 Drag and sprint performance of wheelchair basketball players . . . . 12
3.2 The use of accelerometers to measure energy expenditure . . . 12
3.2.1 Accelerometer output and its association with energy expenditure during manual wheelchair propulsion . . . 12
3.2.2 Measurement of wheelchair users’ calorie consumption to develop a wheelchair activity device . . . 12
3.3 The use of a heart rate sensor to measure energy expenditure . . . 13
3.3.1 Prediction of energy expenditure from heart rate monitoring during submaximal exercise . . . 13
3.3.2 Accuracy of Apple Watch Measurements for Heart Rate and En-ergy Expenditure in Patients With Cardiovascular Disease: Cross-Sectional Study . . . 13
3.4 Physical activity and subjective recall . . . 14
3.4.1 Measurement and description of physical activity in adult manual wheelchair users . . . 14
4 Method 15
4.1 The methodology . . . 15
4.1.1 Identifying the problems . . . 15
4.1.2 Define the objectives for a solution . . . 15
4.1.3 Design and development of artefacts . . . 16
4.1.4 Demonstration . . . 16
4.1.5 Evaluation . . . 16
4.1.6 Communication . . . 17
5 Results & Analysis 18 5.1 Identifying the problem . . . 18
5.2 Define the objectives for a solution . . . 18
5.2.1 Objectives to answer RQ1 & RQ2 & RQ3 . . . 18
5.3 Design and development of artefacts . . . 20
5.3.1 Designing and modifying the physics model . . . 20
5.3.1.1 Establishing the data that needs to be collected . . . 22
5.3.2 Hardware design . . . 22
5.3.2.1 Choosing the appropriate hardware . . . 22
5.3.2.2 Hardware . . . 22
5.3.3 Establishing the requirements . . . 24
5.3.4 Software design . . . 26
5.3.4.1 Development environment . . . 26
5.3.4.2 Programming language . . . 26
5.3.4.3 Software architecture & Diagrams . . . 26
5.4 Demonstration . . . 28
5.4.1 Developing the software . . . 28
5.4.1.1 Graphical User Interface (GUI) . . . 28
5.4.1.2 Detailed view of the module software . . . 29
5.4.2 Physics model . . . 31
5.4.3 Testing the system . . . 31
5.4.3.1 Establishing experimental settings . . . 31
5.4.3.2 Questionnaire . . . 32
5.4.3.3 Data collection . . . 32
5.5 Evaluation . . . 39 5.5.1 Results average and standard deviation . . . 39 5.5.2 Results physical activity and energy expenditure and correlation . . 39 5.5.3 Results heart rate and energy expenditure correlation . . . 44 5.5.4 Results usability questionnaire . . . 44
6 Discussion 46 6.1 RQ1 | Engineering . . . 46 6.2 RQ2 | Physics . . . 47 6.3 RQ3 | Interaction design . . . 48 7 Conclusions 50 7.1 Future work . . . 50
A Data collection protocol 52
B Informed consent 53
C Extended physics model 56
D Physics model: Conservation of energy 57
E Graphical User Interface 59
Acknowledgements
I would like to express my deepest gratitude to my supervisors Dario Salvi and Carl Magnus Olsson for their tremendous assistance during every part of creating and writing this thesis. They have assisted me with their sharp thoughts, invaluable time and inspired me with their creative thinking far more than what was required or expected of them. I also whole heartedly would like to thank Magnus Krampell for his support in every step of the process from start to finish while also kindly giving up his time when he was not required to. Without his help this thesis would not be possible. Finally i would like to thank Jörgen Ekman for giving up his precious time and sharing his immensely creative thoughts to make this thesis as good as it is.
Abstract
To measure physical activity in a wheelchair user is important. Disabled people have been found to be less active and it has negative health implications. By relating to ones own physical activity in concrete form it is easier to reinforce a positive attitude towards being physically active. The aim of this thesis is to show how a system can be built, that is able to collect measurements from sensors, with usability in mind. The system consists of software that integrates an iPhone, Apple Watch and a Tacx rotation sensor mounted on a wheelchair. With the help of a physics model these measurements can estimate energy expenditure of a wheelchair user. The system was tested with four participants performing subjectively decided low, moderate and vigorous physical activity while the system collected data. In terms of absolute energy expenditure the system was inaccurate. On the other hand, correlations were found between the calculated energy expenditures and physical activity. Using measurements from the rotations sensor a correlation of 0.7315 was found between the calculated energy expenditure and physical activity, a correlation of 0.5385 using measurements from the GPS and a correlation of 0.6452 using measurements from Apples own proprietary algorithm. The created system is a promising prototype towards objective measurement of physical activity in wheelchair users.
1
Introduction
1.1
Background
A common type of physical activity for people is walking. Humans walk in their home, to work and to complete work related tasks. Unsurprisingly one way to measure physical activity is to measure the total amount of steps walked during a day [1]. These steps correlate with a certain amount of energy expenditure. For people that are able to walk there are plenty of options available to measure and access this type of information, mostly through devices such as the phone, fitness trackers and smart watches [2].
Physical activity is according to the World Health Organization [3] defined as any bodily movement produced by skeletal muscles that requires energy expen-diture and should not be conflated with exercise which is planned, structured and aimed to improve one or more components of physical fitness.
The benefits of physical activity are many. Some of these benefits include, reduced risk from dying from coronary heart disease, diabetes, helps with reducing symptoms of anx-iety and depression and promotes well-being [4].
Some people are disabled and need to use a wheelchair as a mode of transportation. Being physically disabled makes it more difficult to fulfill the daily recommended criteria for physical activity [5]. A study [6] that surveyed the physical health of a population showed that people with physical disability have been shown to be more inactive compared to those without a physical disability (47.1% vs 26.1%). The same study also showed that health professionals most of the time did not recommend physical activity as a form of treatment to people with physical disability, in fact only 44% received a recommendation. In order to promote well-being for wheelchair users it is important to create an incentive for physical activity. Some research has been made regarding the efficacy of wearables and their influence on increasing physical activity in people who use them for that purpose. A study [7] summarized 274 articles on the efficacy of wearables promoting physical health. The same study found consumer wearables helped to increase physical activity in users and even helped them lose weight. It is therefore reasonable to extend the use of these technologies to wheelchair users as well.
A number of other different approaches for measuring physical activity in wheelchair users have been studied. A summary of studies [8] identified different ways to measure physical activity in wheelchair users. These were mainly, self-reporting and the use of
type of measurement proved to be dependent on the type of questionnaire administered. The Physical Activity Recall Assessment for People with Spinal Cord injury (PARA-SCI) questionnaire [9] was developed specifically for this purpose and was found to to display a large correlation between cumulative activity data in relation to the maximal oxygen consumption (V O2 max) measurements that were made to validate the results of the
questionnaire. Large to very-large positive correlations were seen for moderate intensity and heavy-intensity activity. However, this relationship was weak and non-significant for low-intensity activities [8] . The summarizing study suggests that sensors may reduce the subjective and memory recall components in self-reporting methods because the sensors produce objective measurements in comparison to for example subjective recall assess-ments [8] .
One way to objectively measure physical activity is through accelerometers. The ac-celerometers can be mounted on the body, on the wheelchair or both. According to one study it appears that the use of tri-axial accelerometers leads to a better prediction of energy expenditure than uniaxial accelrometers in persons who use a wheelchair [8] . By using a heart-rate monitor it was established that by adjusting for age, sex, body mass and fitness the energy expenditure could be accurately predicted. Although, low-intensity physical activity showed a weak relationship between heart-rate and energy expenditure [8]. The use of accelerometers mounted on the body can be relatively obtrusive due to their placement and crude user friendliness. Other methods are necessary to consider if the purpose is to create an incentive for adoption in the wheelchair-user community. Wearable consumer devices, such as the Apple Watch are becoming increasingly sophis-ticated and its sensors can be used to to predict energy expenditure in persons who use wheelchairs. Apple recently introduced a fitness tracking algorithm specifically used to ac-curately measure wheelchair pushes. The author of the summarizing study suggests that wearable devices show promise in being motivating and informative for the wheelchair users when illustrating physical activity to them [8].
1.1.1 Purpose and goal
The purpose of this thesis is to create a publicly available system, using commercial devices such as sensors, in order to objectively measure and represent physical activity data in a meaningful way to a user of a wheelchair. The goal is that by presenting the users with visual feedback of their personalised physical activity data, it will help incentivize continued physical activity and therefore promote well-being [10]. The idea is to incorporate an Apple Watch, a rotational sensor (Tacx) and a mobile phone (iPhone), into one system that represents the amount of physical activity performed by a user over a period of time. This representation will be in terms of kilocalories consumed during
a physical activity session. The energy expenditure is estimated using a physics based model of wheelchair movement. The research questions that will be answered and their respective subject categories can be stated as follows
RQ1 | Engineering
How can different sensors be integrated into one system to measure energy expenditure of a wheelchair user?
RQ2 | Physics
How can physical activity be measured in wheelchair users? RQ3 | Interaction design
How can physical activity be presented to the wheelchair user in a mean-ingful way?
1.2
Limitations
One of the limitations of this thesis is that accelerometer sensors are known to be noisy and therefore it can affect the data extracted. The use of only one rotation sensor also results in a limitation as any measurements of rotations will rely on an entire revolution being made and this results in a smaller number of collected data samples. Furthermore, some of the data that is collected, is accessed through Apples own frameworks and results in some of the data collected not being in real-time, for example the heart rate and push rate. It is also not known how well documented these frameworks are and it may subsequently affect software implementations. Another limitation is that the thesis includes inferences. For example, energy expenditure can be inferred with the help of heart-rate data or accelerometric data. This approach results in an indirect measurement which may be inaccurate. The main limitation is that physical activity in terms of METs is used as a ground truth to compare the energy expenditure calculations with, and that this model is unreliable in comparison to the gold standard of an indirect calirometric test with the help of V 02 measurements.
2
Theory
2.1
A variety of wheelchairs
Moving around is as important for disabled people as it is for non-disabled. One way this happens is through the use of a wheelchair. The wheelchair comes in many varieties depending on the need. Some are for everyday use and others specifically meant for sports activities. They main way for the wheelchairs to move could be through a physical stroke on the wheels or through the use of an electric motor.
2.2
Sensors of movement
2.2.1 Accelerometer
The accelerometer works with the help of a Microelectromechanical system (MEMS). A MEMS device works with the use of a very small capacitor. The positive and negative plates of the capacitor react to the movement of a small silicon component. When the silicon component moves, which it does when it reacts to a gravitational change like the movement of a mobile device, it brings some plates of conductivity closer than others and creates an electrical capacitance which is then turned into measurable voltage [11]. 2.2.2 GPS
The GPS system is foremost an American system based on satellites, ground radar, atomic clocks and receivers. The variables that need to be known are the locations of the satellites which is continually updated with the ground radar systems. The time at which an electromagnetic signal is sent from the satellite to the receiver is also important, a small deviation in the timestamp results in a major error regarding the estimation of the location of the receiver. By using four or more satellites the location of the receiver can be estimated accurately [12] as illustrated in the image below.
Figure 2.1: A 2D illustration of how the GPS system works. The rings represent the signals of the satellites and their intersections allow for the estimation of the location. Made by Daniel Abella ©
2.2.3 Rotational sensor
A rotational sensor works through the use of induction. The inductive sensors main applicability is its ability to sense electromagnetic fields nearby [13]. When the sensor is near the magnet it creates a change in voltage in the device in response to the magnetic field of the magnet which is registered as a wheel revolution. The device itself also measures the time at which the change in voltage was created and creates a timestamp which can be used to determine the amount of time it took for one revolution to be made.
2.3
Energy expenditure
The measurement of energy expenditure in humans relies on the ability to calculate the energy spent during a period of time. By measuring the quotient between the amount of oxygen consumed and the amount of carbon dioxide expended it is possible to infer the energy consumed in one breath [14]. This type of measurement is defined as indirect calorimetry and is the gold standard of measuring energy expenditure. Indirect calorime-try relies on the use of the Fick equation which accounts for parameters such as how much energy will be gained from glucose and how much will be gained from fat. Direct calorimetry [15] can also be used but requires expensive equipment and laboratory set-tings. It relies on a person performing activity in a room. The change in temperature of the room is then what will be used to calculate the energy expenditure.
2.3.1 Physical activity
Physical activity is measured in METs (metabolic equivalents). According to [16], one MET is the energy required to sit quietly which is equivalent of expending one calorie for every 1 kg per hour of sitting.
2.3.1.1 The average human
The average human weight in Sweden for males and females is 81.9kg and 66.7kg respec-tively. [17]
Low intensity
Low intensity physical exercise is everything less than 3 METs. This is for the average male equivalent to burning less than 245.7 calories and for the average female burning less than 200.1 calories per hour.
Medium intensity
Moderate intensity physical activity is categorized between 3 and 6 METs. This if for the average male equivalent to burning between 245.7 and 491.4 calories per hour and for the average female burning everything between 200.1 and 400.2 calories per hour.
High intensity
High intensity physical activity is categorized as everything above 6 METs. This is for the average male burning an amount above 491.4 calories per hour and for the average female burning an amount above 400.2 calories per hour.
A linear relationship can be inferred from the different levels of physical activity as the scale is made up of three parts, 0-3, 3-6 and 6>, linearly related.
2.4
Heart-rate sensor
The heart-rate sensor is at its core an optical sensor. When the heart pumps blood through the body, hemoglobin travels through the veins. When the measured heart rate waveform peeks there is a lot of hemoglobin in the blood. When the measured heart rate waveform is in a valley there is little hemoglobin in the blood. The optical sensor is able to detect refractions in the light that bounces of your body and these refraction patterns are different depending on the amount of hemoglobin in the blood. Noise is also picked up by the sensor but is filtered out by either hardware, software or both. [18]
3
Related work
3.1
The use of physics models related to wheelchair use
3.1.1 Rolling frition of a rugby wheelchair
The purpose of this study [19] was to establish the friction on the wheelchair related to the surface on which the wheelchair is moving as well as the friction related to the speed at which the wheelchair is moving. This data is used later on in the calculation of energy expenditure using the physics model 5.3.1.
3.1.2 Drag and sprint performance of wheelchair basketball players
The purpose of this study [20] was to measure the wheelchair drag and maximal sprint performance abilities of wheelchair basketball players and to make comparisons between male and female players. The results showed that the maximum speed reached by a participant was 5.07m/s and the maximum acceleration reached was 1.48m/s2.These
values are used as a reference to remove any data collected that are unreasonable in the test environment and can be seen used in section 5.4.3.4. Interestingly this study also mentions the use of two rotations sensors placed 180 degrees apart, implying that using only one sensor is not good enough to collect accurate speed and velocity measurements.
3.2
The use of accelerometers to measure energy expenditure
3.2.1 Accelerometer output and its association with energy expenditure dur-ing manual wheelchair propulsion
The purpose of this study [21] was to investigate whether an association between V O2,
oxygen consumption and accelerometric vector data can help determine the cutoff point between moderate and vigorous exercise. The results indicate that there is a linear rela-tionship between V O2 and the vector magnitude. Another conclusion that could be drawn
from the data was that this linear relationship was very similar irrespective of which wrist the accelerometer was worn [21]. The data indicating that the accelerometer placement is irrelevant, whether on the left or right wrist, helps with conceptualizing the experiment test conditions and this information was used in section 5.4.3.1.
3.2.2 Measurement of wheelchair users’ calorie consumption to develop a wheelchair activity device
by the accelerometer. At the same time they made an attempt to correlate the total amount of wheelchair strokes and the level of intensity with energy expenditure. The study concluded that it was possible to measure energy expenditure and that it was possible to accurately estimate it, if the levels of intensity were accounted for as well. This study provided an insight into how categorizing levels of intensity in physical activity helped improve the accuracy of estimating energy expenditure. This is useful for this study because it helps to build a scaffolding surrounding the experimental conditions that are then established. It is used in section 5.4.3.1.
3.3
The use of a heart rate sensor to measure energy expenditure
3.3.1 Prediction of energy expenditure from heart rate monitoring during submaximal exercise
This study [23] attempted to find a correlation between heart rate and energy expenditure in individuals exercising on a treadmill or a cycle ergometer. The study concluded that by knowing the heart-rate the energy expenditure can be estimated with a high accuracy if the calculations were adjusted for age, gender, body mass and fitness [23]. This study provides insight into how energy expenditure can be calculated using heart rate measurements and that there was a correlation between heart rate and energy expenditure where r = 0.857. This is used in the analysis in section 5.5.3.
3.3.2 Accuracy of Apple Watch Measurements for Heart Rate and Energy Expenditure in Patients With Cardiovascular Disease: Cross-Sectional Study
This study looks at the accuracy of the Apple Watch heart rate and energy expendi-ture measurements in patients with cardiovascular disease compared to an ECG and CPET (Cardiopulmonary exercise testing). The study concludes that the Apple Watch measures heart rate well enough for a clinical setting but that the energy expenditure measurements systematically overestimated the energy expenditure for this group of pa-tients. The authors also cautioned against using the Apple Watch to measure energy due its overestimation of energy expenditure in the study [24]. This information is used in this thesis when discussing the correlation of the calculated values between physical activity and energy expenditure in section 6.2.
3.4
Physical activity and subjective recall
3.4.1 Measurement and description of physical activity in adult manual wheelchair users
This study measure physical activity using an accelerometry based activity monitor. This study provides insight into how measured physical activity of a wheelchair user correlates with the provided subjective recall data. The study found that there is a weak correlation between the subjective recall of the physical activity and the actual measurement of the activity. [5] The conclusion of the study suggests that multiple measurement methods may provide a glimpse into the nature of how the users move and their intensity. The study also allows for extracting of valuable information regarding the application of a questionnaire and its implication on how reliable the data may be. This information was used when evaluating different questionnaires to use in this thesis in section 5.4.3.2.
4
Method
4.1
The methodology
The focus of this thesis is to perform research into the area of measuring the physical activity of a wheelchair user during a period of time. According to [25] the idea of design science research is to generate new knowledge, insight and theoretical explanations for the research domain. The core idea of the Design Science methodology is to design artefacts which will be used to answer the research questions and produce results that can be evaluated and analyzed [26]. These artefacts are created through a systematic approach that involve identifying the research questions, defining the objectives to clarify how the research questions will be answered and designing and developing the system. The artefacts are implemented through models, diagrams and software and subsequently demonstrated in terms of practical feasibility as well as evaluated in a realistic setting which is done in the demonstration activity. In the fifth step the results of the systems behaviour is shown, observed and measured. The sixth step is to communicate the results and it is done as a part of the evaluation and analysis section of the results chapter and in the discussion and conclusion chapters. All steps in the Design Science methodology are called activities [26] and will be referred to as such.
4.1.1 Identifying the problems
According to [26] this activity will contain defining the research questions and providing justifications for their usefulness. This is interpreted as an activity to narrow the scope of research and justify the value of the answers to the research questions. In order to know the focus of the research the research questions needs to be defined. The value of answers to the research questions will be justified by providing an argument for their value with respect to each other and the main idea of the thesis.
4.1.2 Define the objectives for a solution
In this activity the main task according to [26] is to infer the objectives of solutions to answers the research questions and that objectives should be inferred rationally from the research questions. To answer RQ1, a system that can collect data from a wheelchair user needs to be built. However first, to answer RQ1 a model needs to be proposed that can estimate energy expenditure and the model will be used to establish what the requirements of the system should be. Due to the fact that the user will interact with and evaluate the system, an attempt is made to fulfill the needs of the average user which implies a well thought out graphical user interface. The subsequently created artefacts are used to answer RQ3.
4.1.3 Design and development of artefacts
According to [26] this activity involves creating an artifact that include constructs, models or instantiations (defined broadly). The design and development activity involves creating a framework in the form of illustrations and diagrams, based upon the requirements, which will help in the development of the system. This design is made up of two parts, one that relates to the presentation of the information to the user in the form of a graphical user interface, and the other consisting of the implementation of collecting data by integrating the sensors and implementing the software functionality. Moreover, in this activity a list of requirements are laid out which determines the necessary functionality of the system. Due to the fact that the system relies on the "need to know variables" of the physics model, the variables of the physics model are the ones that are established first where-after the system requirements are created.
4.1.4 Demonstration
According to [26] this activity involves demonstrating the artifacts to answer one or more instances of the research questions. In this activity the system is tested with real users to produce results that can be used to evaluate the feasibility of the general idea as a good way to measure physical activity in wheelchair users. Generalizability in terms of applicability to any user of the system is therefore not the goal. Future studies will be needed to address such research questions.
Specifically, the users engage in physical activity using the artefacts created in the design and development activity, with the help of an established protocol made in the design phase. The users engage in different kinds of physical activity, low, moderate and vigorous while data is collected. Furthermore, the models and diagrams created in the design and development step serve as the basis for the implementation of the software for the system. Some software is then demonstrated as well as the visual representation of how the application looks like.
4.1.5 Evaluation
According to [26] the evaluation activity involves observing and measuring how well an artefact supports an answer to the research questions. In this phase the data that is collected from different sensors is used to calculate the energy expenditure of the user during their physical activity. These calculations are compared to Apples proprietary en-ergy expenditure calculation. The calculations are also analysed in terms of correlation to the users attempt at engaging in the subjectively determined physical activity. Moreover, users answer a questionnaire to measure the usability of the application in the demonstra-tion activity. The answers are analysed in terms of stating average scoring of the different
sections of the system. Finally, the results of the data collection and questionnaire are discussed in chapter 6.
4.1.6 Communication
According to [26] the communication activity involves communicating the problem and its importance, the artefacts, their utility and novelty, the rigor of its design and its effectiveness to researchers and other relevant audiences such as practicing professionals, when appropriate. This is done by relating the limitations described in 1.2 to the results in order to extract information about the overall usefulness and feasibility of the artefacts created to answer the research questions. There will also be a discussion surrounding the results of the artefacts and their respective validity as well as a conclusion based upon the previously made analysis and discussion, which will be done in the discussion and conclusion chapters. Potential future work is also presented for anyone interested in continuing the research.
5
Results & Analysis
5.1
Identifying the problem
These research questions are shown here again for readability with a highlighted word. The word describes which category the research question belongs to.
RQ1 ⊂ Engineering
How can different sensors be integrated into one system to measure energy expenditure of a wheelchair user?
RQ2 ⊂ Physics
How can physical activity be measured in wheelchair users? RQ3 ⊂ Interaction design
How can physical activity be presented to the wheelchair user in a mean-ingful way?
The research questions include the most important problems that need to be solved in order to create a system that is able to assess and present physical activity to a wheelchair user. The research questions are logically intertwined because providing a solution to how physical activity can be measured in terms of a physics model creates the understanding of the requirements of the system that collects the data. The third research question helps to establish a framework describing how the collected data should be presented to the user.
5.2
Define the objectives for a solution
The main overarching problem that needs to be solved is to create solutions to be able to answer each research question. In order to know how to approach the problem solving process the following problem flowcharts were created for each research question.
5.2.1 Objectives to answer RQ1 & RQ2 & RQ3
The first activity is coming up with an idea to model physical activity, which is done with the help of an expert. Then the model is modified according to related work. Afterwards it needs to be established what data needs to be collected for the model to become applicable. Figure 5.1 illustrates the overall process for this.
Design a physics model according to related workModify the model Establish the data that needs to be collected RQ2
Figure 5.1: An illustration of the steps necessary to arrive at an idea that can model physical activity in a wheelchair user.
Once the model is created RQ2 is answered. The next activity is to create the requirements for the system, based upon the established data that needs to be gathered according to the previous activity. Figure 5.2 shows a flow chart illustrating how to arrive at an understanding of what requirements are necessary.
Establish the data that needs to be collected
Evaluate the hardware that can be used to
gather the data
Choose the appropriate hardware for the task
Establish the requirements
RQ2 RQ1
Figure 5.2: An illustration of the steps necessary to understand what requirements are needed.
When the requirements are established, the system is ready to be built while keeping in mind that the requirements may change during the engineering process. The system is built by choosing a development environment, programming language, fundamental architecture and creating related diagrams outlining the system, creating a GUI and finally developing the system. This process is illustrated in figure 5.3.
Establish the requirements Choose a development environment Choose a programming language Create the fundamental architecture Draw the related diagrams
Create a GUI Develop the system
RQ1 RQ1 RQ3
Figure 5.3: An illustration of the steps necessary to develop the system.
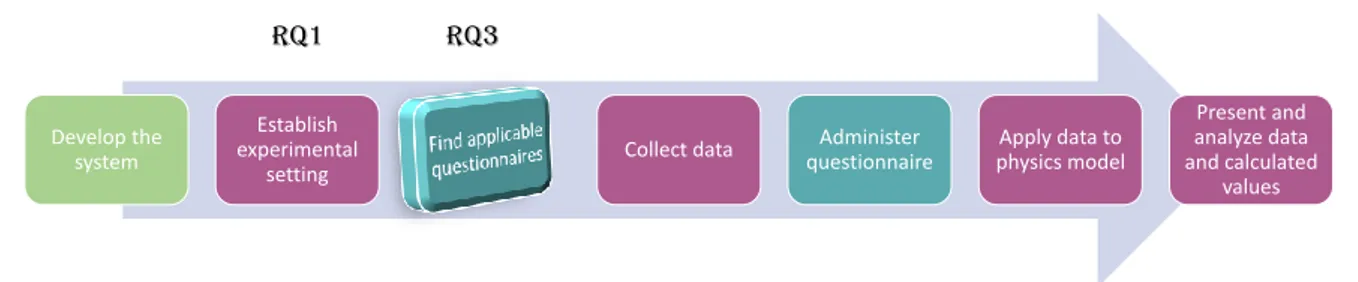
Once the system is developed RQ1 is answered. Embedded in this process is creating a GUI. The GUI is the fundamental element which answers RQ3. Furthermore, once the system is built it needs to be evaluated. To evaluate the physics model and system, an experimental setting is established and data is collected using the system. The data is
then applied to the physics model and all calculated energy expenditures are correlated with physical activity. This process is shown in figure 5.4.
Develop the system
Establish experimental
setting
Collect data questionnaireAdminister physics modelApply data to
Present and analyze data and calculated values RQ3 RQ1
Figure 5.4: An illustration of the steps necessary to evaluate the data of the system. A process is also needed to understand usability aspects of the system. This is done by first identifying applicable existing questionnaires concerning usability, then evaluate their efficacy and finally choose the most appropriate questionnaire based on its efficacy. This process is shown in figure 5.5.
Evaluate questionnaires
Choose a questionnaire RQ3
Figure 5.5: An illustration of the steps necessary to evaluate the usability of the system.
5.3
Design and development of artefacts
5.3.1 Designing and modifying the physics model
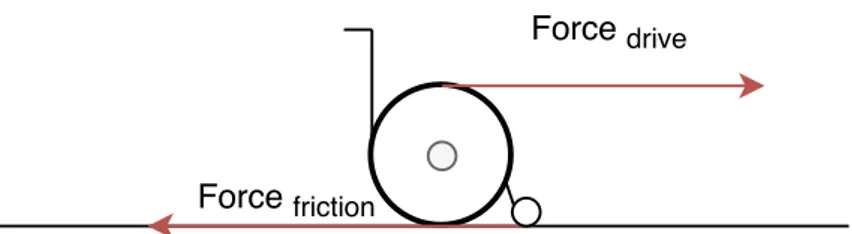
This model was developed in collaboration with but in large part by university physics lecturer Jörgen Ekman at Malmö University [27]. The model relies on the fact that the wheelchair is rolling on a non-incline surface. However, the equations can be generalized into a model that assumes an inclined surface and this is shown in appendix C. Due to the nature of wheelchair movement, it is possible to estimate the total amount of energy expended while driving the wheelchair illustrated in figure 5.6.
Force drive
Force friction
Figure 5.6: A 2D illustration of the forces acting on the wheelchair during movement. The two following equation demonstrates the relationship between the Forcedriving and
Forcef riction.
Ftotal = Fdrive− Ff riction (1)
The model originally contained a single k value of friction which was then modified ac-cording to related work [19] and can be written as
Ff riction = µR(mg) + kf(mgv2) (2)
where µR is equal to the constant of rolling friction which is a result of the resistance of
the surface and where kf is equal to the constant of speed influence on the friction.
Rephrasing the equation into a differential equation results in
ma(t) = Fdrive(t) − (µR(mg) + kf(mgv(t)2)) (3)
Acceleration when calculated using velocity measurements is approximated with a(t) ≈ v(t + ∆t − v(t)
∆t (4)
Fdrive can then be calculated in relation to the current velocity of the wheelchair. This
allows for calculation of the power according to the equation
P (t) = Fdrive(t)v(t) (5)
Once the power is known it is possible to integrate between two periods of time t1 and
t2 in order to calculate the energy expenditure between those time periods. This is done
according to E = Z t2 t1 P (t)dt ≈ N X i=1 Pi∆t (6)
where Pi is the calculate power at sample i, N is the total amount of samples between t1
5.3.1.1 Establishing the data that needs to be collected
From the energy expenditure model the following data is collected in order to demonstrate and evaluate the physics model.
• Velocity • Acceleration • Mass
• Friction constants 5.3.2 Hardware design
5.3.2.1 Choosing the appropriate hardware
The reason that the hardware selected is based upon Apple products is because the Apple Watch has a working proprietary algorithm to calculate wheel pushes [28]. The Tacx rotational sensor was chosen because it is cheap, uses BLE communication and is capable of measuring rotations which allows for calculating velocity, acceleration and distance. 5.3.2.2 Hardware
The selected devices contain the following sensors and the sensors are used because they are capable to collect the established necessary data to collect.
Apple Watch
The Apple Watch can measure total amount of wheel pushes and heart-rate. The infor-mation is sent to the iPhone through BLE communication.
• Accelerometer - Measuring wheel strokes • Hear-rate sensor
iPhone
The iPhone is the main component of the system. It serves the purpose as the main communication device with all the peripheral devices as well as the storage unit. It is also the main way for the user to interact with the system. The iPhone can measure the
wheelchair. The altitude and the distance travelled can be measured through the GPS. By measuring the distance travelled during a time interval the velocity can be inferred. The following relevant sensors are built into the iPhone.
• GPS • Barometer • Accelerometer Tacx rotational sensor
The sensor is normally mounted on a bicycle but is usable on a wheelchair as well. The magnet is mounted unto the spokes of the wheel and a bar in the nearby surroundings is used as a mount for the sensor. Due to the wheelchair not having spokes the supplied zipties were used to mount the sensor and magnet instead. The sensor measures the total amount of revolutions of the wheel and senses when the magnet gets close to the sensor. It also contains an internal 16-bit counter which runs in the background and can be used to determine the time between wheel revolutions. All of the information described above is sent to the iPhone through BLE communication for each time the wheel makes a revolution. The information can then be processed and used to infer the velocity and acceleration of the wheelchair.
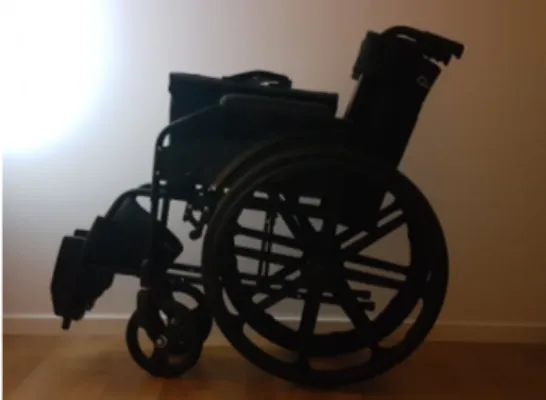
Wheelchair
A specific type of wheelchair is used, one that is meant for everyday use. It’s a foldable wheelchair with a steel frame. It weighs 19kg and has a wheel diameter of 60.96 centime-tres according to specification but was measured to be 57 centimecentime-tres. The wheelchair was made by Quirumed [29] and is shown in figure 5.7.
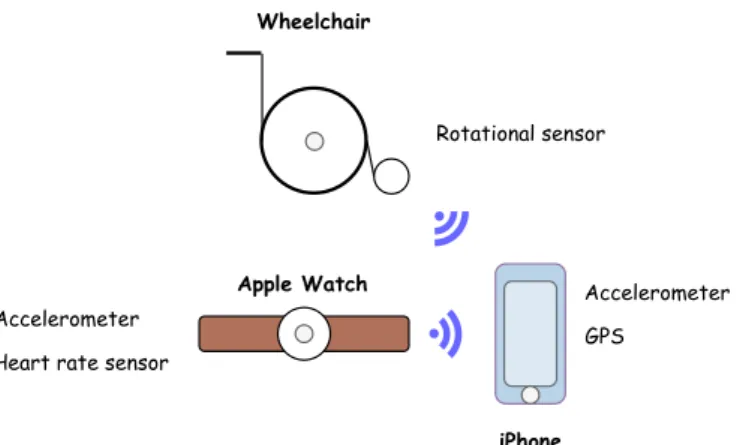
The entirety of the hardware setup is illustrated with figure 5.8. This setup, including the software is also referred to as "the system".
Rotational sensor Apple Watch iPhone Accelerometer GPS Accelerometer Heart rate sensor Wheelchair
Figure 5.8: A 2D illustration of the hardware architecture containing the devices and their respective sensors. Also shows the communication through BLE.
Evaluation of sensors
In order for single direction acceleration data to be reliable, the device that measures acceleration should be mounted in place. As mounting products were not bought for this project due to the prioritization of the velocity sensors, any acceleration data collected is likely unusable. Likewise since the GPS data on the iPhone describes the altitude, the barometer sensor which also measures altitude is not used. Since GPS data can be collected from the iPhone no such data is collected from the Apple Watch as it would be redundant.
5.3.3 Establishing the requirements
In some sense requirements can be interpreted as concrete examples of objectives. The requirements are based upon what established measurements are necessary to estimate energy expenditure according to the physics model. A few other less important require-ments are also created. These requirerequire-ments deal with altitude, push rate and heart rate collection. Based on the application of the processes in the previous sections "Objectives to answer RQ1 & RQ2 & RQ3" requirements shown in table 1 are established in ac-cordance with MoSCoW prioritization [30] which categorizes requirements as must have, should have, could have or will not have.
Table 1: MoSCoW prioritization includes requirements that are "Must have" (M), "Should have" (S), "Could have" (C) and Will not have" (W).
A General MoSCoW
1 Collect velocity data M
2 Collect accelerometer data S
3 Collect heart rate data S
4 Collect push rate data S
5 Collect altitude data S
6 Store all data into persistent storage M
7 Calculate energy expenditure M
8 The application should "look good" and be "usable" M 9 It should be possible to export the collected data in csv format M
B Velocity collection
1 Collect data from rotation sensor (Tacx) M
2 Collect data from iPhone GPS S
3 Collect data from Apple Watch GPS W C Accelerometer collection
1 Collect data from iPhone S
2 Collect data from Apple Watch W
D Heart rate collection
1 Collect data from Apple Watch S
E Push rate collection
1 Collect data from Apple Watch S
F Altitude collection
1 Collect data from iPhone GPS S
5.3.4 Software design
5.3.4.1 Development environment
xCode was chosen as the integrated development environment as it is well established in terms of functionality and documentation. It is also specifically made to interact with Apple products such as the iPhone and Apple Watch and has a built in framework to build UI elements for both the iPhone and Apple Watch.
5.3.4.2 Programming language
Swift was chosen as the programming language to be used to build the system because it is less verbose, newer and requires less code to be written in comparison to the alternative, Objective C [31].
5.3.4.3 Software architecture & Diagrams
Due to the fact that the application was developed for iPhones that by standardization contain controller classes, a Model-View-Controller (MVC) architecture [32] is used to develop the software. Since the application also had to be able to communicate and extract data from sensor, the MVC architecture will be combined with a modular architecture.
iPhone
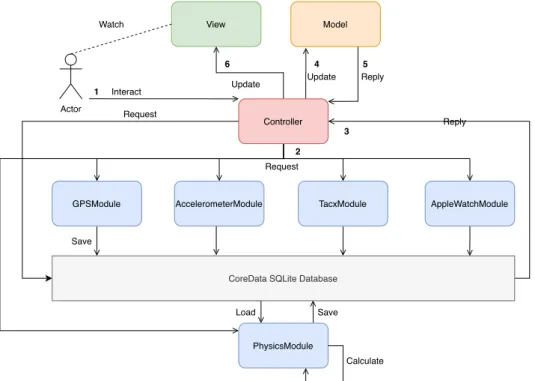
Figure 5.9 illustrates the entire iPhone architecture implemented using the MVC, and modular architectural patterns.
GPSModule AccelerometerModule TacxModule
CoreData SQLite Database
AppleWatchModule Controller View Actor Interact Save Request Update Watch PhysicsModule Save Calculate Load Request Reply Model Update Reply 1 2 3 4 6 5
Figure 5.9: A 2D illustration of the iPhone software architecture showing the interaction between the view, controller, models and modules. Also shows the storage functionality of the architecture.
The implementation of the above architecture results in requirements 5.3.3 A1, A2, A5, A6, A7, B1, B2, C1 and F1 being completed. Furthermore, an algorithm was developed to convert all stored data in the database to csv (comma separated values) format files, one for each sensor based upon the participant and workout session. It was then made available for the user to export the data through email. This fulfills requirement A9.
Apple Watch
Figure 5.10 shows that all of the functionality was put into the same class, the controller. The view in this case is called a storyboard component and its functionality is tied to the controller class. The functions that handles the querying of the push rate and heart rate data communicate with the built in central repository called HealthKit. In turn the retrieved data for heart rate and push rate is sent to the iPhone as soon as its internally updated by HealthKit.
Controller View
Get heart rate data Get push rate data
Update
Receive async Send async
Figure 5.10: A 2D illustration of the software architecture showing the interaction between the view and controller where HealthKit functionality runs in the controller.
The implementation of the above architecture results in requirements 5.3.3 A3, A4, B3, C2, D1 and E1 being completed.
5.4
Demonstration
5.4.1 Developing the software
All sensor related tasks were made into modules, one for each sensor on the iPhone device and the implementation for both the push rate and heart rate sensors on the Apple Watch were put into the controller class according to the design artefact described in 5.3.4.3. Furthermore, on the iPhone, a module was dedicated to the calculation of the energy expenditure through the physics model and another module was dedicated to the database.
5.4.1.1 Graphical User Interface (GUI)
Imple-the GUI is not made in accordance with any state of Imple-the art recommendations and Imple-the usability and aesthetic factors were subjectively decided as appropriate for this system. The images in appendix E are screenshots of the introductory tutorial slide images that shows up when the application is launched the first time. Some of the images show the main GUI of the application while others contain information about installation of the sensor and accepting terms and conditions.
5.4.1.2 Detailed view of the module software
This section describes the details of the implementation of the software. The Tacx rotation sensor is described in detail where after there is a brief description of the implementation of the physics models algorithimcal implementation. The GPS module was implemented using Apples Swift CoreLocation library, the accelerometer module using the CoreMo-tion library, the database module using the CoreData library. The push rate and heart rate functions on the Apple Watch interact directly with the internal repository called HealthKit and send the retreived information through BLE communication to the iPhone. The iPhone then handles the received message with the AppleWatch module. The source code is available through a link in appendix F.
Tacx module
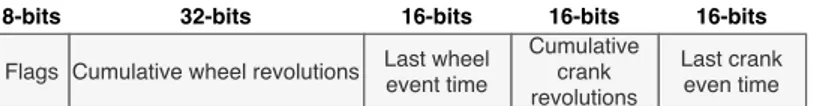
This piece of software uses Apple’s own CoreBluetooth Swift library. The software con-nects to the Tacx sensor, called a peripheral device, through its characteristic. The BLE device in the Tacx sensor has adopted standard characteristics according to GATT stan-dardization. The standard characteristics for Cycling Speed and Cadence (CSC) BLE sensors are described at [34]. The software subscribes to the CSC Measurement char-acteristic for notifications. According to the description of the charchar-acteristic, it updates each time the sensor receives a new input and sends it through BLE to the receiver if subscribed to the notification service. In Swift, the above software is implemented using predefined functions called protocols that handle the low-level communication with the BLE such as subscribing for notifications or reading data from the sensor. Once the data is received it needs to be extracted. The data packet that is received is illustrated with figure 5.11.
Flags Cumulative wheel revolutions Last wheel event time Cumulative crank revolutions Last crank even time
8-bits 32-bits 16-bits 16-bits 16-bits
Figure 5.11: An illustration of the data package that is received from the Tacx rotation sensor.
let packet = BLE_CSC_Measurement_Characteristic.value! let buffer = [UInt8](packet)
The cumulative wheel revolutions are then extracted and converted into a 32 bit value. The difference between the previous received value and the current one is the amount of turns that have been made since the last revolution, in this case because there’s only one sensor its always going to be one.
let totalRotationsBytes: [UInt8] =
[buffer[1], buffer[2], buffer[3], buffer[4]] let totalRotations =
UnsafePointer(totalRotationsBytes).withMemoryRebound (to: UInt32.self, capacity: 1)
{
$0.pointee }
The time between revolutions are then also extracted and converted into a 16-bit value let timeCounterBytes: [UInt8] = [buffer[5], buffer[6]]
let timeCounter =
UnsafePointer(timeCounterBytes).withMemoryRebound (to: UInt16.self, capacity: 1)
{
$0.pointee }
The 16-bit counter value (which runs on the sensor but is extracted) is then manipulated to represent the time since the last revolution.
/* The time between two data points is currentTime-lastTime.
When the counter rolls over to zero again it has to be handled differently.
Then the time between two data points is instead (currentTime + ((2^16-lastTime)). For example: Time1 = 55 seconds, Time 2 = 2 seconds, TimeMax = 2^16 = 65 seconds -> (2 + (65-55)) = 12 seconds. */
if(self.currentTime < self.previousTime) { self.timeSinceLastRevolutionCurrent =
} else {
self.timeSinceLastRevolutionCurrent = self.currentTime - self.previousTime }
5.4.2 Physics model
The software implementation of the physics model is a step by step implementation of the algorithm explained in section 5.3.1 with a twist in the end where the total energy is converted into kcal according to the following formula
1 kcal = 4184 J oules (7)
Energy expenditurekcal = T otal energyjoules
4184 (8)
The energy expenditure is calculated in terms of kcal/second since it has to be correlated to physical activity and the tests in section 5.4.3.3 were not conducted for exactly the equal amount of time and hence absolute values of kcal per workout session could not be used to measure correlation. However, in the application the energy expenditure is shown in terms of total kcal during the workout session for usability purposes.
Furthermore, the constants for rolling friction µRand friction due to speed kf for wheelchairs
were searched for in different studies. Throughout the search only one study [19] was found that calculated the constants independent of the weight of the users. These constants were calculated with a wheelchair weighing 169N that was rolling on a wooden surface. These are the values that are used in the implementation of the algorithm for calculating energy expenditure based on the physics model.
µR = 0.0042 (9)
kf = 3 × 10⁻⁶ (10)
5.4.3 Testing the system
5.4.3.1 Establishing experimental settings
The participants used the application on the iPhone and Apple Watch during a session described by the protocol in appendix A. In summary, they were asked to perform three sessions of physical activity with the wheelchair one each for, low, moderate and vigorous physical activity. The physical activity level would be something that was subjectively
decided. As a result they first performed low, then vigorous and finally moderate activity because the idea is that it should be easier for the user to subjectively determine what a moderate level of activity is if they already completed activities more and less physically exhausting. Moreover, the placement of the Apple Watch was chosen to be placed on the dominant hand as the placement of the watch was found to be irrelevant according to related work [21]. The test was performed outdoors on a subjectively observed to be non-incline concrete surface. The test participants were accompanied and an attempt to stop the workout at 3, 2.5 and 1.5 minutes for low, moderate and vigorous activity respectively was made.
Table 2 describes the average characteristics of the participants
Table 2: SD = Standard deviation, PA = Physical Activity
Participant
count (Disabled) Average weight kg (SD) Average age (SD)
Average minutes of PA per week
(SD) 4 (0) 80.25 (3.86) 41.25 (5.78) 150.00 (150.00)
5.4.3.2 Questionnaire
Three questionnaires were found in academic databases, selected, and evaluated for their relevance to mobile application usability. These were the TAM [35], the Mobile Affinity Scale [36] and The Mobile ApplicationRating Scale (uMARS) [37]. uMars was chosen because of its excellent internal consistency (Cronbach’s alpha = .90) which was greater than the others. It also had good test-retest reliability. The questionnaire contains 6 sections. Section A asks questions about the applications engagement, B about function-ality, C about aesthetics and D about information, E about subjective quality and F about perceived impact. In total the questionnaire contains 26 questions. This questionnaire is used to evaluate the system created, by having the user interact with the application on the iPhone and on the Apple Watch during the physical activity sessions.
5.4.3.3 Data collection
During the tests the data was collected from the sensors described in the requirements table 5.3.3. After the test was completed the users answered the uMars usability ques-tionnaire described in 5.4.3.2.
Table 3, table 4 and table 5 show explanations of the keywords that need to be known in order to understand all of the following tables in this chapter.
Table 3
Abbreviation Meaning Unit Low Low physical activity 0-3 METs Mod Moderate physical activity 3-6 METs Vig Vigorous physical activity >6 METs
P1 Participant 1 ID
Table 4
Abbreviation Meaning Unit ACC Accelerometer m/s2
TACX Tacx rotation sensor m/s GPSV GPS velocity m/s
GPSA GPS altitude m
HR Heart rate BP M
PR Push rate Average pushes/s
Table 5 shows the color-coding of the samples collected and which ones were complete, manipulated, or not used. The green color indicates data samples that were complete and not in need of manipulation before analysis. The yellow color indicates that the data samples contained unintended flaws and needed to be manipulated. In this context manipulation means that some data were duplicates and some data contained registered velocity samples suggesting a greater velocity or acceleration than is realistic within the experimental conditions according to related work [19]. The dark gray color indicates data samples that were not used in the energy expenditure calculations such as measurements made by the accelerometer, GPS altitude measurements, push rate measurements. Red indicates measurements that were incomplete in the sense that within the workout session not many or no samples were collected at all.
Table 5 Meaning Color Complete Manipulated Not used Incomplete
Table 6: Low = Low physical activity, Mod = Moderate physical activity, Vig = Vigorous physical activity P1 P2 P3 P4 LowACC LowTACX LowGPSV LowGPSA LowHR LowPR ModACC ModTACX ModGPSV ModGPSA ModHR ModPR VigACC VigTACX VigGPSV VigGPSA VigHR VigPR
In the case of the TACX sensor all values indicating a velocity greater than 5.07 and an acceleration greater than 1.48 were removed according to related work [20] that researched the maximum velocity and acceleration professional wheelchair basketball players could reach. The same type of velocity and acceleration values were also removed for some of the data samples from the GPS. In the case of the heart rate data sets, two samples of the same type were sent from the Apple Watch to the iPhone and the duplicates had to be removed. Six other data sets collected from the HR sensor were incomplete and not used. The samples for GPSA values were not used since the physics model proposed does not account for altitude differences. The accelerometer data samples were not used because the iPhone was not mounted in-place during the workout session and the values are hence unreliable. The push rate samples were incomplete and not used because the data collected was not real-time based and the updating of new samples by the internal works of the Apple HealthKit repository was not predictable.
5.4.3.4 Examples of collected data
The figures in this section represent specific data sets and all of them are contained within table 6. The figures are shown and analysed in order to demonstrate why some data sets are used, not used, manipulated or complete to begin with.
Figure 5.12 shows that heart rate data samples are collected in the time interval 35-100 seconds. This type of data does not accurately reflect the heart rate of the user during that particular workout session and is therefore an example of a data set that is not used in the analysis of the correlation between energy heart rate and energy expenditure. It can also be seen that the heart rate starts out high in the beginning, decreases and then increases as the workout session progresses.
Fig 5.13 shows a set of data samples that were complete because there is no major gap of values that would skew the average largely or any other outliers that need to be ma-nipulated. This data set was used to calculate energy expenditure.
Figure 5.13
Fig 5.14 shows the velocity sample data gathered from the rotation sensor during a work-out period. The two data points marked in red are data points gathered within a minuscule amount of time (<0.01 seconds) which implies the wheel made a complete revolution dur-ing that time and results in an acceleration that is too large accorddur-ing to the maximum value of 1.48m/s2 found earlier in related work. This is an example of an artefact where
one data point needs is removed to increase the accuracy of the result. This data set was used in the energy expenditure calculations after manipulation.
Fig 5.15 illustrates the push rate data gathered from the Apple Watch. It is a statistical average of all pushes gathered in 4 second intervals. However, it is not known through the Apple documentation how often the data is updated internally and there might hence the data shown may not accurately reflect the average push rate.
Figure 5.15
Figure 5.16 illustrates the acceleration data in a single direction (y-direction) of the iPhone. Since the iPhone is not mounted in place, the data is scattered due to ran-dom movement of the phone and it is plausible to assume it is not accurate to estimate energy expenditure with and hence it is not used. No other acceleration data sets were used to calculate energy expenditure for the same reason.
Fig 5.17 illustrates a GPS velocity data gathered from the iPhone. This data sample set was manipulated. All values indicating a velocity above 5.07 and all values indicating an acceleration above 1.48 were also removed, these values are represented by the red circle points. This data set was used in the energy expenditure calculations after manipulation.
5.5
Evaluation
This section deals with presenting and observing the energy expenditure calculations, heart rate measurements and correlations to physical activity made using the data col-lected with the system that was built. It also deals with presenting and observing the results of the administered questionnaire.
5.5.1 Results average and standard deviation
Table 7 shows the average of all values collected relative to the sensor type. Both the Tacx and GPS velocity measurements seem to increase with the activity level. However, the heart rate measurements do not. The standard deviation for the GPS measurements are approximately two to three times as large compared to the Tacx measurements. As can be seen no amount of pushes were collected for any participants in their vigorous workout session. Both the push rate and heart rate measurements were collected from the Apple Watch and incomplete heart rate and push rate measurement data sets were common in all physical activity sessions. However, the push rate does seem to increase with physical activity. The GPS altitude measurements are very similar for the different intensities of physical activity. The standard deviation of the heart rate measurements for vigorous activity is approximately twice as large compared to low and moderate physical activity. The accelerometer values do not indicate any discernabe pattern.
Table 7: The first value in the table is the average value and the second is the standard deviation recorded for all participants during that particular intensity session.
Tacx
velocity velocityGPS altitudeGPS Accelerometeracceleration Push rate Heart rate
m/s m/s m m/v2 pushes/s BPM Low activity (0.2204)0.7953 (0.5984)0.9150 (0.8880)4.5825 (0.0707)0.0146 (0.4444)4.3711 (16.8631)102.1429 Moderate Activity (0.2163)1.0147 (0.6105)1.0698 (0.7904)4.6227 (0.1003)-0.0216 (0.7689)4.8375 (15.4918)137.8676 Vigorous activity (0.3217)1.3306 (0.7564)1.2116 (0.9551)4.5827 (0.1212)-0.0063 NaN (30.6426)121.1667
5.5.2 Results physical activity and energy expenditure and correlation Due to the theory described in 2.3.1.1 it can be concluded that low, moderate and vigorous physical activity have a linear relationship. It can therefore be proposed that the values for Low, Moderate and Vigorous physical activity can be 1, 2 and 3 respectively. The
calculations for the energy expenditures of the Tacx and GPS sensors were made using the physics model designed in an earlier stage 5.3.1. As can be seen in table 8 the average amount of kilocalories expended per second for every session measured by the Tacx rotation sensor is on average two orders of magnitude less than that calculated by Apple’s proprietary algorithm while the calculated energy with the GPS sensor is one order of magnitude less compared to the same values. Furthermore, it can also be seen in table 8 that the values calculated from the measurements of the rotation sensor correlate more with physical activity in comparison to the Apple and GPSV measurements. Since collected data from the Apple Watch contained the total amount of kcal expended during the entire workout, no standard deviations were calculated for any of the sessions with regards to Apples energy expenditure measurements.
Table 8: This table describes the correlation between physical activity intensity and energy expenditure.
Session Physical activity EETACX EEGPSV EEApple Nr 1(Low) 2(Mod) 3(Vig) Avg kcal/s(SD) Avg kcal/s(SD) Avg kcal/s(SD N/A)
1 1 0.000950(0.0011) 0.008200(0.0089) 0.038294 2 2 0.001200(0.0014) 0.007500(0.0126) 0.039478 3 3 0.002900(0.0025) 0.013500(0.0162) 0.039188 4 1 (0.000299)0.000351 0.004100(0.0092) 0.033338 5 2 0.000828(0.0016) 0.007900(0.0127) 0.042725 6 3 0.001500(0.0020) 0.005100(0.0079) 0.042531 7 1 (0.000612)0.000492 0.008200(0.0103) 0.037609 8 2 (0.000854)0.000621 0.007400(0.0122) 0.039975 9 3 0.001100(0.0018) 0.009400(0.0131) 0.041352 10 1 0.000742(0.0011) 0.006000(0.0073) 0.039181 11 2 0.001500(0.0015) 0.007700(0.0092) 0.052269 12 3 0.001900(0.0019) 0.011500(0.0118) N/A Pearson Correlation 0.7315 0.5385 0.6452
Figure 5.18 shows the relation between the physical activity and energy expenditures using measurements from the rotations sensor. The energy expenditures were calculated using the physics model described in section 5.3.1.
0 0.5 1 1.5 2 2.5 3 3.5 0 0.0005 0.001 0.0015 0.002 0.0025 0.003 0.0035 Ph ys ical activ ity le ve l Kcal/s Tacx [R = 0.7315]
Figure 5.18: Physical activity level vs estimated energy expenditure using the TACX sensor.
Figure 5.19 shows the relation between the physical activity and energy expenditures using measurements from the GPS. The energy expenditures were calculated using the physics model described in section 5.3.1.
0 0.5 1 1.5 2 2.5 3 3.5 0 0.002 0.004 0.006 0.008 0.01 0.012 0.014 0.016 Ph ys ical activ ity le ve l Kcal/s GPS [R = 0.5385]
Figure 5.20 shows the relation between the physical activity and energy expenditures using measurements from the built-in Apple Watch algorithm. The energy expenditures were calculated using the physics model described in section 5.3.1.
0 0.5 1 1.5 2 2.5 3 3.5 0 0.01 0.02 0.03 0.04 0.05 0.06 Ph ys ical activ ity le ve l Kcal/s Apple [R = 0.6452]
Figure 5.20: Physical activity vs estimated energy expenditure extracted from the Apple Watch.
Table 9 illustrates the total amount of energy expenditure for the different sensors during the corresponding sessions. It was assumed they lasted on average 3, 2.5 and 1.5 minutes for low, moderate and vigorous physical activity respectively. The expected output is assumed to be 1kcal per kg per hour for 1MET. Low physical activity is described to be between 0-3METs, moderate 3-6METs and vigorous 6> METs. [16].
Table 9
Physical activity TACX Apple GPSV Expected
METs METs METs METs
1 (Low) 0.0269 1.5904 0.2961 0-3 2 (Moderate) 0.0449 1.7571 0.3409 3-6 3 (Vigorous) 0.0852 1.8686 0.4441 6>
5.5.3 Results heart rate and energy expenditure correlation
Table 10 illustrates that the heart rate measured and the energy expenditures of the different physical activity do not correlate as much as expected in related work. The study in related work [23] suggests that the correlation between energy expenditure and heart rate is 0.857. Table 10 shows that no calculated correlation is close to that value. Furthermore, it can be seen that the average heart rate for moderate activity is on average greater than that of vigorous activity. It is also noticeable that there should be twelve heart rate datasets but that there are only six. This lack of heart rate datasets is illustrated in figure 6 and explained in section 5.4.3.3.
Table 10
Session Heart rate EETACX EEApple EEGPSV Nr (Physical activity) Average BPM kcal/s kcal/s kcal/s
1 (Low) 112.35 0.000950 0.008200 0.038294 2 (Mod) 133.97 0.001200 0.007500 0.039478 3 (Mod) 141.54 0.000828 0.007900 0.042725 4 (Vig) 123.94 0.001500 0.005100 0.042531 5 (Low) 91.44 0.000742 0.006000 0.39181 6 (Vig) 118 0.001900 0.011500 0.052269 Pearson Correlation 0.172677 0.172677 0.154508
5.5.4 Results usability questionnaire
Table 11 shows an average score of the entire system created for the categories related to A: Engagement, B: Functionality, C: Aesthetics, D: Information, E: Subjective Quality and F: Perceived Impact.
The different sections rated are self explanatory but more details about the questions can be found in this study [37]. The average total score is 3.7130.
Some of the comments by the users in relation to the use of the application were "The icons are very small for SCI patients."
"App is mostly well suited for its purposes with a few tweaks on how data is presented on a small screen."
Table 11: Section A: Engagement, Section B: Functionality, Section C: Aesthetics, Section D Information, Section E: App subjective quality, Section F: Perceived Impact. Each question is scored 1-5.
Section A B C D E F Total
Average score 3.5000 4.0625 3.6364 4.1875 3.600 3.2917 3.7130 Standard deviation 0.9235 0.8539 0.8090 0.6551 1.0556 1.0826 0.3432
6
Discussion
This section contains an attempt to communicate discussions that arise related to the overall results and the limitations described in section 1.2. Each section below, RQ1, RQ2 and RQ3 contain reflections on key aspects concerning the respective research question and also describes why and how the research questions were answered.
6.1
RQ1 | Engineering
In this section the engineering challenges, that were discovered during and after the project was finished, are identified. These challenges include details relating to heart rate and push rate data collection and issues with experimental settings. By identifying the engi-neering related challenges it subsequently provides a contribution towards further research regarding measuring physical activity of wheelchair users. Hence, by showing how a sys-tem can be engineered to measure physical activity in wheelchair users, demonstrated in chapter 5, and by identifying the related challenges and limitations in this discussion, RQ1 is answered.
Table 7 shows that the average heart rate for moderate physical activity was on aver-age greater than that of vigorous activity for all participants. This could be explained by the fact that the data collected for the vigorous sessions were relatively sparse and therefore do not most likely represent the expected average outcome well. There was a problem where the Apple Watch does not always send values in the time intervals ex-pected or sends the same measurement twice to the iPhone resulting in duplicates. The reason for this problem could be an underlying issue in the implementation of the software. There was also an issue with the gathering of push rate data, where no samples were collected for the vigorous activity sessions for any participants. This is most likely due to an underlying software implementation issue which is a result of poor official documenta-tion regarding the collecdocumenta-tion of push rate data from Apples internal HealthKit repository. It may also be a result of the samples being collected but not sent to the iPhone as ex-pected. Furthermore, it is not known if the push rate data reflects the average push rate during a specific time interval. This is mentioned as a limitation in section 1.2 where it was mentioned that working with Apples frameworks may result in non-real time data access and the the documentation may not extensive enough to allow for proper software implementation.
Furthermore, a breach in the protocol was made. Due to a cold environment outside at least one participant engaged in physical activity when the participant should have