http://www.diva-portal.org
This is the published version of a paper published in Journal of diabetes and its complications.
Citation for the original published paper (version of record):
Granström, T., Forsman, H., Leksell, J., Jani, S., Modher Raghib, A. et al. (2015)
Visual functioning and health-related quality of life in diabetic patients about to undergo
anti-vascular endothelial growth factor treatment for sight-threatening macular edema.
Journal of diabetes and its complications, 29(8): 1183-1190
http://dx.doi.org/10.1016/j.jdiacomp.2015.07.026
Access to the published version may require subscription.
N.B. When citing this work, cite the original published paper.
Permanent link to this version:
Visual functioning and health-related quality of life in diabetic patients
about to undergo anti-vascular endothelial growth factor treatment for
sight-threatening macular edema
Therese Granström
a,b,⁎
, Henrietta Forsman
a, Janeth Leksell
b, Siba Jani
c,
Aseel Modher Raghib
d, Elisabet Granstam
c,ea
School of Education, Health and Social Studies, Dalarna University, Falun, Sweden b
Department of Medical Sciences, Uppsala University, Uppsala, Sweden c
Center for Clinical Research Västmanland County Hospital, Uppsala University/County Council of Västmanland, Västerås, Sweden d
Department of Ophthalmology, Dalarna County Hospital, Falun, Sweden e
Department of Ophthalmology, Västmanland County Hospital, Västerås, Sweden
a b s t r a c t
a r t i c l e i n f o
Article history: Received 9 July 2015
Received in revised form 29 July 2015 Accepted 31 July 2015
Available online 1 August 2015
Keywords:
Patient-reported measurements Health-related quality of life Visual function
Diabetic macula edema Anti-VEGF treatment
Purpose: To examine patient-reported outcome (PRO) in a selected group of Swedish patients about to receive anti-vascular endothelial growth factor (VEGF) treatment for diabetic macular edema (DME).
Material and methods: In this cross-sectional study, 59 patients with diabetes mellitus, who regularly visited the outpatient eye-clinics, were included. Sociodemographic and clinical data were collected and the patients completed PRO measures before starting anti-VEGF treatment. PRO measures assessed eye-specific outcomes (NEI-VFQ-25) and generic health-related quality of life (SF-36).
Results: The participants consisted of 30 men and 29 women (mean age, 68.5 years); 54 (92%) patients had type 2 diabetes; 5 (9%) patients had moderate or severe visual impairment; 28 (47%) were classified as having mild visual impairment. Some of the patients reported overall problems in their daily lives, such as with social relationships, as well as problems with impaired sight as a result of reduced distance vision.
Conclusions: Further studies are needed to investigate PRO factors related to low perceived general health in this patient population. It is important to increase our understanding of such underlying mechanisms to promote improvements in the quality of patient care.
© 2015 The Authors. Published by Elsevier Inc. This is an open access article under the CC BY-NC-ND license (http://creativecommons.org/licenses/by-nc-nd/4.0/).
1. Introduction
Diabetes mellitus is a lifelong disease affecting an increasing number of people worldwide (International Diabetes Federation, n.d.). Diabetes is generally divided into type 1 and type 2 diabetes mellitus: the former is characterized by beta cell destruction, the latter by insulin resistance and impaired beta cell function. The common denominator is high blood glucose (DCCT and EDIC: The Diabetes Control and Complications Trial and Follow-up Study; Stratton, Kohner, Aldington, & Turner, 2001). Late complications of diabetes include macrovascular and microvascular disease. Diabetic microvascular complications in the eye– retinopathy – occur in both type 1 and type 2 diabetes, and they affect the blood vessels of the retina (DCCT and EDIC: The Diabetes Control and Complications
Trial and Follow-up Study; Lutty, 2013; Stratton et al., 2001; UK Prospective Diabetes Study (UKPDS), 1991). Diabetic microvascular disease of the macula may induce macular edema, which can severely reduce visual acuity. The prevalence of diabetic macular edema (DME) ranges from 2.1% to 7.5% in different patient populations (Heintz, 2012; Hirai, Knudtson, Klein, & Klein, 2008; Raymond et al., 2009; Varma et al., 2014); diabetic retinopathy is a major cause of severely impaired vision and blindness globally (Bourne et al., 2014). Among DME patients, visual impairment is regarded as the most feared late diabetic complication (Janzen Claude, Hadjistavropoulos, & Friesen, 2014). In recent years, patient-reported outcome measures have acquired greater importance in capturing patients’ thoughts and feelings. Among the dimensions included in patient-reported outcome measures are quality of life, health-related quality of life, and visual function (Denniston, Kyte, Calvert, & Burr, 2014; Leksell, Wikblad, & Sandberg, 2005; Weldring & Smith, 2013; Wikblad, Smide, & Leksell, 2014).
As defined in the Early Treatment Diabetic Retinopathy Study (ETDRS), (Photocoagulation for diabetic macular edema: Early Treatment
Conflict of interest: The authors declare that there are no conflicts of interest. ⁎ Corresponding author. Tel.: +46 23 77 84 45, +46 73 460 71 45 (mobile); fax: +46 23 77 80 80.
E-mail address:tga@du.se(T. Granström).
http://dx.doi.org/10.1016/j.jdiacomp.2015.07.026
1056-8727/© 2015 The Authors. Published by Elsevier Inc. This is an open access article under the CC BY-NC-ND license (http://creativecommons.org/licenses/by-nc-nd/4.0/).
Contents lists available atScienceDirect
Journal of Diabetes and Its Complications
Diabetic Retinopathy Study Report number 1. Early Treatment Diabetic Retinopathy Study research group, 1985) clinically significant DME is sight threatening and requires treatment.Fig. 1shows a fundus and optical coherence tomography (OCT) with moderate DME compared with a healthy fundus and macular OCT. Laser therapy was established in 1985 and has been shown to reduce the risk of severe vision loss by 50% (Photocoagulation for diabetic macular edema: Early Treatment Diabetic Retinopathy Study Report number 1. Early Treatment Diabetic Retinop-athy Study research group, 1985). However, improvement in visual acuity by laser treatment is limited (Beck et al., 2009). In 2010, it wasfirst reported that repeated intravitreal administration of ranibizumab, an inhibitor of vascular endothelial growth factor (VEGF), reduces macular edema and improves visual acuity in patients with visual impairment as a result of DME (Massin et al., 2010). Other studies using ranibizumab (Elman, Elman, Aiello, Beck, & Bressler, 2010; Mitchell et al., 2011; Nguyen et al., 2012) and another inhibitor of VEGF, aflibercept (Do, Nguyen, Boyer, & Schmidt-Erfurth, 2012), have reported similarfindings. A strong association between visual acuity and patient-reported visual function independent of the severity of retinopathy and other compli-cations has been found in diabetic patients (Gonder et al., 2014; Hirai, Tielsch, Klein, & Klein, 2011; Klein, Moss, Klein, Gutierrez, & Mangione, 2001; Trento et al., 2013; Tsilimbaris, Kontadakis, Tsika, Papageorgiou, & Charoniti, 2013). The improvement in visual acuity induced by anti-VEGF treatment for DME observed in pivotal clinical trials has been found to be associated with enhanced visual function measured with the National Eye Institute Visual Function Questionnaire-25 (NEI VFQ-25) (Bressler et al., 2014; Korobelnik et al., 2014; Mitchell, Bressler, Tolley, et al., 2013), especially if the better-seeing eye has been treated (Bressler et al., 2014; Mitchell et al., 2013).
In Sweden, intravitreal administration of anti-VEGF drugs for sight-threatening DME is now part of routine clinical care. Previously, health-related quality of life and visual function were investigated in Swedish diabetic patients participating in a screening program for diabetic retinopathy (Heintz, Wirehn, Peebo, Rosenqvist, & Levin, 2012). However, information is limited about patient-reported health-related quality of life and visual function in patients with DME about to undergo intravitreal anti-VEGF treatment for visual impairment.
1.1. Aims of this cross-sectional study
• To describe visual function (NEI VFQ-25) and patient-reported health-related quality of life (36-item short-form health survey
[SF-36]) in a cohort of Swedish diabetic patients about to undergo anti-VEGF treatment for visual impairment due to DME in routine clinical care.
• To explore the relationship between patient-reported visual function and health-related quality of life with regard to visual impairment, degree of retinopathy, and whether treatment was planned for the better- or worse-seeing eye.
• To analyze the correlation between the two different objective measurements of visual acuity.
2. Methods 2.1. Subjects
This study enrolled participants with diabetes of either sex aged 18 years or older who were about to receive treatment with ranibizumab (Lucentis) for visual impairment due to DME. The patients had to be Swedish speaking and have the cognitive ability to complete the surveys and participate in an interview. Enrollment took place from May 2012 to February 2014 at two county hospitals in Sweden. We excluded patients who had previously been treated with intravitreal anti-VEGF for DME. All patients who met the inclusion criteria were asked about study participation.
2.2. Ethical considerations
This study was approved by the Regional Ethical Review Board in Uppsala, Sweden, and was conducted in accordance with the tenets of the Declaration of Helsinki. The participants obtained written and verbal information related to the study. All the participants gave their written informed consent. The data were labeled using code numbers and were handled with respect for the participants’ privacy and integrity. 2.3. Clinical assessment
Social background characteristics, including age, weight, sex, level of education, marital status, and information about employment or retirement status, were collected from all patients by interview. Data about the duration of diabetes, diabetes treatment, and late diabetic complications were obtained from medical records. Late complications included retinopathy, nephropathy, neuropathy, and macrovascular disease (previous stroke, transitory ischemic attack, or myocardial
Fig. 1. Left: male individual, aged 67 years, moderate diabetic retinopathy and diabetes macular edema in the right eye; visual acuity ETDRS 70, corresponding to logMAR 0.4. Right: healthy fundus and macular OCT in 51-year-old female individual.
infarction). Blood pressure was measured, and glycosylated hemoglobin (Lilja et al., 2013) level was obtained from electronic patient records. The patients also specified their number of late diabetic complications.
The initial eye examination included measurement of best-cor-rected visual acuity with the ETDRS or Snellen chart, slit-lamp examination of the anterior segment, intraocular pressure measure-ment, fundus biomicroscopy, and measurement of retinal thickness by OCT (Topcon Corporation, Tokyo, Japan).
We performed grading of diabetic retinopathy with indirect ophthal-moscopy as follows: mild non-proliferative diabetic retinopathy (NPDR); moderate NPDR; severe NPDR; or proliferative diabetic retinopathy (Wilkinson et al., 2003). Clinically, significant diabetic macular edema was defined according to ETDRS (Photocoagulation for diabetic macular edema: Early Treatment Diabetic Retinopathy Study Report number 1. Early Treatment Diabetic Retinopathy Study research group, 1985). Based on the patient’s better-seeing eye, visual impairment was categorized into three groups: normal vision logarithm of minimum angle of resolution (logMAR) ≤0.10; mild visual impairment logMAR 0.20–0.50; and moderate/severe visual impairment logMAR≥0.60. The degree of diabetes retinopathy was categorized based on the worse-seeing eye as mild/ moderate, severe, or proliferative.
All the patients received two questionnaires – NEI VFQ-25 and SF-36– at baseline. The patients could choose either to answer the questionnaires at the clinic or to take them home, answer them there, and return the completed forms by mail to the clinic.
2.4. Questionnaires
The eye-specific questionnaire, NEI VFQ-25, reflects the respondent’s self-reported visual function in subscales: general health; general vision; ocular pain; near activities; distance activities; driving; color vision; peripheral vision and social functioning; role difficulties; and dependency (Mangione et al., 2001; Mangione et al., 1998). The instrument has been validated for Swedish-speaking patients in the EMGT-study (Eriksson, Sjöstrand, & Kroksmark, 2008). We employed the manual for scoring (Mangione, 2000). The subscale scores were 0–100, where a higher NEI VFQ-25 score indicates better visual functioning.
The SF-36 (Maruish) measures eight dimensions of health-related quality of life: physical function; role functioning (physical limita-tions); bodily pain; general health; vitality; social function; role functioning (emotional limitations); and mental health. The SF-36 has been validated and translated into Swedish (Sullivan, Karlsson, & Ware, 1995). This survey was designed for self-administration (Ware & Sherbourne, 1992).
2.5. Methods for measuring visual acuity
We measured visual acuity either according to the ETDRS using the ETDRS letter chart at a distance of 2 m or using the Snellen chart at 5 m. ETDRS visual acuity (number of letters) was measured with the eyes planned for anti-VEGF treatment. We measured visual acuity for the other eyes using the Snellen chart. Snellen values were converted to logMAR with the formula logMAR =–log (decimal acuity) (Holladay, 1997). 2.6. Data analysis
SPSS (version 22, SPSS Inc., Chicago, IL, USA) was used for statistical analyses. We followed the manual for NEI VFQ-25 in calculating the scale conversions and subscale scores with 11 vision-related constructs plus an additional single-item general health question. The driving subscale had a high rate of missing data (17/59, 29%), and we calculated the results for 42 patients, according to the manual (Mangione, 2000). A p valueb0.05 was considered statistically significant. After verifying that they were equivalent, we merged the patients from the two eye clinics into a single cohort.
Mean scores, standard deviation (SD), and range were calculated for the subscales in SF-36 and NEI VFQ-25. We used analysis of variance (ANOVA) to examine the relationship between NEI VFQ 25 and SF-36 with regard to visual impairment, degree of retinopathy, and whether treatment was planned for the better- or worse-seeing eye. We employed the Spearman correlation analysis to analyze the correlation between ETDRS and logMAR values. Tukey’s post hoc test was used to determine subgroup differences.
3. Results 3.1. Study subjects
We enrolled 63 patients in this study. Two patients declined participation, and four patients discontinued participation after inclusion. In all, 59 patients completed the study.
3.2. Patient demographics and characteristics
Sociodemographics and clinical characteristics of the included partic-ipants appear in Table 1. The study sample was equally distributed regarding sex. The mean age was 68.5 (±10.0) years. Over half the participants had completed elementary school, and eight had attained university-level education. Most of the participants (64%) were cohabiting. The majority of participants (66%) had retired. Of the patients, 54 (92%) had type 2 diabetes. Regarding late diabetic complications, including DME, 40 (68%) patients had two or more late complications (Table 1).
Table 1
Sociodemographics and clinical characteristics of the subjects.
Variable Mean ± SD range N
Age, years 68.5 (±10.0) 45–86 59 45–60 11 61–70 23 71–80 18 N80 7 Gender 59 Male/female 30/29 Education level 59 Elementary school 33 Middle school 18 University 8 Marital status 56 Cohabiting (married) 36
Living alone (divorced/widow/widower) 20
Employment 59 Retired 39 Working 16 Unemployed/sick leave 4 Type of diabetes 59 Type 1 5 Type 2 54 Hba1C (mmol/mol) 67.68 (±15.91) 39–120 56 Duration of diabetes 17 (±10) 0–49 59 Length 167 (±9.29) 150–186 Weight 83 (±24) 47–159
Systolic blood pressure 151 (±24) 100–240 Diastolic blood pressure 82 (±11) 60–110
Diabetes treatment 59
Insulin/insulin pump (22/1) 23
Tablets 14
Insulin and tablets 22
Other medical treatment 59
Blood pressure treatment 48
Lipid treatment 36
Anticoagulantia 36
Hemodialysis 1
Number of diabetes late complications 59
1 19
2 28
Over 50% of the patients had mild or moderate diabetic retinopathy. In 61% of the patients, treatment was planned for the worse-seeing eye (WSE) (Table 2).
The mean ETDRS score in the eye planned for treatment was 63.9 ± 13.2; it was 73.3 ± 12.8 in the eye for which no treatment was planned. Almost 30% of the patients had previously undergone treatment with panretinal laser photocoagulation in the eye planned for DME treatment. Over 60% of patients had previously received laser treatment for DME in the eye planned for treatment (Table 3).
3.3. Visual function (NEI VFQ-25) in the cohort with DME
With NEI VFQ-25, the subjects showed the lowest score for the subscale of general health (mean 35.65 ± 22.04) and the highest for dependency (mean 93.48 ± 18.12) (Table 4).
3.4. Self-reported health-related quality of life (SF-36) in the cohort with DME For SF-36, the subjects gave the lowest score in the subscale of general health (mean 56.55 ± 22.14) and the highest for the subscale of role emotional (mean 88.73 ± 22.32) (Table 4).
3.5. Subgroup analysis regarding visual functioning and health-related quality of life (NEI VFQ-25 and SF-36)
3.5.1. Degree of visual impairment
With the NEI VFQ-25, significant relationships were found between the degree of visual impairment and number of subscales (Table 5). Tukey’s post hoc tests demonstrated a significant difference between the participants with normal vision compared with participants that were moderate or severe in eight of the subscales.
For SF-36, ANOVA showed no significant differences in degree of visual impairment, level of retinopathy, or which eye was planned for treatment in any of the SF-36 domains (data not shown).
3.5.2. Planned treatment
Regarding which eye was planned for treatment, we found a significant relationship for NEI VFQ-25 and the subscales of general vision, social functioning, role difficulties, and driving. Table 5
indicates that the participants for whom treatment was planned for the better-seeing eye (BSE) rated significantly lower than participants in whom treatment was planned for the WSE (post-hoc Tukey). 3.5.3. Level of retinopathy
The level of retinopathy showed no significant relation to any of the NEI VFQ-25 subscales (data not shown).
3.6. Analysis of correlation between two objective measurements of visual acuity
The Spearman correlation between ETDRS and Snellen logMAR values showed a significant negative correlation (r = −0.98, p = 0.000). 4. Discussion
This study found that diabetic patients with visual impairment as a result of DME about to undergo anti-VEGF treatment had a very low score for the VFQ-25 subscale of general health. Although the majority of the patients also have undergone laser treatment, they scored low general health as pointed out in a previous study (Turkoglu et al., 2015).
In most of the VFQ-25 subscales, patients with moderate or severe visual impairment had lower scores than patients with normal vision. Furthermore, our results indicate that patients for whom treatment
Table 2
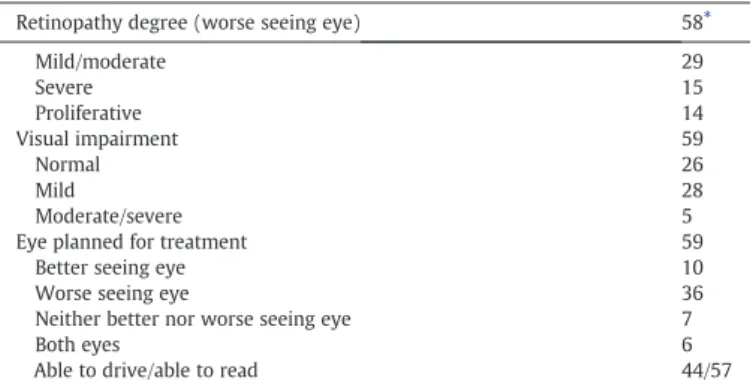
Eye history and eye planned for treatment.
Retinopathy degree (worse seeing eye) 58⁎
Mild/moderate 29 Severe 15 Proliferative 14 Visual impairment 59 Normal 26 Mild 28 Moderate/severe 5
Eye planned for treatment 59
Better seeing eye 10
Worse seeing eye 36
Neither better nor worse seeing eye 7
Both eyes 6
Able to drive/able to read 44/57
⁎ One patient was not possible to rate.
Table 3 Eye history.
Eye planned for treatment Eye not planned for treatment
Mean ± SD range N Mean ± SD range N
Visual acuity (ETDRS) 63.9 (±13.2) 21–84 65 73.3 (±12.8) 59–85 4
Visual acuity (logMar) 0.44 (±0.26) 0.05–1.30 65 0.26 (±0.35) 0–1.30 50
Central retinal thickness (OCT) 396 (±129) 183–836 61 277 (±61) 194–480 40 Preavious panretinal laser
photocoagulation 19 11
Preavious laser for DME 40 23
Irisrubeosis 1 0
Glaucoma 3 4
Previous cataract surgery 21 14
Table 4
Scores for each subscale of NEI VFQ-25 and SF-36.
Subscale Mean SD Range Missing
NEI VFQ-25 questionnaire General health 35.65 22.04 0–100 5 General vision 60.71 18.28 10–100 3 Ocular pain 84.21 20.80 25–100 2 Near activities 66.23 21.56 25–100 2 Distance activities 73.54 24.62 0–100 2 Social functioning 87.50 19.66 12.5–100 2 Mental health 76.54 20.87 0–100 2 Role difficulties 78.07 25.14 0–100 2 Dependency 93.48 18.12 0–100 4 Driving 72.02 37.02 0–100 17 Color vision 91.18 19.41 6–100 3 Peripheral vision 77.68 21.16 25–100 3 Composite score 78.12 16.72 18.60–97.61 2 SF-36 questionnaire Physical functioning 67.42 27.15 5–100 0 Role Physical 71.30 34.10 0–100 5 Bodily pain 70.16 29.55 0–100 2 General Health 56.55 22.14 5–97 2 Vitality 61.40 20.46 12.5–100 6 Social functioning 84.15 22.80 12.5–100 3 Role emotional 88.73 22.32 0–100 5 Mental health 77.45 17.11 30–100 2
Table 5
ANOVA and post hoc analysis for NEI VFQ-25 with regard to degree of visual impairment and planned treatment.
N Mean SD Tukey post hoc
Visual Impairment
General Health normal 25 40.00 22.82
mild 25 32.00 21.73
moderate/severe 4 31.25 23.94
Total 54 35.65 22.46
F-value, p-value 0.096, 0.411 ns
General Vision normal 25 66.4 18
mild 27 57.78 17.83
moderate/severe 4 45.00 10.00
Total 56 60.71 18.28
F-value, p-value 3.29, 0.045 ns
Ocular Pain normal 25 89.00 16.66
mild 28 82.14 22.93
moderate/severe 4 68.75 23.94
Total 57 84.21 20.80
F-value, p-value 1.972, 0.149 n
Near Activities normal 25 73.00 16.89
mild 28 63.69 22.48
moderate/severe 4 41.67 24.53
Total 57 66.23 21.57
F-value, p-value 4.53, 0.0015 0.016 normal
N moderate/severe
4.9652 57.7015
Distance Activities normal 25 82.67 15.62
mild 28 70.83 25.61
moderate/severe 4 35.42 27.53
Total 57 73.54 24.62
F-value, p-value 8.465, 0.001 0.001 normal
N moderate/severe
18.8604 75.6396
0.01 mild N moderate/severe
7.2376 63.5957
Social Functioning normal 24 96.35 11.35
mild 28 84.38 18.20
moderate/severe 4 56.25 33.07
Total 56 87.5 19.66
F-value, p-value 10.575, 0.000 0.036 normalN mild 0.6242 23.3341
0.000 normal N moderate/severe 18.0591 62.1493 0.008 mild N moderate/severe 6.306 49.944
Mental Health normal 25 79 22.81
mild 28 77.46 17.29
moderate/severe 4 54.69 24.14
Total 57 76.54 20.87
F-value, p-value 2.523, 0.09 ns
Role Difficulties normal 25 85.50 16.01
mild 28 78.13 23.48
moderate/severe 4 31.25 37.50
Total 57 78.07 25.14
F-value, p-value 10.851, 0.000 0.000 normal
N moderate/severe 26.1853 82.3147 0.000 mild N moderate/severe 19.0184 74.7316 Dependency normal 24 97.57 6.26 mild 27 92.90 17.10 moderate/severe 4 72.92 48.77 Total 55 93.48 18.12
F-value, p-value 3.496, 0.038 0.029 normal
N moderate/severe 2.0611 47.2444 Driving normal 20 88.75 9.85 mild 19 65.79 42.46 moderate/severe 3 0 0 Total 42 72.02 37.02
F-value, p-value 12.45, 0.000 0.000 normal
N moderate/severe 44.0199 133.4801 0.003 mild N moderate/severe 20.9061 110.6728 Color Vision 24 89.8333 22.22 22.22 28 95.5357 9.75 10.21 4 68.75 37.5 37.50 56 91.1786 19.41 19.85
F-value, p-value 3.779, 0.029 0.024 mild
N moderate/severe
2.9403 50.6311
Peripheral Vision normal 24 84.38 19.24
mild 28 76.79 24.47
Table 5 (continued)
N Mean SD Tukey post hoc
moderate/severe 4 43.75 23.94
Total 56 77.68 24.16
F-value, p-value 5.726, 0.006 0.004 normal
N moderate/severe
11.5639 69.6861
0.021 mild N moderate/severe
4.2727 61.7987
Composite score normal 25 83.95 11.76
mild 28 77.10 15.62
moderate/severe 4 48.93 24.71
Total 57 78.13 16.92
F-value, p-value 9.86, 0.000 0.000 normal
N moderate/severe 15.8844 54.1573 0.002 mild N moderate/severe 9.173 47.162 Planned treatment
General Health better seeing eye 9 36.11 18.16 worse seeing eye 34 36.03 24.76
neither 7 28.57 17.25
both eyes 4 43.75 12.50
Total 54 35.65 22.04
F-value, p-value 0.386, 0.763 ns
General Vision better seeing eye 9 46.67 20.00 worse seeing eye 34 64.71 17.10
neither 7 62.86 17.99
both eyes 6 56.67 15.06
Total 56 60.71 18.28
F-value, p-value 4.217, 0.010 0.004 BSEN WSE −35.4495 −.6290
Ocular Pain better seeing eye 10 73.75 26.65 worse seeing eye 34 84.56 20.19
neither 7 92.86 9.83
both eyes 6 89.58 20.03
Total 57 84.21 20.80
F-value, p-value 0.993, 0.404 Ns
Near Activities better seeing eye 10 55.83 19.27 worse seeing eye 34 70.59 21.15
neither 7 63.10 21.97
both eyes 6 62.50 25.14
Total 57 66.23 21.56
F-value, p-value 1.171, 0.330 ns
Distance Activities better seeing eye 10 65.00 26.29 worse seeing eye 34 80.02 20.94
neither 7 58.93 30.47
both eyes 6 68.06 27.72
Total 57 73.54 24.62
F-value, p-value 2.184, 0.101 ns
Social Functioning better seeing eye 10 76.25 23.16157 worse seeing eye 33 95.08 10.79795
neither 7 76.79 18.29813
both eyes 6 77.08 34.83592
Total 56 87.50 19.65613
F-value, p-value 4.809, 0.005 0.026 BSEN WSE 1.6895 35.9620
Mental Health better seeing eye 10 68.75 20.20 worse seeing eye 34 78.86 21.49
neither 7 81.25 11.41
both eyes 6 70.83 26.71
Total 57 76.54 20.87
F-value, p-value 0.759, 0.522 Ns
Role Difficulties better seeing eye 10 57.50 31.29 worse seeing eye 34 84.56 16.87
neither 7 83.93 18.70
both eyes 6 68.75 41.65
Total 57 78.07 25.15
F-value, p-value 4.191, 0.010 0.012 BSEN WSE −49.3697 −4.7480
Dependency better seeing eye 10 86.67 25.22 worse seeing eye 32 96.61 7.88
neither 7 97.61 6.30
both eyes 6 83.33 40.82
Total 55 93.48 18.12
F-value, p-value 1.686, 0.182 ns
Driving better seeing eye 7 55.36 51.97
worse seeing eye 24 88.54 10.37
neither 6 52.08 43.60094
both eyes 5 40.00 54.77226
Total 42 72.02 37.02026
F-value, p-value 5.352, 0.004 0.021 WSEN both 5.5951 91.4883
was planned for the BSE scored lower on general vision, social function, and role difficulties than patients for whom treatment was planned for the WSE. By contrast, no differences were found when the cohort was divided into subgroups according to level of retinopathy. This means that patients with visual impairment due to DME have reduced general health, but the diagnosis of DME or diabetes retinopathy in itself has no or a limited effect on general health. Regarding health-related quality of life measured using the SF-36, we found no differences when the sample was divided into subgroups according to degree of visual impairment, level of retinopathy, or treated eye. This indicates that the SF-36 may not be capable of capturing all relevant vision-related aspects of health-related quality of life.
In this study, we recruited patients from routine clinical care at two medium-sized county hospitals. Overall, the patient demographics, clinical characteristics, and visual functioning in the present clinical study were comparable with baseline characteristics in large pivotal clinical trials with ranibizumab for DME (Bressler et al., 2014; Mitchell et al., 2011). In the present study, we found a wide range in several baseline variables, such as age, glycosylated hemoglobin, weight, and blood pressure, which suggests heterogeneity among the included patients. Ourfindings appear to indicate that the diabetic population with DME in need of anti-VEGF treatment in the real-world setting is less homogeneous with regard to background characteristics than patients recruited in a clinical trial. The patient sample in the present study was relatively small. However, this study provides valuable information about patients offered treatment for DME in clinical settings.
The most unexpected result in this study was the low scoring on the NEI VFQ-25 subscale for general health—both from a clinical viewpoint and when compared with other similar studies (Trento et al., 2013; Turkoglu et al., 2015) as well as in those on patients with glaucoma (Kong, Zhu, Hong, & Sun, 2014) and patients diagnosed before the age of 30 years (Hirai et al., 2011). One possible explanation is that the majority of patients in our sample had at least one other diabetes-related complica-tion in addicomplica-tion to DME. It is well known that two or more diabetes-related late complications have an impact on general health (Heintz, 2012; Leksell et al., 2005; Rubin & Peyrot, 1999; Wikblad et al., 2014). In particular, neuropathy in combination with retinopathy may lead to a substantial negative impact on general health. In the present study, respondents reported that they had sensory loss, which is suggestive of neuropathy in the hands or feet. However, one weakness with this study is the lack of a control group, which does not allow a direct comparison with a comparable patient cohort or sample.
VFQ-25 analysis showed that there was a relationship with visual impairment in most of the subscales. It seems reasonable to suppose that visual impairment affected those subscales. This is confirmation of the fact that from the patient’s perspective, vision has a huge impact on daily life. Furthermore, the particular eye treated played an especially significant role for general vision, social functioning, role difficulties, and driving. For
the majority of patients in our sample, treatment was planned for the BSE with visual impairment. The third subgroup analysis on level of retinopathy found no differences among any of the subscales in the NEI VFQ-25. This indicates that the diagnosis of diabetes retinopathy in itself has no or a limited effect on a patient’s reported outcome in terms of visual functioning.
Heintz et al. (2012)arrived at similar results in their thesis. For that reason, it is important that patients regularly undergo fundus photography because even severe retinopathy can occur without symptoms.
Our analysis of the two different objective methods for measuring visual acuity– the ETDRS and Snellen charts – showed a strong correlation. Measurement of visual acuity according to the ETDRS gives an accurate value, especially if visual acuity is reduced (Falkenstein et al., 2008), but it is more time consuming than standard acuity testing using the Snellen chart. In real-world settings, as was the case in the present study, the ETDRS chart is generally preferable for diagnosis and follow-up of the eyes subject to anti-VEGF treatment.
In conclusion, this study found that patients with diabetes who were going to undergo anti-VEGF treatment for visual impairment due to DME gave a low rating for their general health as measured with the visual function-specific NEI VFQ-25. It is important to increase the awareness of this finding among healthcare professionals dealing with this group of patients. This study has relatively small sample size due to the number of patients that received the treatment. But the value of the study is that it is implemented in real-world settings, and the results of the study can therefore be generalized for the group of Swedish patients with diabetes about to undergo anti-VEGF treatment for sight-threatening DME.
More research is needed to examine the underlying reasons for this low score in general health. It is crucial to increase our understanding of the underlying mechanisms so as to promote improvements in the treatment of this group of patients. Further, it is now important to follow patient cohorts or samples while on treatment to monitor potential changes in SF-36 and VFQ-25 scores induced by anti-VEGF treatment for DME. Acknowledgments
The authors thank Professor Anders Heijl for providing the NEI VFQ-25 translation into Swedish. We thank Björn Zethelius, MD PhD and Kerstin Wickström, PhD for valuable discussions, Camilla Söderberg for study administration support and Philippe Wagner for statistical advice. Financial support was provided from the Regional Research Council in the Uppsala/Örebro region, Magnus Bergvalls Foundation, and Synskadades Vänner in Uppsala. We also want to thank National Diabetes Register (NDR).
References
Beck, R. W., Edwards, A. R., Aiello, L. P., Bressler, N. M., Ferris, F., Glassman, A. R., ... Diabetic Retinopathy Clinical, R (2009).Three-year follow-up of a randomized trial Table 5 (continued)
N Mean SD Tukey post hoc
worse seeing eye 33 91.85 19.58
neither 7 92.86 12.20
both eyes 6 87.50 30.62
Total 56 91.18 19.41
F-value, p-value 0.162, 0.921 ns
Peripheral Vision better seeing eye 10 67.50 31.30 worse seeing eye 33 81.82 20.03
neither 7 71.43 26.73
both eyes 6 79.17 29.23
Total 56 77.68 24.16
F-value, p-value 0.806, 0.497 ns
Composite Score better seeing eye 10 68.20 19.87 worse seeing eye 34 82.56 12.30
neither 7 76.17 16.75
both eyes 6 71.82 27.85
Total 57 78.13 16.92
comparing focal/grid photocoagulation and intravitreal triamcinolone for diabetic macular edema. Archives of Ophthalmology, 127(3), 245–251.
Bourne, R. R. A., Jonas, J. B., Flaxman, S. R., Keeffe, J., Leasher, J., Naidoo, K., ... Global Burden Dis, S (2014). Prevalence and causes of vision loss in high-income countries and in Eastern and Central Europe: 1990–2010. British Journal of Ophthalmology, 98(5), 629–638.http://dx.doi.org/10.1136/bjophthalmol-2013-304033. Bressler, N. M., Varma, R., Suñer, I. J., Dolan, C. M., Ward, J., Ehrlich, J. S., ... Turpcu, A.
(2014). Vision-related function after ranibizumab treatment for diabetic macular edema: Results from RIDE and RISE. Ophthalmology, 121(12), 2461–2472.http://dx. doi.org/10.1016/j.ophtha.2014.07.008.
DDCT and EDIC: The Diabetes Control and Complications Trial and Follow-up Study. U.S. Department of Health and Human Services National Institutes of Health NIH Publication No 08-3874 May 2008.
Denniston, A. K., Kyte, D., Calvert, M., & Burr, J. M. (2014). An introduction to patient-reported outcome measures in ophthalmic research. Eye, 28(6), 637–645.http://dx. doi.org/10.1038/eye.2014.41.
Do, D. V., Nguyen, Q. D., Boyer, D., & Schmidt-Erfurth, U. (2012). One-year outcomes of the da Vinci Study of VEGF Trap-Eye in eyes with diabetic macular edema. Ophthalmology (Rochester, Minnesota), 119(8), 1658–1665.http://dx.doi.org/10. 1016/j.ophtha.2012.02.010.
Elman, M. J., Elman, M. J., Aiello, L. P., Beck, R. W., & Bressler, N. M. (2010). Randomized trial evaluating ranibizumab plus prompt or deferred laser or triamcinolone plus prompt laser for diabetic macular edema. Ophthalmology (Rochester, Minnesota), 117(6), 1064–1077.e1035.http://dx.doi.org/10.1016/j.ophtha.2010.02.031. Eriksson, K., Sjöstrand, J., & Kroksmark, U. (2008).Difficult to decide when an eye
disease is a disability. Patient's assessment of the visual function a good support for the physician's assessment. Läkartidningen, 105(24-25), 1855–1858.
Falkenstein, I. A., Cochran, D. E., Azen, S. P., Dustin, L., Tammewar, A. M., Kozak, I., & Freeman, W. R. (2008). Comparison of visual acuity in macular degeneration patients measured with Snellen and Early Treatment Diabetic Retinopathy study charts. Ophthalmology, 115(2), 319–323.http://dx.doi.org/10.1016/j.ophtha.2007. 05.028.
Gonder, J. R., Walker, V. M., Barbeau, M., Zaour, N., Zachau, B. H., Hartje, J. R., & Li, R. H. (2014). Costs and quality of life in diabetic macular edema: Canadian Burden of Diabetic Macular Edema Observational Study (C-REALITY). Journal of Ophthalmologyhttp://dx.doi.org/10.1155/2014/939315.
Heintz, E. (2012). Health economic aspects of diabetic retinopathy. Linköping: Department of Medical and Health Sciences, Linköping University.
Heintz, E., Wirehn, A. B., Peebo, B. B., Rosenqvist, U., & Levin, L. A. (2012). QALY weights for diabetic retinopathy—A comparison of health state valuations with HUI-3, EQ-5D, EQ-VAS, and TTO. Value in Health, 15(3), 475–484.http://dx.doi.org/10.1016/j. jval.2011.11.031.
Hirai, F. E., Knudtson, M. D., Klein, B. E. K., & Klein, R. (2008). Clinically significant macular edema and survival in type 1 and type 2 diabetes. American Journal of Ophthalmology, 145(4), 700–706.http://dx.doi.org/10.1016/j.ajo.2007.11.019. Hirai, F. E., Tielsch, J. M., Klein, B. E. K., & Klein, R. (2011). Ten-year change in
vision-related quality of life in type 1 diabetes: Wisconsin epidemiologic study of diabetic retinopathy. Ophthalmology, 118(2), 353–358.http://dx.doi.org/10.1016/j.ophtha. 2010.06.022.
Holladay, J. T. (1997).Proper method for calculating average visual acuity. Journal of Refractive Surgery, 13(4), 388–391.
International Diabetes Federation (d). Complications of diabetes.http://www.idf.org/ complications-diabetes
Janzen Claude, J. A., Hadjistavropoulos, H. D., & Friesen, L. (2014). Exploration of health anxiety among individuals with diabetes: Prevalence and implications. Journal of Health Psychology, 19(2), 312–322.http://dx.doi.org/10.1177/1359105312470157.
Klein, R., Moss, S. E., Klein, B. K., Gutierrez, P., & Mangione, C. M. (2001). The NEI-VFQ-25 in people with long-term type 1 diabetes mellitus: The Wisconsin epidemiologic study of diabetic retinopathy. Archives of Ophthalmology, 119(5), 733–740.http:// dx.doi.org/10.1001/archopht.119.5.733.
Kong, X. M., Zhu, W. Q., Hong, J. X., & Sun, X. H. (2014). Is glaucoma comprehension associated with psychological disturbance and vision-related quality of life for patients with glaucoma? A cross-sectional study. BMJ Open, 4(5)http://dx.doi.org/ 10.1136/bmjopen-2013-004632.
Korobelnik, J. F., Do, D. V., Schmidt-Erfurth, U., Boyer, D. S., Holz, F. G., Heier, J. S., ... Brown, D. M. (2014). Intravitreal aflibercept for diabetic macular edema. Ophthalmology, 121(11), 2247–2254.http://dx.doi.org/10.1016/j.ophtha.2014.05.006.
Leksell, J., Wikblad, K., & Sandberg, G. (2005).Self-perceived health and self-care among diabetic subjects with defective vision. Journal of Diabetes and its Complications, 19(1), 54–59.
Lilja, M., Jansson, S., Alvarsson, M., Aldrimer, M., Nordin, G., & Attvall, S. (2013).HbA1c will complement other methods in the diagnosis of diabetes. Coordinated introduction in Sweden in January 2014. Läkartidningen, 110(49-50), 2246–2248. Lutty, G. A. (2013). Effects of diabetes on the eye. Investigative Ophthalmology & Visual
Science, 54(14), 7.http://dx.doi.org/10.1167/iovs.13-12979.
Mangione, C. M. (2000).The National Eye Institute 25-Item Visual Function Questionnaire (VFQ-25)— Version 2000.
Mangione, C. M., Lee, P. P., Gutierrez, P. R., Spritzer, K., Berry, S., & Hays, R. D. (2001). Development of the 25-item National Eye Institute Visual Function Questionnaire. Archives of Ophthalmology, 119(7), 1050–1058.
Mangione, C. M., Lee, P. P., Pitts, J., Gutierrez, P., Berry, S., Hays, R. D., & Investigators, N. V. F. T. (1998).Psychometric properties of the National Eye Institute Visual Function Questionnaire (NEI-VFQ). Archives of Ophthalmology, 116(11), 1496–1504.
Maruish, M. E. E. (2011).User's manual for the SF-36v2 Health Survey (3rd ed.). Lincoln, RI: QualityMetric Incorporated.
Massin, P., Bandello, F., Garweg, J. G., Hansen, L. L., Harding, S. P., Larsen, M., ... Wolf, S. (2010). Safety and efficacy of ranibizumab in diabetic macular edema (RESOLVE Study). Diabetes Care, 33(11), 2399–2405.http://dx.doi.org/10.2337/dc10-0493. Mitchell, P., Bandello, F., Schmidt-Erfurth, U., Lang, G. E., Massin, P., Schlingemann, R. O., ... Grp,
R. S. (2011). The RESTORE study: Ranibizumab monotherapy or combined with laser versus laser monotherapy for diabetic macular edema. Ophthalmology, 118(4), 615–625. http://dx.doi.org/10.1016/j.ophtha.2011.01.031.
Mitchell, P., Bressler, N., Tolley, K., et al. (2013). Patient-reported visual function outcomes improve after ranibizumab treatment in patients with vision impairment due to diabetic macular edema: Randomized clinical trial. JAMA Ophthalmology, 131(10), 1339–1347.http://dx.doi.org/10.1001/jamaophthalmol.2013.4592. Nguyen, Q. D., Brown, D. M., Marcus, D. M., Boyer, D. S., Patel, S., Feiner, L., ... Ehrlich, J. S.
(2012). Ranibizumab for diabetic macular edema: Results from 2 phase III randomized trials: RISE and RIDE. Ophthalmology, 119(4), 789–801.http://dx.doi. org/10.1016/j.ophtha.2011.12.039.
Photocoagulation for diabetic macular edema: Early Treatment Diabetic Retinopathy study report number 1. Early Treatment Diabetic Retinopathy study research group. Archives of Ophthalmology, 103(12)(1985)., 1796–1806.http://dx.doi.org/ 10.1001/archopht.1985.01050120030015.
Raymond, N. T., Varadhan, L., Reynold, D. R., Bush, K., Sankaranarayanan, S., Bellary, S., ... Group, U. K. A. D. S. R. S. (2009). Higher prevalence of retinopathy in diabetic patients of South Asian ethnicity compared with white Europeans in the community: A cross-sectional study. Diabetes Care, 32(3), 410–415.http://dx.doi. org/10.2337/dc08-1422.
Rubin, R. R., & Peyrot, M. (1999). Quality of life and diabetes. Diabetes/Metabolism Research and Reviews, 15(3), 205–218. http://dx.doi.org/10.1002/(sici)1520-7560(199905/06)15:3b205::aid-dmrr29N3.0.co;2-o.
Stratton, I. M., Kohner, E. M., Aldington, S. J., & Turner, R. C. (2001). UKPDS 50: Risk factors for incidence and progression of retinopathy in type II diabetes over 6 years from diagnosis. Diabetologia, 44(2), 156–163. http://dx.doi.org/10.1007/ s001250051594.
Sullivan, M., Karlsson, J., & Ware, J. E. (1995). The Swedish SF-36 Health Survey 1. Evaluation of data quality, scaling assumptions, reliability and construct-validity across general populations in Sweden. Social Science & Medicine, 41(10), 1349–1358.http://dx.doi.org/10.1016/0277-9536(95)00125-q.
Trento, M., Passera, P., Trevisan, M., Schellino, F., Sitia, E., Albani, S., ... Porta, M. (2013). Quality of life, impaired vision and social role in people with diabetes: A multicenter observational study. Acta Diabetologica, 50(6), 873–877.http://dx. doi.org/10.1007/s00592-013-0470-1.
Tsilimbaris, M. K., Kontadakis, G. A., Tsika, C., Papageorgiou, D., & Charoniti, M. (2013). Effect of panretinal photocoagulation treatment on vision-related quality of life patients with proliferative diabetic retinopathy. Retina: the Journal of Retinal and Vitreous Diseases, 33(4), 756–761.http://dx.doi.org/10.1097/IAE.0b013e31826b0c06.
Turkoglu, E. B., Celık, E., Aksoy, N., Bursalı, O., Ucak, T., & Alagoz, G. (2015). Changes in vision related quality of life in patients with diabetic macular edema: Ranibizumab or laser treatment? Journal of Diabetes and its Complications, 29(4), 540–543.http:// dx.doi.org/10.1016/j.jdiacomp.2015.03.009.
UK Prospective Diabetes Study (UKPDS) (1991). Diabetologia, 34(12), 877–890.http:// dx.doi.org/10.1007/BF00400195.
Varma, R., Bressler, N. M., Doan, Q. V., Gleeson, M., Danese, M., Bower, J. K., ... Turpcu, A. (2014). Prevalence of and risk factors for diabetic macular edema in the United States. JAMA Ophthalmology, 132(11), 1334–1340. http://dx.doi.org/10.1001/ jamaophthalmol.2014.2854.
Ware, J., & Sherbourne, C. (1992).The MOS 36-item short-form health survey (SF-36). I. Conceptual framework and item selection. Medical Care, 30, 473–483.
Weldring, T., & Smith, S. M. S. (2013). Patient-reported outcomes (PROs) and patient-reported outcome measures (PROMs). Health Services Insights, 6, 61–68.http://dx. doi.org/10.4137/HSI.S11093.
Wikblad, K., Smide, B., & Leksell, J. (2014).Check your health validity and reliability of a measure of health and burden of diabetes. Scandinavian Journal of Caring Sciences, 28(1), 139–145.
Wilkinson, C. P., Ferris Iii, F. L., Klein, R. E., Lee, P. P., Agardh, C. D., Davis, M., ... Verdaguer, J. T. (2003). Proposed international clinical diabetic retinopathy and diabetic macular edema disease severity scales. Ophthalmology, 110(9), 1677–1682.http:// dx.doi.org/10.1016/S0161-6420(03)00475-5.