This is the peer-reviewed but non-final version of an article published in final form in Quality Management in Health Care, vol. 22, no 2 (2013) p. 152–160.
http://dx.doi.org/10.1097/QMH.0b013e31828bc276 (Access to the published version may require subscription)
Managers’ views and experiences of a large-scale county council
improvement program: limitations and opportunities
Abstract
The aim of this study was to explore and evaluate managers´ views of a large-scale improvement program, including their experiences and opinions about improvement initiatives and drivers for change. The study is based on a survey used in two nationwide mappings of improvement initiatives and developmental trends in Swedish healthcare. The participants were all managers in a county council in Sweden. Data was analyzed descriptively, and statements were ranked in order of preferences. A majority of the respondents stated that they had worked with improvements since the county council improvement program started. The managers sometimes found it difficult to find data and measurements that supported the improvements, yet a majority considered that it was worth the effort and that the improvement work yielded results. The top-ranked driving forces were ideas from personnel and problems in the daily work. Staff satisfaction was ranked highest of the improvement potentials, but issues about patients’ experiences of their care and patient safety came second and third. The managers stated that no or only a few patients had been involved in their improvement initiatives. Large-scale county council improvement initiatives can illuminate quality problems and lead to increased interest in improvement initiatives in the healthcare sector.
Keywords
Introduction
Quality improvement and quality management have become important concepts within healthcare in recent decades. Due to the increased possibilities of medical care and, at the same time, reduced financial resources, the healthcare system must improve its quality, and become more effective and cost-efficient [1]. The management and ownership of change and improvement initiatives are important, and researchers have stressed the importance of managers’ support to achieve successful improvements [2, 3]. Managers are the ones responsible for realizing large-scale improvement initiatives, and for that reason it is essential to understand their experiences of the limitations and opportunities they encounter when planning and executing such initiatives. This study aims to increase the understanding of managers’ experiences and opinions of a large-scale improvement initiative within the Swedish healthcare sector. It is important to evaluate these large-scale improvement programs, including their limitations and opportunities, to make clear if and how those initiatives could be successful and worth the invested time and money. At the same time this will give top managers and (county council) representatives’ important facts to use in making decisions about those quality improvement initiatives.
Quality Management in healthcare
Quality management in healthcare began to grow in the United States some decades ago, inspired and adapted from the manufacturing industry [4]. A frequently used model was Total Quality Management (TQM), which is a management strategy connected with continuous improvement processes [5]. TQM stresses the importance of high-quality management [3]. Another management strategy in healthcare is Lean production, adapted to Lean healthcare. The main areas in Lean healthcare are patient processes and personnel teams working with continuous improvements as a part of their daily work. The purpose is to achieve higher value
for the customers (the patients), and to reduce waste [6, 4]. Some researchers describe a modern organisation as an organization with an ambition to develop, to become more effective, to streamline processes, and to exceed customers’ expectations. In public organisations, this model is called New Public Management (NPM) [7]. Managers are seen to be supportive or coaching, and their duty is to create conditions for their co-workers’ learning, improvement initiatives and problem solutions. Another “phenomenon” discussed in leadership is Evidence-Based Management (EBM) [8]. Rousseau [8] describes EBM as adapting best evidence principles into daily work situations. This can be compared with Evidence-Based Medicine or Evidence-Based Practice, which aim to reduce the gap between research knowledge and practice experience [9]. To be able to practice Evidence-Based Management, managers need facts and data (measurements) on which to base their decisions [8].
Leadership is an important part of quality improvement initiatives [10], although opinions differ among researchers as to what role management is supposed to play. Conger [11] argues that only top management can run large-scale improvement projects, due to their overall point of view. Beer [3] agrees that top management teams must support improvement initiatives. However, top-down governing should be avoided; instead the top management team should set good examples and motivate participation amongst both lower level managers and other staff members. Organisational change is a process going on unit by unit, staff member by staff member, not a top-down implementation process [3].
The survey on which the present study is based was developed and used in two nationwide mappings of improvement initiatives and developmental trends in Swedish healthcare [12-15]. Comparing the two measurements, the trend exhibits an increased external pressure to
pursue improvements [15]. The most common drivers for improvements were daily work issues, staff-initiated ideas and medical innovations. Managers stated that most resources for improvement were put into administrative routines. Least common were access problems and patient pressure, needs, and complaints. A study analyzing which improvement projects employees initialize within a large-scale county council improvement program found five types of improvement projects [16]. The most common projects concerned improvements and processes in the employee’s own organisation, and least common were projects directly influencing the patients. The projects represent the problems with direct impact on the healthcare professionals’ daily work, and therefore the majority of the projects focused on the organizational perspective. This does not imply that patients’ needs and expectations were forgotten, just treated secondarily.
The county council improvement program
The ongoing large-scale improvement program was initiated in 2007 by the county council, which granted SEK 30 million to improvement initiatives. The program is driven both top-down, encouraging managers to support and demand improvements, and bottom-up, through improvement programs offering methodology support to teams. County council employees are encouraged to participate in different activities and trainings to spread the improvement knowledge and methodology in the organization. There are special courses offered for managers, such as “Management for Improvement in Healthcare”, given by the county council in collaboration with Linné University, and a “Green Card” course in management skills, including theoretical and practical methodologies and methods for leading quality improvement initiatives. Special manager days are arranged once a year, to which all managers are invited. On those days managers get information and opportunities to collaborate with other managers and with top management on improvement issues. All managers throughout the county council are encouraged to initiate and demand improvement
efforts. Therefore, the aim of the present study is to explore and evaluate managers’ views of a large-scale improvement program; experiences and opinions about improvement initiatives and drivers; and limitations and opportunities.
Material and method
The present study used a modified version of a survey originally developed to measure improvement work in Swedish healthcare sector at a national level [13, 15]. The survey is built on a model to predict outcomes of changes in organisations and validated through an expert panel and as a pilot study in one county council in the north of Sweden [12]. The survey was then sent out to all managers in Somatic Specialist Care and Primary Care in Sweden. It has been used twice, in 2003 and 2007, and was slightly adjusted between those occasions [15].
In this study, the survey was somewhat adjusted, questions about personnel sick leave and questions concerning national initiatives were removed, and an open-ended question was added, encouraging writing free comments. Questions were answered from “Absolutely yes” to “Absolutely no”, with the alternative “Do not know” also possible. Statements were ranked on a five-point scale, from “Not at all” to “To a very large extent” or “Completely”. Some statements had a “Do not know” alternative. The survey was entered into the web-based survey program esMaker NX2. All questions and statements, except the open-ended question and one question about physician participation, were mandatory; it was not possible to continue without answering them. The study was approved by the Regional Ethical Review Board in Linköping, Sweden (Dnr 2011/119-31), and conducted according to general ethical standards.
Data analysis
Data was analyzed descriptively and is presented in both actual frequencies and as percentages, mean values and standard deviation (SD). Statements were ranked in order of preferences. Mean values are presented together with the ranking, mean above 2 is regarded positive (agree or important) and below 2 is negative (do not agree or not that important).
Responses and Drop out analysis
All personnel listed as managers, from the county council director, heads of administrations and division managers to unit and first-line managers, and belonging to the healthcare core administrations Somatic Specialist Care, Primary Care, Psychiatric Special Care and Dental Care in the county council personnel register (n=333) received the survey by e-mail, together with an information letter. The register was found to not be fully up to date. Of the 333 surveys sent out, 13 were returned due to retirements, the person had left the position, or was on long-term (maternity) leave. At the same time one manager that had recently taken the position was found and included. The real number of possible participants was found to be n=321. The overall response rate was 47.3%, n=152. The distribution is shown in Table 1. Some participants stated as a comment that they had just recently left their manager position, but due to the fact that they had been managers during the period of the ongoing county council improvement program, they were included in the analysis.
Placement of table 1
A qualitative drop out analysis was conducted. Possible participants from the list were randomly contacted by telephone, and if they had not participated, were asked for the reason why not. Ten non-respondents were interviewed. The stated reasons were: did not participate
in any activity and therefore did not think the survey was for them; did not have time to answer; forgot about the survey; or no longer had a manager position.
Results
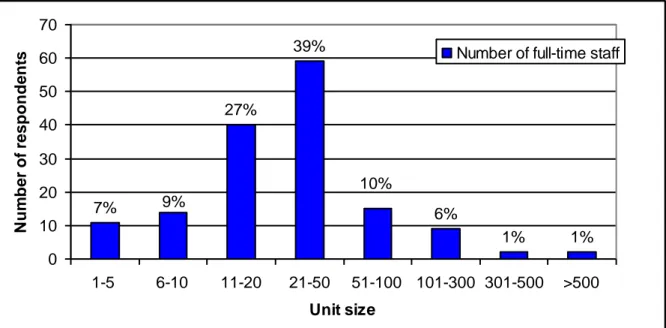
Of the total 152 responding participants 80% (n=122) were managers, 4% (n=6) assistant managers and 16% (n=24) others, having leading positions without personnel or economic responsibilities. The respondents have worked in their manager position from under one year to 25 years, mean 6.5 years (SD 5.9). A majority, 72% (n=110) were women. The size of units a participant was managing ranges from 1-5 employees to more than 500 employees, although the most common was between 21 and 50 employees (Figure 1).
Placement of figure 1
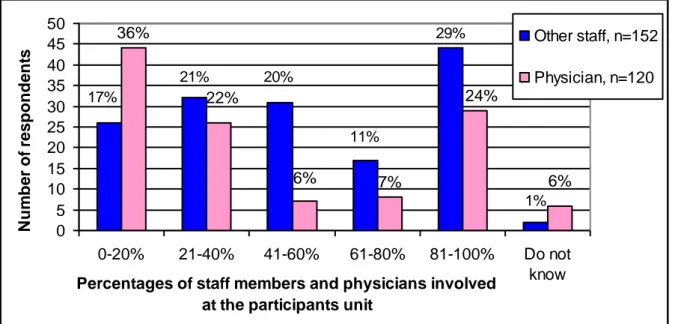
Of the respondents 92% (n=140) stated that they had worked with improvements since the county council improvement program started in 2007. The percentages of staff members and physicians involved in the improvement work at the participants unit are shown in Figure 2. The managers whose units have no physicians were requested not to answer the question, therefore the answer rates differ (other staff n=152, physician n=120).
Placement of figure 2
The question about the number of patients that had been involved in the improvement work was answered by 5.3% (n=8) of the participants “All patients”, 9.2% (n=14) “Most patients”, 41.4% (n=63) “Some patients”, 38.8% (n=59) “No patients” and 5.3% (n=8) “Do not know”. To the question of whether it is easy to find data and measurements of improvement work concerning their own unit, 15.1% (n=23) of all participants answered “Absolutely yes”,
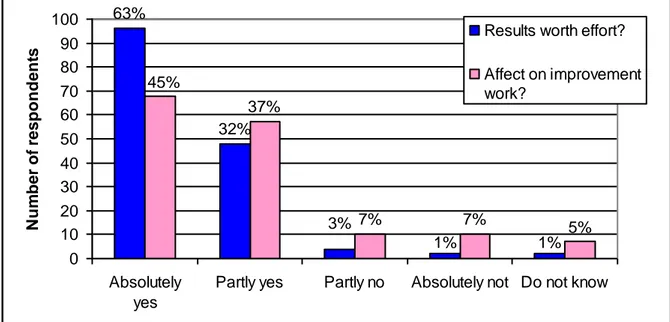
43.4% (n=66) “Partly yes”, 21.1% (n=32) “Partly no”, 13.2% (n=20) “Absolutely no” and 7.2% (n=11) “Do not know”. The answers to the overall question of whether the results have been worth the effort are shown in Figure 3, together with the question of whether the county council improvement program has affected the improvement work at the unit.
Placement of figure 3
The statements about driving forces and managers’ opinions are presented in order of preferences; mean values and SD are shown. Mean values above 2 are regarded as positive (agree or important) and below 2 as negative (do not agree or not that important). The manager’s general opinion regarding improvement work showed that improvements are something positive (Table 2). Lowest ranked was the statement that improvements conflict with professional positions.
Placement of table 2
Driving forces for the improvement work are shown in Table 3. On top are statements about ideas from personnel and daily work not functioning optimally. Patients’ needs and complaints came in at fourth place, followed by access and patient safety problems. Last were issues about increasing market share and political decisions.
Table 4 shows which characteristics reflect the improvement work. Goals are considered to be developed in dialogue with leaders gets the highest rank, while risk taking and learning from mistakes get the bottom placement.
Placement of table 4
Statements about which aspects were affected by the improvement work are shown in Table 5. Those statements were followed by the question of whether the respondents have data (measurements) that confirm results. The respondents thought that staff satisfaction and internal processes were affected most. Few of the participants stated that they had data confirming their improvement results.
Placement of table 5
Concerning improvement potentials, staff satisfaction was ranked highest, followed by patient experiences and patient safety. The economy was stated as having least improvement potential (Table 6).
Placement of table 6
Discussion
This study is a part of an ongoing evaluation of the county council large-scale improvement program. The vision of this program stated that all managers should demand and encourage improvement work. This vision has been communicated in the organization since the beginning of the program in 2007. Therefore, all managers within the county council should
be aware and at least somewhat affected. The response rate of this survey was only 47%. This is remarkable; one would think that they should have felt some obligation to answer, or at least see this survey as an opportunity to communicate their opinions and experiences. The drop-out analysis indicates some possible answers, such as not having participated in any activities, not having a manager position anymore, or simply forgetting or thinking they do not have time to answer. This indicates that it is not only those who are positive to the improvement effort who have answered, which you might think otherwise, seeing that 92% stated that they had worked with improvements since the improvement program was initiated and to the question of whether the results were worth the effort almost all participants answered absolutely or partly yes.
The highest ranked driving forces were “Good ideas from employees” and “Daily work does not function optimally”. This corresponds to the original national measurements. The driver “daily work does not function optimally” significantly increased and “good ideas from employees” significantly decreased, although they were in the first and second position both in 2003 and 2007 [15]. Their result also corresponds to the findings of improvement projects initiated by employees [16]. The most frequent projects concerned problems that healthcare professionals face in their day-to-day work, and that affect the organisation in some way. Financial problems, financial support and increasing market share were ranked in the bottom. This indicates that Swedish healthcare in general is not used to competing. The decreasing resources and implementation of private care should make it necessary to change this view. That is why quality improvements can be seen as one way to “produce more for less” [1].
The participating managers almost all agreed about the statements that improvement initiatives are positive and shows results, but only few have data that confirms that. Compared
to the original national studies, the same pattern is shown: 90% of the respondents stated that they have no measurements that confirm their results [13]. Still, 23% thought that the improvement initiatives had positively affected their financial outcome. In our study more than half of the respondents thought there was no effect on finances. In the study by Book et al. [14] an argument was that perhaps finances were not a primary goal with the quality improvement initiatives, other goals and driving forces may be as or even more adequate.
Another issue is the statements that the improvement initiatives meet needs and yield results. How do the managers know that, if no measurements to prove it exist? Those findings also correspond to the original national measurements, ranked as second and fourth in 2003 [13], and show no significant changes until the 2007 measurement [15]. This connects to the question “Do you think the results were worth the efforts?”, which was considered by almost all as “Yes”. Here too one could expect the necessity of some evidence (data and measurements) to answer. Rousseau [8] argues that a problem in practicing Evidence-Based Management (EBM) is that managers lack available information that can support them in their decisions. How are managers supposed to stimulate and encourage improvement initiatives if they do not have or cannot find any evidence that the work is useful? The question of whether it is easy to find data related to the unit was answered by most (42.9%) as partly yes, but at the same time 8% did not know. To use measurements and data as a way to guide improvements in healthcare presupposes that it is easy for the managers to find and compare data.
An issue of immediate importance in healthcare is patient safety, and one way to improve that is to work with quality improvement [9]. A study analysing the improvement work in connection to patient safety found that less than half of the managers stated that patient claims
and problems had driven their improvement initiatives [17]. Pukk et al. [17] stated that managers were not aware of the safety problems at their unit. There was also a large discrepancy between how the managers estimated their performance and achievements that concerned increased patient safety and the extent to which they had worked with risks and incidents. In our study patient safety came quite high on the rank list, but this is self-estimated data from the managers, not compared to any incident reports like the study by Pukk et al. [17]. At the same time, patent safety, patient needs and experiences are ranked high on the improvement potential list, indicating that the managers are aware of the problems and that this topic is in focus right now. Another question was about patient involvement in quality improvement initiatives. Most managers stated that some or no patients were actively involved. This indicates that healthcare managers are not used to involving patients and/or have not realized the benefits that can be obtained from patients’ experiences and improvement ideas. A study that looked at managers’ opinions about how to involve patients in the county council improvement initiatives found that interest and willingness is high but experiences in how to make patients active participants are lacking [18].
Conclusions
The county council managers consider improvement initiatives to be positive and to yield results. The strongest driving forces are practice-based ideas from employees and problems in the daily work situation. However, large-scale improvement programs can illuminate and influence quality problems and result in increased interest in improvement initiatives, even if the managers themselves do not consider those aspects to be strong driving forces in their daily work.
References
1. Anell A. Swedish healthcare under pressure. Health Economics. 2005;14:S237–S254. Published online in Wiley InterScience (www.interscience.wiley.com).
DOI:10.1002/hec.1039.
2. Brulin G, Svensson L. Att äga, styra och utvärdera stora projekt (in Swedish). Lund: Studentlitteratur; 2011.
3. Beer M. Why Total Quality Management Programs Do Not Persist: The Role of Management Quality and Implications for Leading a TQM Transformation. Decision Sciences. 2003;34(4):623-642.
4. Weinstock D. Lean Healthcare. Journal of Medical Practice Management. 2008;May/June:339-341.
5. Claus LM. Total quality management: a healthcare application. Total Quality Management. 1991;2(2):131-148.
6. Waring JJ, Bishop S. Lean healthcare: Rhetoric, ritual and resistance. Social Science & Medicine. 2010;71:1332-1340.
7. Ellström P-E, Kock H. Mot ett förändrat ledarskap? Om chefers arbete i team- och processorienterad verksamhet (in Swedish). Lund: Studentlitteratur; 2009.
8. Rousseau DM. Is there such a thing as “Evidence-Based Management”? Academy of Management Review. 2006;31(2):256-269.
9. Grol R. Improving the Quality of Medical Care: Building Bridges Among Professional Pride, Payer Profit, and Patient Satisfaction. JAMA. 2001;286(20):2578-2585.
10. Kammerlind P, Dahlgaard JJ, Rutberg H. Leadership for Improvements in Swedish Health Care. Total Quality Management. 2004;15(4):495-509.
11. Conger JA. Effective Change Begins at the Top. In: Breaking the Code of Change. Beer M, Nohria N. (ed.) Cambridge, MA: Harvard Business School Press; 2000.
12. Olsson JA, Øvretveit J, Kammerlind P. Developing and Testing a Model to Predict Outcomes of Organizational Change. Quality Management in Health Care.
2003;12(4):240-249.
13. Olsson J, Kammerlind P, Thor J, Elg M. Surveying Improvement Activities in Health Car on a National Level – The Swedish Internal Collaborative Strategy and Its Challenges. Quality Management in Health Care. 2003;12(4):202-216.
14. Book S, Hellström A, Olsson J. Perceptions of Improvement work in Swedish Health Care: Implications for Improvement Practices. Quality Management in Health Care. 2003;12(4):217-224.
15. Elg M, Stenberg J, Kammerlind P, Tullberg S, Olsson J. Swedish healthcare management practices and quality improvement work: development trends. International Journal of Health Care Quality Assurance. 2011;24(2):101-123.
16. Andersson A-C, Elg M, Idvall E, Perseius K-I. Five Types of Practice-Based
Improvement Ideas in Health Care Services: An Empirically Defined Typology. Quality Management in Health Care. 2011;20(2):122-130.
17. Pukk K, Lundberg J, Gaffney A, Penaloza-Pesantes RV, Olsson J. Do Health Care Managers Know the Comparative Quality of Their Care? Quality Management in Health Care. 2003;12(4):232-239.
18. Andersson A-C, Olheden A. Patient participation in Quality Improvement: Managers’ opinions of patients as resources. (in progress).
Tables and figures
Table 1
Participant distribution and response rates
Administration Sent out Actual to be sent out
Response (% response)
Somatic Specialist Care 249 238 113 (35.2)
Primary Care 32 33 13 (4.0)
Psychiatric Special Care 33 31 16 (5.0)
Dental Care 19 19 10 (3.1)
Table 2
“To what extent do you think that the following statements agree with general opinion regarding improvement work in your organizational unit?”
Statement, Rank order Mean value *
(n=152)
SD
Improvement work is something positive 3.5 0.6
Improvement work is consistent with our norms and values 3.0 0.8 Improvement work meets current needs in our operations 3.0 0.8
Improvement work yields distinct results 2.8 0.8
Improvement work conflicts with our daily work tasks 1.7 1.2 Improvement initiatives are difficult to test on a limited scale
( i.e., through pilot studies) 1.6 1.1
The guidance available for improvements is insufficient 1.5 1.0 Approaches to, and methods for, improvement are difficult to
use 1.4 1.0
Improvement work is in conflict with the roles and positions
of different professional groups 1.2 1.1
Table 3
“To what extent have the following items been driving forces for your improvement work?”
Statement, Rank order Mean value *
(n=152)
SD
Good ideas from employees 3.1 0.7
Daily work does not function optimally 2.6 1.0
Problems regarding the quality of healthcare 2.2 1.0
Patient needs/complaints 2.1 1.2
Problems regarding access to healthcare 2.1 1.3
Problems regarding patient safety 2.1 1.1
Medical innovations 2.0 1.1
Problems regarding staff/the work environment 1.9 1.2
Changes to the organizational structure 1.7 1.1
Directives from official authorities; laws and regulations 1.7 1.0
Decisions from higher level managers 1.6 1.1
Financial problems 1.4 1.1
Financial support for improvement work 1.3 1.2
Political representatives’ decisions 1,3 1.1
The desire to increase our market share 1.2 1.2
Table 4
“To what extent do you think that improvement work in your organization is characterized by the following statements?”
Statement, Rank order Mean value *
(n=152)
SD
The goals for our improvement work are developed through
dialogue between employees and leaders 3.0 0.8
Improvement work is carried out by multi-professional groups 2.9 1.1 Employees have experience of problems (that we are trying to
solve) from their daily work 2.8 0.9
The improvement work has challenging but realistic goals 2.7 0.8 We can demonstrate concrete results quickly which can be
attributed to the change made 2.5 0.9
Data that illustrates the importance to our patients of solving a particular problem are demonstrated and accepted by all who are
concerned by improvement efforts 2.4 1.0
Those affected by changes are allowed to participate in interpreting
goals, ideas, and the implications of the changes 2.4 0.9 In our improvement work there is an attitude which encourages risk
taking and experimentation; a spirit prevails which accepts that
things can go wrong, but that we learn from mishaps 1.8 1.0 * Mean value above 2 is positive (agree) and below 2 is negative (do not agree)
Table 5
“From your experience of improvement work in your organization - in which way has the following aspects been affected?"
Statement, Rank order Mean value *
(n=152)
SD Number of
respondents having confirming data
Staff satisfaction 3.3 0.7 13
Systematic improvement of internal care
pathways 3.2 0.8 21
Patients’ experiences and satisfaction 3.2 0.7 21
Patient safety 3.2 0.8 11
Patient access 3.0 0.8 24
Use of Evidence-Based Medicine 2.8 0.8 8
Medical results 2.8 0.8 11
Systematic improvement of care pathways
that cross organizational boundaries 2.8 0.8 5
Changes to the organizational culture 2.7 0.8 3
Changes to the organizational structure 2.7 0.8 3
The economy 2.5 0.8 19
Systematic improvement of care pathways
between municipality and county council 2.3 0.8 3
Table 6
“How large improvement potential do you think your organization has due to …”
Statement, rank order Mean value *
(n=152)
SD
Staff satisfaction 2.7 0.8
Patients’ experiences 2.7 0.9
Patient safety 2.7 0.9
Systematic improvement of internal care pathways 2.6 0.9
Information systems 2.6 1.0
Systematic improvement of care pathways that cross
organizational boundaries 2.6 1.1
Patient access 2.4 1.1
Medical results 2.3 1.0
Changes to the organizational structure 2.2 1.0
Use of Evidence-Based Medicine 2.2 1.0
Systematic improvement of care pathways between
municipality and county council 2.0 1.3
The economy 1.8 1.0
1% 1% 6% 10% 39% 27% 9% 7% 0 10 20 30 40 50 60 70 1-5 6-10 11-20 21-50 51-100 101-300 301-500 >500 Unit size N u m b e r o f re s p o n d e n
ts Number of full-time staff
Figure 1. Number of employees the participants are managing. Figures in the graph are percentages of all answers
1% 29% 11% 20% 21% 17% 6% 24% 7% 6% 22% 36% 0 5 10 15 20 25 30 35 40 45 50 0-20% 21-40% 41-60% 61-80% 81-100% Do not know Percentages of staff members and physicians involved
at the participants unit
N u m b e r o f re s p o n d e n ts Other staff, n=152 Physician, n=120
Figure 2. Staff members and physicians involved in the improvement work at the
1% 1% 3% 32% 63% 5% 7% 7% 37% 45% 0 10 20 30 40 50 60 70 80 90 100 Absolutely yes
Partly yes Partly no Absolutely not Do not know
N u m b e r o f re s p o n d e n ts
Results worth effort? Affect on improvement work?
Figure 3. Managers´ answers to the questions “Do you think the results were worth the efforts?” and “Do you think that the county council improvement program has affected the improvement work at your unit?” Figures in the graph are percentages of all answers