An ecosystem service
approach for analyzing marine
human activities in Sweden
A synthesis for the Economic and Social Analysis of the Initial
Assessment of the Marine Strategy Framework Directive
An ecosystem service approach for analyzing
marine human activities in Sweden
A synthesis for the Economic and Social Analysis of the Initial Assessment of the Marine Strategy Framework Directive
Enveco Environmental Economics Consultancy
(Tore Söderqvist, Linus Hasselström and Åsa Soutukorva)
EnviroEconomics Sweden
(Scott Cole)
IVL Swedish Environmental Research Institute
(Mikael Malmaeus) with contributions from
DHI Sweden
(Patricia Moreno-Arancibia, Olof Liungman and Nick Ahrensberg) IVL Swedish Environmental Research Institute
(Jonas Fejes, Erik Fridell, Mattias Gustafsson, Maria Lindblad, Susanna Roth, Peter Stigson, Johan Stål, Annika Tegeback, Philip Thörn, Ida
Westerberg and Hulda Winnes)
Swedish Agency for Marine and Water Management, report 2012:8 Havs- och vattenmyndighetens rapport 2012:8
Foreword
Within Europe, the efforts to implement new legislation around the marine environment have begun in earnest. In order to gather all maritime activities into a single framework, the EU has formulated a maritime strategy designed after three main directions: the Common Fisheries Policy, marine spatial planning, and common environmental legislation for the marine environment. The common environmental legislation has been formulated within the EU Marine Strategy Framework Directive (2008/56/EG) which was introduced into Swedish legislation through the Marine Environmental Regulation (SFS 2010:1341).
In Sweden, marine issues received a new home on 1 July 2011 with the creation of a new, central administrative authority, the Swedish Agency for Marine and Water Management (SwAM). The new agency will use an integrated approach in working with issues pertaining to water, marine, and fisheries management. The introduction of the Marine Strategy Framework Directive (MSFD) in Sweden and the development of marine spatial planning will become central to operations in the coming years.
As a first step in Sweden’s work with MSFD, an initial assessment of the marine environment’s status has been conducted and assembled into “Good
Environmental Status 2020 – Part 1: Initial Assessment of the State of the Environment and Socio-economic Analysis.” As the name suggests, the assessment gives an overall picture of the current state of the environment. It also describes the socio-economic importance of the different activities and operations currently in progress in marine areas as well as the stresses they generate on the ecosystem.
The report “An ecosystem service approach for analyzing marine human activities in Sweden” is an important part of the documentation produced by the Swedish Agency for Marine and Water Management for the initial
assessment. The report deals with the socio-economic analysis and addresses how different activities in Swedish marine waters are dependent on ecosystem services, and at the same time affect the ability of the ecosystems to provide the same services. In addition, the report gives an assessment of the
socio-economic cost that can be expected as a result of a continued degradation of the marine environment. The report is a summary of four previous reports (dealing with the Swedish maritime sector, the Swedish marine tourism and recreation sector, oil spills in Swedish marine waters and marine litter) commissioned by SwAM and the Swedish Environmental Protection Agency to underpin the Swedish initial assessment.
Förord
I Europa har arbetet med att genomföra ny lagstiftning på havsmiljöområdet inletts på allvar. Med syfte att samla all maritim verksamhet i ett och samma ramverk har EU formulerat en maritim strategi som utformats efter tre huvudriktningar; gemensam fiskeripolitik, fysisk planering till havs samt gemensam miljölagstiftning för den marina miljön. Den gemensamma miljölagstiftningen har formulerats i Havsmiljödirektivet (2008/56/EG) som omsatts i svensk lag genom Havsmiljöförordningen (SFS 2010:1341).
I Sverige fick de marina frågorna en ny hemvist 1:e juli 2011 genom inrättandet av en ny central förvaltningsmyndighet, Havs- och vattenmyndigheten. Den nya myndigheten ska arbeta på ett integrerat sätt med vatten-, havs och fiskförvaltningsfrågor. Införandet av havsmiljödirektivet i Sverige, samt
utvecklingen av den marina fysiska planeringen kommer att vara centrala delar av verksamheten under de kommande åren.
Som ett första steg i det svenska arbetet med Havsmiljödirektivet har en inledande bedömning av havsmiljöns tillstånd gjorts, God miljöstatus 2020 – Del 1: Inledande bedömning av miljötillståndet och socioekonomisk analys. Som namnet antyder ger den inledande bedömningen en bild av det nuvarande miljötillståndet. Den beskriver också den samhällsekonomiska betydelsen av olika aktiviteter och verksamheter som pågår i våra havsområden idag, samt den belastning på ekosystemen som nyttjandet ger upphov till.
Rapporten An ecosystem service approach for analyzing marine human activities in Sweden är en viktig del i det underlag som tagits fram av Havs – och vattenmyndigheten för den inledande bedömningen. Rapporten behandlar den samhällsekonomiska analysen och beskriver dels hur olika aktiviteter i svenska marina vatten är beroende av ekosystemtjänster, och dels hur samma aktiviteter påverkar ekosystemtjänsternas förmåga att leverera nyttor till samhället. I tillägg ges en beskrivning över hur samhället kommer att påverkas om miljöförsämringarna i de marina miljöerna fortsätter. Rapporten
sammanfattar fyra underlagsrapporter (om den maritima sektorn, marint avfall, oljespill och marin turism och rekreation) som tagits fram på uppdrag av Havs- och vattenmyndigheten och Naturvårdsverket för den inledande
bedömningen.
INNEHÅLL
0 SUMMARY ... 7
1 INTRODUCTION ... 14
2 THE ECOSYSTEM SERVICE APPROACH ... 15
2.1 What are marine ecosystem services? ... 15
2.2 The ecosystem service approach in ESA ... 18
2.3 Ecosystem service analysis ... 20
3 MARINE HUMAN ACTIVITIES ... 21
4 ECOSYSTEM SERVICE ANALYSIS ... 23
4.1 Drivers’ dependence on ecosystem services ... 23
4.2 Drivers’ impact on ecosystem services ... 26
5 ECOSYSTEM SERVICES AND GES DESCRIPTORS AND INDICATORS 34 5.1 Linking selected ecosystem services to GES descriptors and indicators ... 34
5.1.1 Selection of indicators for D1 Biological diversity ... 35
5.1.2 Selection of indicators for D5 Eutrophication ... 37
5.1.3 Selection of indicators for D8 Contaminants ... 39
5.1.4 Selection of indicators for D10 Marine litter ... 40
5.1.5 Selection of indicators: Summary ... 42
5.2 Current status of selected indicators and ecosystem services ... 42
5.2.1 D1 Biological diversity ... 42
5.2.2 D5 Eutrophication ... 45
5.2.3 D8 Contaminants ... 49
5.2.4 D10 Marine litter ... 51
6 BAU SCENARIO FOR 2020 AND 2050 ... 55
6.1 Review of existing policies and policy instruments ... 55
6.1.1 Overview of driving forces and policy responses ... 55
6.1.2 Effectiveness of existing policy response ... 61
6.2 Development of drivers until 2020 and 2050 ... 63
6.3 Implications for GES indicators and ecosystem services ... 67
6.3.1 D1 Biological diversity ... 67
6.3.2 D5 Eutrophication ... 68
6.3.3 D8 Contaminants ... 69
6.3.4 D10 Marine litter ... 69
6.4.2 D5 Eutrophication ... 72
6.4.3 D8 Contaminants ... 73
6.4.4 D10 Marine litter ... 74
6.4.5 Potential future policy needs to reach GES ... 75
7 CONCLUDING DISCUSSION ... 78
REFERENCES ... 80
APPENDIX A.DEFINITIONS OF ECOSYSTEM SERVICES ... 85
A.1 Supporting ecosystem services ... 85
A.2 Regulating ecosystem services ... 86
A.3 Provisioning ecosystem services ... 87
A.4 Cultural ecosystem services ... 88
0
Summary
The initial assessment (IA) of the implementation of the EU Marine Strategy Framework Directive (MSFD) includes an economic and social analysis (ESA). This analysis covers two components: (1) the use of marine waters and (2) the cost of degradation of the marine environment. The Swedish ESA work has entailed four different areas, reported in four separate reports:
A. The maritime sector (IVL and Enveco, 2012 "Report A") B. Marine tourism and recreation (Enveco, DHI and Resurs, 2012
"Report B")
C. Oil spill (IVL, Enveco and EnviroEconomics Sweden, 2012 "Report C") D. Marine litter (Enveco and DHI, 2012 "Report D")
The purpose of this analysis is to synthesize the results of the four reports. The Swedish ESA is based on the ecosystem service approach and also on the DPSIR framework for sorting out relationships between Drivers, Pressures, State, Impact and Response. The point of departure in terms of marine ecosystem services is the classification in Table 0.1. We apply an ecosystem service analysis that in principle follows the procedure of a Corporate Ecosystem Services Review (ESR) (WRI, 2008) for evaluating a human activity’s dependence of – and impact on – eco system services. In the DPSIR context, the focus is on both how a driver influences the status of ecosystem services through its pressure and how the driver is affected by the status of ecosystem services. In short, this analysis applies the following four steps:
I. Identify the human activities, i.e. the drivers.
II. Identify associated pressure (for each driver) and determine (1) which ecosystem service(s) it is mainly dependent upon and (2) which ecosystem services it mainly affects. Based on this "filter", select the most relevant ecosystem services for further analysis.
III. Analyze the status and trends in the selected ecosystem services by associating them to Good Environmental Status (GES) descriptors and indicators.
IV. Analyze how a business-as-usual (BAU) scenario influences the trend in GES indicators and thus, the implied status of ecosystem services. Figure 0.1 describes the analysis of the report in a DPSIR framework. Areas A and B have been included as the drivers subject to study. Thus, we investigate the dependence of these human activities on ecosystem services (i.e., the dashed arrow from impacts to drivers). As to pressures, areas C (oil spill) and D (marine litter) constitute two types of pressures from areas A and B, although other pressures from areas A and B are also studied, as shown in Figure 0.1. Because some important drivers influencing the marine environment are not taken into account in the analysis (e.g. agriculture and non-maritime industry), this synthesis may provide an incomplete picture of the total pressure on the marine environment and thus on the supply of marine ecosystem services.
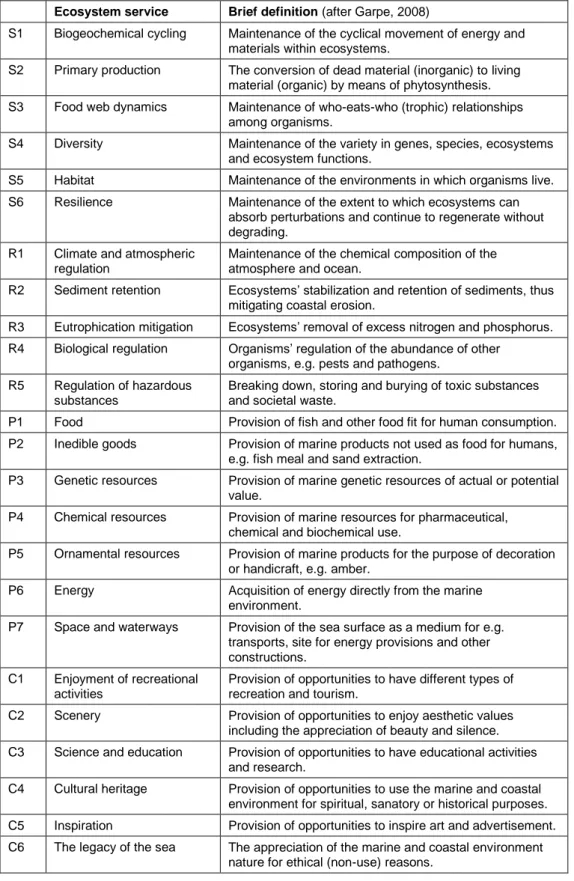
Table 0.1. List of identified marine ecosystem services provided by the Baltic Sea and the Skagerrak (S=supporting, R=regulating, P=provisioning, C=cultural). See Appendix A for detailed
definitions of the services. Source: Garpe (2008) and SEPA (2009).
Ecosystem service Brief definition (after Garpe, 2008)
S1 Biogeochemical cycling Maintenance of the cyclical movement of energy and materials within ecosystems.
S2 Primary production The conversion of dead material (inorganic) to living material (organic) by means of phytosynthesis. S3 Food web dynamics Maintenance of who-eats-who (trophic) relationships
among organisms.
S4 Diversity Maintenance of the variety in genes, species, ecosystems and ecosystem functions.
S5 Habitat Maintenance of the environments in which organisms live. S6 Resilience Maintenance of the extent to which ecosystems can
absorb perturbations and continue to regenerate without degrading.
R1 Climate and atmospheric regulation
Maintenance of the chemical composition of the atmosphere and ocean.
R2 Sediment retention Ecosystems’ stabilization and retention of sediments, thus mitigating coastal erosion.
R3 Eutrophication mitigation Ecosystems’ removal of excess nitrogen and phosphorus. R4 Biological regulation Organisms’ regulation of the abundance of other
organisms, e.g. pests and pathogens. R5 Regulation of hazardous
substances
Breaking down, storing and burying of toxic substances and societal waste.
P1 Food Provision of fish and other food fit for human consumption. P2 Inedible goods Provision of marine products not used as food for humans,
e.g. fish meal and sand extraction.
P3 Genetic resources Provision of marine genetic resources of actual or potential value.
P4 Chemical resources Provision of marine resources for pharmaceutical, chemical and biochemical use.
P5 Ornamental resources Provision of marine products for the purpose of decoration or handicraft, e.g. amber.
P6 Energy Acquisition of energy directly from the marine environment.
P7 Space and waterways Provision of the sea surface as a medium for e.g. transports, site for energy provisions and other constructions.
C1 Enjoyment of recreational activities
Provision of opportunities to have different types of recreation and tourism.
C2 Scenery Provision of opportunities to enjoy aesthetic values including the appreciation of beauty and silence.
Figure 0.1. Areas A-D in the DPSIR framework.
Table 0.2 summarizes how the main drivers in this synthesis are dependent upon marine ecosystem services (X axis of the table). Table 0.3 describes the main impacts of these drivers on the supply of marine ecosystem services (Y axis of the table). Note that the categorization of drivers is somewhat different in these two tables. Based on our ESR approach, we select three ecosystem services for further analysis from Table 0.3. The services that we determine to be the most relevant for in-depth study include:
S4 Diversity R3 Eutrophication mitigation C2 Scenery State Status of ecosystems and intermediate ecosystem services Impacts Status of final ecosystem services Response Society's reaction to impacts Drivers A. The maritime sector B. Marine tourism and recreation Pressures C. Oil spill D. Marine litter Other pressures
Table 0.2. Main dependencies of sectors on marine ecosystem services Sec-tors Ecosystem services S1-S6, R1 R2 R3 R4 R5 P1 P2 P3 P4 P5 P6 P7 C1 C2 C3 C4 C5 C6 Supp & cli. atm. reg. Sed reg Eutr mit Bio reg Reg haz sub Food Ined good s Gen res Che res Orn res Energ y Spa-ce & w w Recr Sce-nery Sci & edu Cul her Inspi-ration Le-gacy of sea A.a Final A.b Fu Final A.c Fu I for P1 I for P1 I for P1 Final Final Recr. fish. Fu I for P1 I for P1 I for P1 I for C1
Final Final I for C1
I for C1 B.a-B.e Fu I for
C1
Final Final I for C1 I for C1 B.f-B.h Fu I for C1 I for C1 Final I for C1 I for C1 Fu = fundamental marine ecosystem service
Table 0.3. Main impact of human activities on the supply of marine ecosystem services (as screened in the different reports).
Ecosystem services Maritime transport and port activities, incl. marine tourism and recr. focusing on the use of ships/boats Maritime energy sector Fisheries and aquaculture Marine tourism and recreation not focusing on the use of ships/boats S1 Biogeochemical cycling S2 Primary production
+
+
+
S3 Food web dynamics
S4 Diversity
-
-
-
S5 Habitat-
-
-
S6 Resilience-
R1 Climate and atmospheric regulation+
+
R2 Sediment retention-
-
-
R3 Eutrophication mitigation-
-
-
R4 Biological regulation+
R5 Regulation of hazardoussubstances
+ and -
+ and -
-
P1 Food
-
-
+ and -
P2 Inedible goods
+
+ and -
P3 Genetic resources
-
-
P4 Chemical resources
-
P5 Ornamental resourcesP6 Energy
P7 Space and waterways
C1 Recreation
-
-
-
-
C2 Scenery-
-
-
-
C3 Science and education C4 Cultural heritage C5 Inspiration-
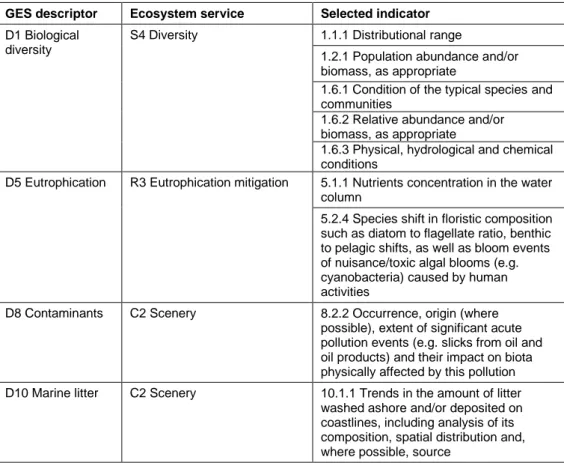
We link these three ecosystem services (S4 Diversity, R3 Eutrophication mitigation and C2 Scenery) to the most relevant GES descriptors and
indicators, as shown in Table 0.4. In terms of descriptors, S4 was found to be most closely connected to GES descriptor D1 Biological diversity, R3 to D5 Eutrophication and C2 to D8 Contaminants and D10 Marine litter. The next step was to determine which GES indicators most influence the status of the three selected ecosystem services, also shown in Table 0.4. Finally, based on our analysis of the current trends of the selected indicators we determine that the current supply of S4 and R3 are insufficient and the current supply of C2 to be locally insufficient.
Table 0.4. List of selected indicators influencing the status of the ecosystem services. GES descriptor Ecosystem service Selected indicator
D1 Biological diversity
S4 Diversity 1.1.1 Distributional range
1.2.1 Population abundance and/or biomass, as appropriate
1.6.1 Condition of the typical species and communities
1.6.2 Relative abundance and/or biomass, as appropriate
1.6.3 Physical, hydrological and chemical conditions
D5 Eutrophication R3 Eutrophication mitigation 5.1.1 Nutrients concentration in the water column
5.2.4 Species shift in floristic composition such as diatom to flagellate ratio, benthic to pelagic shifts, as well as bloom events of nuisance/toxic algal blooms (e.g. cyanobacteria) caused by human activities
D8 Contaminants C2 Scenery 8.2.2 Occurrence, origin (where possible), extent of significant acute pollution events (e.g. slicks from oil and oil products) and their impact on biota physically affected by this pollution D10 Marine litter C2 Scenery 10.1.1 Trends in the amount of litter
washed ashore and/or deposited on coastlines, including analysis of its composition, spatial distribution and, where possible, source
As a first step toward projecting future supply scenarios for the selected ecosystem services to 2020 and 2050 under BAU, we review existing policies that target the relevant drivers and describe why existing policies are
analysis. We find that there are some useful cost estimates for e.g. changes in fish catches, eutrophication effects, recreational opportunities and presence of marine litter. However, substantial data gaps exist. The fact that GES is
unlikely to be reached in 2020 or in 2050 implies a need for new and improved policies. Examples of such policies are found in the report.
1
Introduction
The initial assessment (IA) of the implementation of the EU Marine Strategy Framework Directive (MSFD) includes an economic and social analysis (ESA). This analysis covers two areas: (1) the use of marine waters and (2) the cost of degradation of the marine environment. The Swedish ESA work has entailed four different areas:
A. The maritime sector
B. Marine tourism and recreation C. Oil spill
D. Marine litter
Each of these areas has been subject to a separate report: A. IVL and Enveco (2012)
B. Enveco, DHI and Resurs (2012)
C. IVL, Enveco and EnviroEconomics Sweden (2012) D. Enveco and DHI (2012)
In this report, these reports will be referred to as the A, B, C and D reports, respectively. “The ABCD reports” will be used as a shorthand for referring to all four reports.
Because the four areas are interlinked and because the work for all four reports was carried out more or less simultaneously during July 2011-January 2012, the analyses in these reports are partly complementary and partly overlapping. In addition, the approaches chosen in the analyses were not entirely
homogenous. Thus, the purpose of this analysis is to synthesize the results of the four reports.
This report is structured as follows. Chapter 2 presents the methods for the analysis. Chapter 3 identifies the relevant human activities and the resulting limitations of the analysis. An ecosystem service analysis is carried out in Chapter 4. This analysis screens out a few ecosystem services, which are subject to an in-depth analysis in Chapter 5 by linking them to GES descriptors and indicators as defined in COM (2011). Chapter 5 also contains an assessment of the current status of the selected ecosystem services. In Chapter 6, we review existing policies and policy instruments for the human activities covered by the synthesis. Chapter 6 also summarizes projections to 2020 and 2050 for the development of these human activities in a business-as-usual scenario, and reviews the consequences for GES indicators and associated ecosystem services due to this development. This provides a basis for discussing the cost of
2
The ecosystem service
approach
2.1
What are marine ecosystem services?
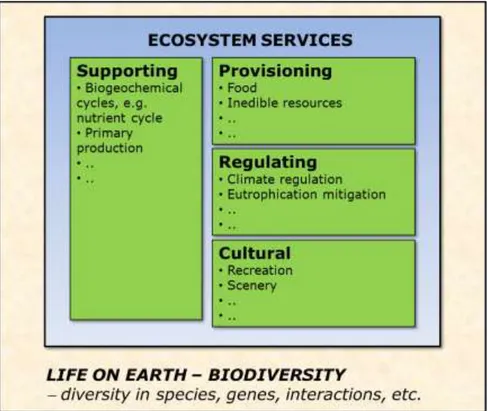
Ecosystems provide support to human life and contribute to human well-being in numerous different ways. In recent years, this fact has increasingly been conceptualized by using the terms “ecosystem goods” and “ecosystem services”, and a number of definitions and classifications are available in the literature, see TEEB (2010, p. 17) for references. The Millennium Ecosystem Assessment (MA, 2005) provided a definition and categorization that has been much employed, also by Garpe (2008) and SEPA (2009) for the case of marine ecosystems. Sometimes a distinction between “ecosystem goods” and “ecosystem services” is made, with the former referring to products that are provided by ecosystems and that usually can be traded on a market – fish is a typical example. However, we follow Garpe (2008) and SEPA (2009) and use “ecosystem services” as a general term also covering “ecosystem goods”. The concept of ecosystem services represents an instrumental perspective on ecosystems – it is about the ways in which ecosystems are useful to humans. As noted by Garpe (2008), the concept thus views ecosystems from a utilitarian perspective. As emphasized by TEEB (2010, Figure 1.4), the concept provides a link between what is going on in an ecosystem in terms of its structures, processes and functions and human well-being. Based on the four categories of provisioning, supporting, regulating and cultural ecosystem services suggested by MA (2005) and illustrated in Figure 2.1, Garpe (2008) and SEPA (2009) identified a number of ecosystem services provided by the marine ecosystems of the Baltic Sea and the Skagerrak, see Table 2.1. Definitions of these services are found in Appendix A.
In the discussion of ecosystem services, it has been observed that some of them tend to be input in ecosystems’ production of other services. For example, the regulating service of mitigation of eutrophication might be manifested in improved opportunities for recreation, i.e. a cultural service. Ecosystem services are therefore often divided into intermediate and final ecosystem services, see e.g. Fisher et al. (2009). As emphasized by COM (2010), this division is likely to help avoiding a narrow focus on final services when making a full listing of ecosystem services and also avoiding double counting when making a monetary assessment of ecosystem services. As Boyd (2010) puts it:
“The distinction between final and intermediate goods and services arises in any economic accounting system. Final goods are not necessarily more important or valuable than intermediate goods. Rather, the distinction arises because of the fundamental accounting identity: count everything, but only count it once.” (p. 8)
“Consider the issue of double-counting in conventional economic accounts, like GDP. Take cars for example. If we counted both cars and the steel used to make them and then weighted carts and steel by their market prices, we will have double counted the value of the steel. The reason is that the steel’s value in car production is
the value of a good or service subsequently sold in the market, it is an intermediate good. The labor, leather, steel, and human capital required to make the car are intermediate goods. The final good is the car itself.” (p. 9)
Table 2.1. List of identified marine ecosystem services provided by the Baltic Sea and the Skagerrak (S=supporting, R=regulating, P=provisioning, C=cultural). See Appendix A for detailed
definitions of the services. Source: Garpe (2008) and SEPA (2009).
Ecosystem service Brief definition (after Garpe, 2008)
S1 Biogeochemical cycling Maintenance of the cyclical movement of energy and materials within ecosystems.
S2 Primary production The conversion of dead material (inorganic) to living material (organic) by means of phytosynthesis. S3 Food web dynamics Maintenance of who-eats-who (trophic) relationships
among organisms.
S4 Diversity Maintenance of the variety in genes, species, ecosystems and ecosystem functions.
S5 Habitat Maintenance of the environments in which organisms live. S6 Resilience Maintenance of the extent to which ecosystems can
absorb perturbations and continue to regenerate without degrading.
R1 Climate and atmospheric regulation
Maintenance of the chemical composition of the atmosphere and ocean.
R2 Sediment retention Ecosystems’ stabilization and retention of sediments, thus mitigating coastal erosion.
R3 Eutrophication mitigation Ecosystems’ removal of excess nitrogen and phosphorus. R4 Biological regulation Organisms’ regulation of the abundance of other
organisms, e.g. pests and pathogens. R5 Regulation of hazardous
substances
Breaking down, storing and burying of toxic substances and societal waste.
P1 Food Provision of fish and other food fit for human consumption. P2 Inedible goods Provision of marine products not used as food for humans,
e.g. fish meal and sand extraction.
P3 Genetic resources Provision of marine genetic resources of actual or potential value.
P4 Chemical resources Provision of marine resources for pharmaceutical, chemical and biochemical use.
P5 Ornamental resources Provision of marine products for the purpose of decoration or handicraft, e.g. amber.
P6 Energy Acquisition of energy directly from the marine environment.
P7 Space and waterways Provision of the sea surface as a medium for e.g. transports, site for energy provisions and other constructions.
C1 Enjoyment of recreational activities
Provision of opportunities to have different types of recreation and tourism.
C2 Scenery Provision of opportunities to enjoy aesthetic values including the appreciation of beauty and silence. C3 Science and education Provision of opportunities to have educational activities
and research.
C4 Cultural heritage Provision of opportunities to use the marine and coastal environment for spiritual, sanatory or historical purposes. C5 Inspiration Provision of opportunities to inspire art and advertisement. C6 The legacy of the sea The appreciation of the marine and coastal environment
To make the services in Table 2.1 operational for an analysis requires that some of them are divided into subcategories. For example, the following seven subcategories of C1 Enjoyment of recreational activities were used in the analysis of marine tourism and recreation in the B report:
C1.1 Swimming
C1.2 Diving
C1.3 Windsurfing, water skiing C1.4 Boating
C1.5 Fishing
C1.6 Being at the beach or seashore for walking, picnicking, sunbathing, visiting touristic or cultural sites, etc. C1.7 Using water-based transportation
The C1 subcategories specify which recreational opportunities are supplied by the coastal and marine environment and are based on how people currently use the environment (SEPA, 2010a, 2010b). While such a subcategorization can be useful for a detailed analysis, it is less necessary for this type of synthesis. Therefore, we focus on the main categories in Table 2.1.
2.2 The ecosystem service approach in ESA
The ESA focuses on two components: (1) the use of marine waters and (2) the cost of degradation of the marine environment. COM (2010) describes two different approaches for analysing component (1) – the ecosystem service approach and the marine water accounts approach – and three different approaches for analysing components (2) – the ecosystem service approach, the thematic approach and the cost-based approach.The Swedish ESA is based on the ecosystem service approach for both
components. For the use of marine waters, this approach entails the following steps (COM, 2010, p. 17):
1a. Identifying marine ecosystem services in cooperation with the analysis of status, pressures and impacts;
1b. Identifying and, if possible, quantifying and valuing the well-being derived from the ecosystem services; and
1c. Identifying the drivers and pressures affecting the ecosystem services. The cost of degradation component requires further refinement of the
ecosystem service approach, including a more specific focus on the ecological status and a link to human welfare. It includes the following steps (COM, 2010, p. 35):
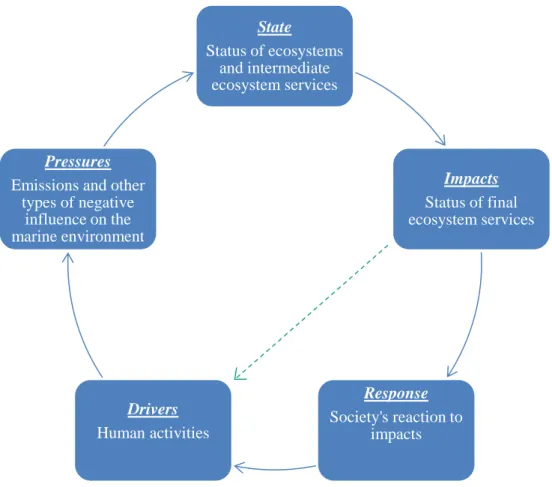
The multiple steps involved in each component suggest the important role of the DPSIR framework for sorting out relationships between drivers, pressures, state, impact and response. Figure 2.2 summarizes these terms in the context of the marine environment. Drivers are various human activities causing pressure on the marine environment through emissions and other types of negative influence. This pressure affects the state of marine ecosystems and thus also the supply of intermediate ecosystem services, which in turn creates impact on ecosystems’ provision of final ecosystem services. As indicated by the dashed arrow in Figure 2.2, this influences those human activities that are dependent on ecosystem services. The impact might also give rise to a response in terms of policies to influence the drivers in a way that would reduce their pressures.
Figure 2.2. The DPSIR framework in an ecosystem service setting.
State Status of ecosystems and intermediate ecosystem services Impacts Status of final ecosystem services Response Society's reaction to impacts Drivers Human activities Pressures
Emissions and other types of negative
influence on the marine environment
2.3
Ecosystem service analysis
To inform the ESA ecosystem service approach, we carry out an ecosystem service analysis that in principle follows the procedure of a Corporate
Ecosystem Services Review (ESR) as designed by WRI (2008), see also Report B. The purpose of an ESR is to evaluate a company’s dependence of and impact on ecosystem services as a basis for identifying the resulting business risks and opportunities. ESR emphasizes the importance of both looking at dependence and impact; otherwise the basis for saying something about business risk and opportunities would be incomplete. That is, the goal is to evaluate both how a company influences the status of ecosystem services through its pressure and how the company is affected by the status of ecosystem services. An ESR consists of five steps:
I. Determine the corporate boundaries related to e.g. markets, geographical area, products, customers, etc.
In this report, this is done by identifying the human activities (drivers) in Chapter 3.
II. Identify the company’s impact and dependence on ecosystem services and select those services that are the most important ones in terms of impact and dependence.
This is done in Chapter 4 for the human activities by identifying associated pressure on and dependence of ecosystem services and sort out those ecosystem services which are most relevant for an in-depth study.
III. Analyze the status and trends in the selected ecosystem services.
This is done in Chapter 5 by associating the selected ecosystem services to GES descriptors and indicators.
IV. Identify business risk and opportunities based on the trends in the selected ecosystem services.
This is done in Chapter 6 by analyzing what a business-as-usual scenario says about the trend in GES indicators and implied status of ecosystem services.
V. Develop strategies for minimizing the risks and maximizing opportunities.
This last step is rather a part of the future Programmes of Measures than the Initial Assessment of the MSFD.
The usefulness of an ESR hinges upon carrying out different kinds of
screenings. Step I is one kind of screening, but the selection in step II is critical as it identifies the most important ecosystem services in terms of impact and
3
Marine human activities
As mentioned in Chapter 1, the ESA work has entailed four different areas. The first two areas are further subdivided, as in Reports A and B:
A. The maritime sector (driver)
a. Maritime transport and port activities b. Maritime energy sector
c. Commercial fishing and aquaculture B. Marine tourism and recreation (driver)
a. Cruise-ship traffic in marine waters
b. International passenger ferry traffic in marine waters c. National passenger ferry traffic in marine waters
d. Other commercial passenger transportation in marine waters e. Leisure boating in marine waters
f. Holiday housing associated with marine recreation
g. Commercial accommodation (e.g. hotels, camping sites, etc.) associated with marine recreation
h. Same-day visits associated with marine recreation C. Oil spill (pressure)
D. Marine litter (pressure)
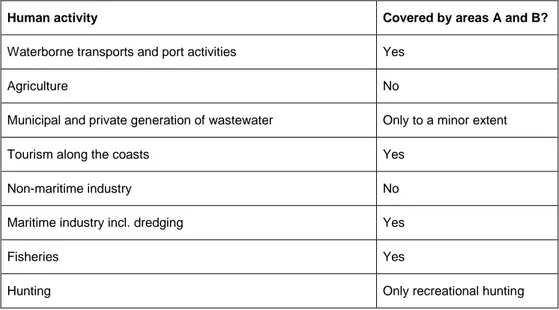
Relating these areas to the DPSIR framework, areas A and B can be identified as human activities constituting drivers and thus the focus of this synthesis. This implies that a number of other drivers causing pressures on the marine environment are excluded from the analysis. Some of the drivers that may be missing are shown in Table 3.1, which lists human activities mentioned by HELCOM (2010a). At least three major gaps can be identified: Agriculture, non-maritime industry and municipal and private generation of wastewater. These three human activities account for substantial pressure in terms of, for example, emissions of nutrients and various hazardous substances. The results of the synthesis must thus be interpreted with this delimitation in mind.
Table 3.1. Main human activities causing pressure on the marine environment. Source: HELCOM (2010a, p. 9)
Human activity Covered by areas A and B?
Waterborne transports and port activities Yes
Agriculture No
Municipal and private generation of wastewater Only to a minor extent
Tourism along the coasts Yes
Non-maritime industry No
Maritime industry incl. dredging Yes
Fisheries Yes
In Figure 3.1, areas A and B have been included as the drivers subject to study in this synthesis. This also implies that the dependence of these human
activities on ecosystem services (i.e., the dashed arrow from impacts to drivers) will be investigated. As to pressures, areas C (oil spill) and D (marine litter) constitute two types of pressures from areas A and B. However, as indicated by Figure 3.1, other pressures caused by areas A and B will also be studied. The fact that some important drivers are not taken into account in this synthesis suggests that this may be an incomplete picture of the total pressure on the marine environment and thus on the supply of marine ecosystem services.
Figure 3.1. Areas A-D in the DPSIR framework.
State Status of ecosystems and intermediate ecosystem services Impacts Status of final ecosystem services Response Society's reaction to impacts Drivers A. The maritime sector B. Marine tourism and recreation Pressures C. Oil spill D. Marine litter Other pressures
4
Ecosystem service analysis
Section 4.1 focuses on the dashed arrows in Figure 3.1, i.e. the extent to which the human activities studied in this synthesis are dependent on marine
ecosystem services. Conclusions about these dependencies are instrumental for discussions in Chapter 6 about how human activities, and thus human welfare, are likely to be affected by future changes in the supply of marine ecosystem services. The conclusions are also helpful for Section 4.2, where we identify the pressures caused by the human activities studied in this synthesis and what marine ecosystem services are primarily affected by these pressures. This forms the basis for our conclusions in Section 4.2 regarding which marine ecosystem services require further in-depth study in the rest of the report.
4.1
Drivers’ dependence on ecosystem
services
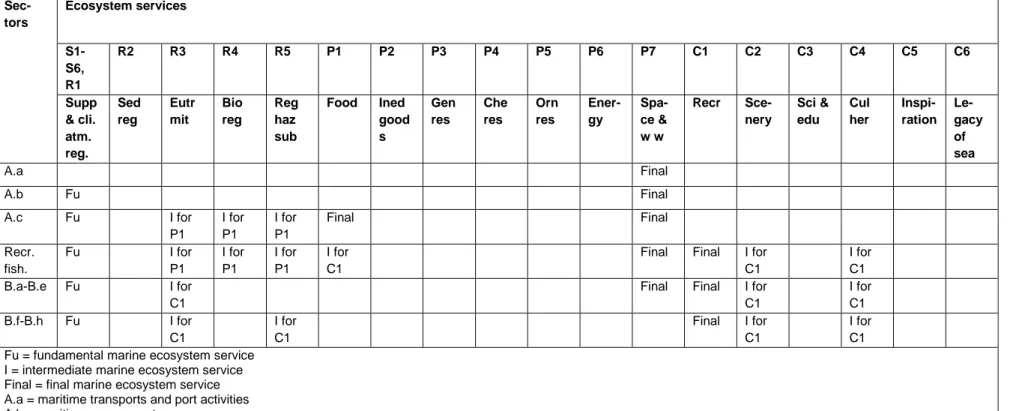
Based on findings in the ABCD reports, Table 4.1 describes the main dependencies of the human activities studied in this synthesis on marine ecosystem services. In the just mentioned reports, it was found that the
supporting services S1-S6 and R1 Climate and atmospheric regulation typically play a fundamental role for the provision of most of the other ecosystem services. S1-S6 and R1 are therefore merged into one column in Table 4.1. The human activities in Table 4.1 are divided into six groups according to how they are dependent on various ecosystem services. The results are summarized below. It should be emphasized that this study focuses on the direct
dependencies and therefore excludes some indirect dependencies. For example, human activities in general use the environment to dispose of waste and
emissions. While this use is covered in Section 4.2 as a pressure, it should be noted that the effects of such disposal are reduced because of the presence of ecosystem services such as R3 Eutrophication mitigation and R5 Regulation of hazardous substances. In the absence of these services, the pressure would have been more substantial, possibly leading to restrictions against the human activities. However, this report does not further analyze these indirect
dependencies on ecosystem services.
1. Maritime transport and port activities (A.a in Chapter 3).
Depend only on P7 Space and waterways, which is a final ecosystem service independent of other ecosystem services. 2. Maritime energy sector (A.b in Chapter 3).
Dependent primarily on P7 Space and waterways as a final ecosystem service, though the groups S1-S6 and R1 are considered fundamental for providing windy conditions (see Wind power in Report A). Wave power is currently a negligible activity and therefore has no dependence on P6 Energy. 3. Commercial fisheries and aquaculture (A.c in Chapter 3).
Dependent on P7 Space and waterways as a final ecosystem service. However, this activity also depends on P1 Food, which in turn requires input of several intermediate services (R3 Eutrophication mitigation, R4 Biological regulation and R5 Regulation of hazardous substances), besides the dependence on the fundamental group S1-S6 and R1.
4. Recreational fisheries (a component in B.e-B.h in Chapter 3).
Dependent on various recreational aspects in addition to the dependencies noted above for commercial fisheries and aquaculture. This includes C1 Enjoyment of recreational activities (final service), and the two intermediate services C2 Scenery and C4 Cultural heritage. Further, P1 Food is viewed as an intermediate service for C1 Enjoyment of recreational activities rather than a final service.
5. Marine tourism and recreation focusing on the use of ships/boats (B.a-B.e in Chapter 3).
Dependent on P7 Space and waterways (final service) and C1 Enjoyment of recreational activities as a supporting final service. Note that C1 requires input of R3 Eutrophication mitigation, C2 Scenery and C4 Cultural heritage as intermediate services. R3 is included because eutrophication effects have a substantially negative impact on recreational quality.
6. Marine tourism and recreation excluding the use of ships/boats (B.f-B.h in Chapter 3).
Dependent on C1 Enjoyment of recreational activities (final service) along with intermediate services R3, C2 and C4. This is further dependent upon R5 Regulation of hazardous substances (intermediate service) because this type of recreation depends on clean water (see Report B).
Table 4.1. Main dependencies of sectors on marine ecosystem services Sec-tors Ecosystem services S1-S6, R1 R2 R3 R4 R5 P1 P2 P3 P4 P5 P6 P7 C1 C2 C3 C4 C5 C6 Supp & cli. atm. reg. Sed reg Eutr mit Bio reg Reg haz sub Food Ined good s Gen res Che res Orn res Ener-gy Spa-ce & w w Recr Sce-nery Sci & edu Cul her Inspi-ration Le-gacy of sea A.a Final A.b Fu Final A.c Fu I for P1 I for P1 I for P1 Final Final Recr. fish. Fu I for P1 I for P1 I for P1 I for C1
Final Final I for C1
I for C1 B.a-B.e Fu I for
C1
Final Final I for C1 I for C1 B.f-B.h Fu I for C1 I for C1 Final I for C1 I for C1 Fu = fundamental marine ecosystem service
I = intermediate marine ecosystem service Final = final marine ecosystem service A.a = maritime transports and port activities A.b = maritime energy sector
A.c = commercial fisheries and aquaculture
Recr. fish. = recreational fisheries (a component in B.e-B.h)
B.a-B.e = marine tourism and recreation focusing on the use of ships/boats B.f.-B.h = marine tourism and recreation excluding the use of ships/boats
4.2
Drivers’ impact on ecosystem services
We now analyze how the human activities studied in this synthesis influence the supply of ecosystem services. In our analysis we group activities together according to the pressures they cause. The activities in Section 4.1 are therefore regrouped as follows: Maritime transport and port activities, including marine tourism and recreation focusing on the use of ships/boats (A.a and B.a-B.e in Chapter 3).
Maritime energy sector (A.b in Chapter 3).
Commercial fishing and aquaculture (A.c in Chapter 3).
Marine tourism and recreation not focusing on the use of ships/boats (B.f-B.h in Chapter 3).
For each of these four human activities, we first identify the main pressures associated with the activities, largely according to the pressure themes as defined in COM (2011). Table 4.2 describes how the pressures in Tables 4.3-4.6 are related to the pressure themes in COM (2011), including the more detailed “sub-pressures”. Subsequently, we identify whether the pressures influence the supply of the marine ecosystem services positively (+) and/or negatively (-), based primarily on the findings in the ABCD reports. The results are presented in Tables 4.3-4.6.
Table 4.2. Pressures and sub-pressures covered by the analysis in this report, and their relationship to pressure themes and pressures in COM (2011).
Pressures in this report Pressure themes in COM (2011)
Pressures in COM (2011), “sub-pressures”
Physical damage and loss, including physical disturbance
Physical loss Smothering Sealing Physical damage Siltation
Abration Extraction Other physical disturbance Underwater noise
Marine litter Hazardous substances and
release of substances Contamination by hazardous substances Synthetic compounds Non-synthetic substances Radio-nuclides
Systematic and/or intentional release of substances
Other substances
Eutrophication Nutrient and organic matter enrichment
Fertilisers and other nitrogen and phosphorus-rich substances
Organic matter Biological disturbance Biological disturbance Microbial pathogens
Non-indigenous species and translocations
Extraction of species, including non-target catches Note:
In this report, oil spills are treated as a separate pressure from maritime transport and port activities because of its detailed analysis in the C report.
The pressure theme of interference with hydrological processes in COM (2011) is not taken into account in this report because its effects are minor in Swedish marine waters, cf. the A report.
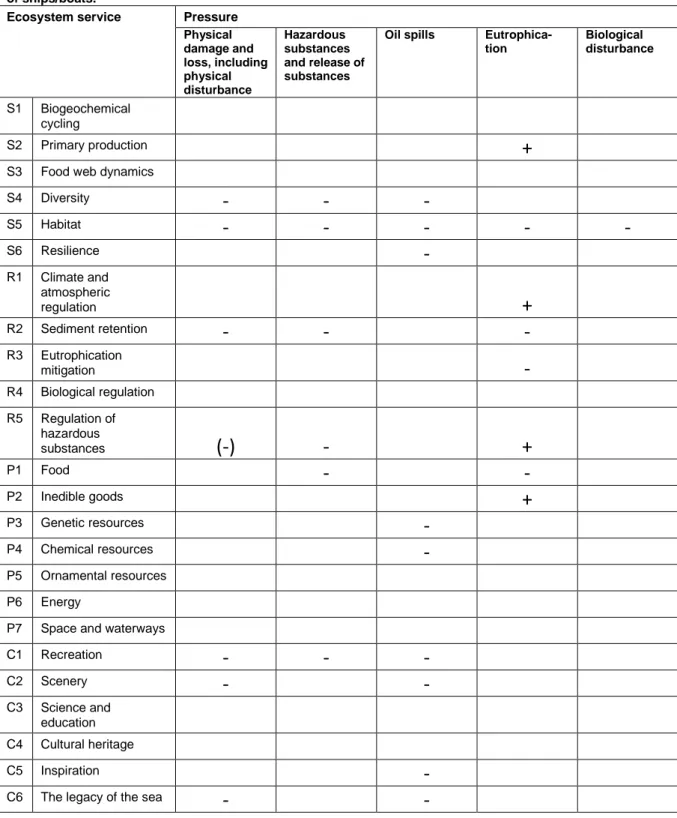
Table 4.3. Main impact on the supply of marine ecosystem services from maritime transport and port activities, including marine tourism and recreation focusing on the use of ships/boats.
Ecosystem service Pressure Physical damage and loss, including physical disturbance Hazardous substances and release of substances
Oil spills Eutrophica-tion Biological disturbance S1 Biogeochemical cycling S2 Primary production
+
S3 Food web dynamics
S4 Diversity
-
-
-
S5 Habitat-
-
-
-
-
S6 Resilience-
R1 Climate and atmospheric regulation+
R2 Sediment retention-
-
-
R3 Eutrophication mitigation-
R4 Biological regulation R5 Regulation of hazardous substances(-)
-
+
P1 Food-
-
P2 Inedible goods+
P3 Genetic resources-
P4 Chemical resources-
P5 Ornamental resources P6 EnergyP7 Space and waterways
C1 Recreation
-
-
-
C2 Scenery
-
-
C3 Science and education
Table 4.4. Main impact on the supply of marine ecosystem services from the maritime energy sector
Ecosystem service Pressure Physical damage and loss, including physical disturbance Hazardous substances and release of substances Eutrophica-tion Biological disturbance S1 Biogeochemical cycling S2 Primary production S3 Food web dynamics
S4 Diversity
-
S5 Habitat-
S6 Resilience R1 Climate and atmospheric regulation R2 Sediment retention-
R3 Eutrophication mitigation R4 Biological regulation R5 Regulation of hazardous substances P1 Food(-)
P2 Inedible goods P3 Genetic resources P4 Chemical resources P5 Ornamental resources P6 EnergyP7 Space and waterways
C1 Recreation
-
C2 Scenery-
C3 Science and education C4 Cultural heritage C5 InspirationTable 4.5. Main impact on the supply of marine ecosystem services from commercial fishing and aquaculture
Ecosystem service Pressure Physical damage and loss, including physical disturbance Hazardous substances and release of substances Eutrophica-tion Biological disturbance S1 Biogeochemical cycling S2 Primary production
+
S3 Food web dynamics
S4 Diversity
-
-
S5 Habitat-
-
S6 Resilience R1 Climate and atmospheric regulation+
R2 Sediment retention-
-
R3 Eutrophication mitigation-
R4 Biological regulation+
R5 Regulation of hazardous substances-
+
P1 Food-
+ and -
-
P2 Inedible goods+
-
P3 Genetic resources-
P4 Chemical resources P5 Ornamental resources P6 EnergyP7 Space and waterways
C1 Recreation
-
-
-
C2 Scenery-
-
-
C3 Science and education C4 Cultural heritage C5 InspirationTable 4.6. Main impact on the supply of marine ecosystem services from marine tourism and recreation not focusing on the use of ships/boats.
Ecosystem service Pressure Physical damage and loss, including physical disturbance Hazardous substances and release of substances Eutrophica-tion Biological disturbance S1 Biogeochemical cycling S2 Primary production
+
S3 Food web dynamics S4 Diversity S5 Habitat S6 Resilience R1 Climate and atmospheric regulation R2 Sediment retention R3 Eutrophication mitigation
-
R4 Biological regulation R5 Regulation of hazardous substances-
P1 Food-
P2 Inedible goods P3 Genetic resources P4 Chemical resources P5 Ornamental resources P6 EnergyP7 Space and waterways
C1 Recreation
-
C2 Scenery-
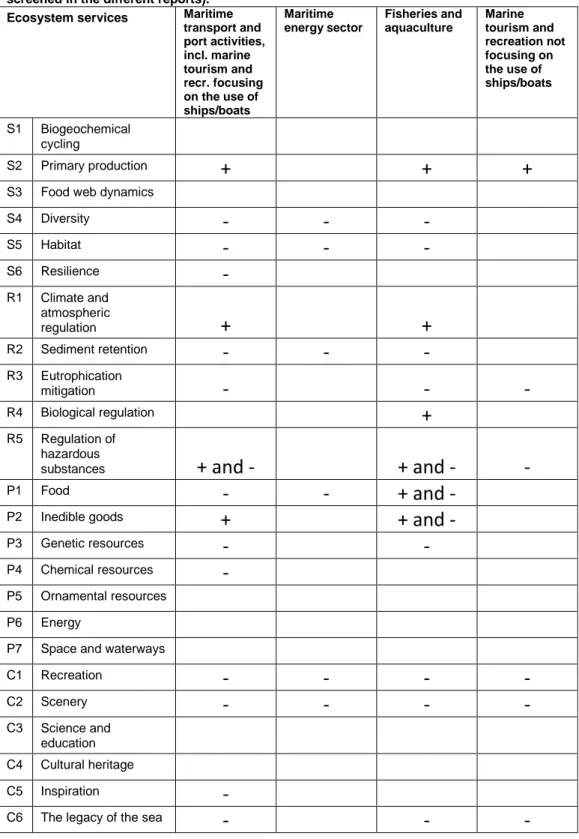
C3 Science and education C4 Cultural heritage C5 InspirationThe information in Tables 4.3-4.6 is summarized in Table 4.7, which illustrates the main impact of the four types of human activities on the supply of marine ecosystem services. Since there is no information available on the relative strength of the positive and negative impacts in Tables 4.3-4.6, our analysis assigns a "+" ("–") to a particular cell if at least one of the pressures caused by this human activity is found to lead to a positive (negative) impact on the ecosystem service. The assignment of “+ and –" in a cell indicates that the human activity has both a positive and negative impact. In Tables 4.3 and 4.4, the impact from the maritime and energy sectors on R5 Regulation of
hazardous substances and P1 Food is marked with brackets to indicate that the effect from physical damage has only a potential impact on these ecosystem services, according to Garpe (2008).
The key contribution of this report is to use the information in Table 4.7 to filter out a few ecosystem services that are relevant for an in-depth analysis in the rest of the report. Our approach simply counts the number of + or – signs to indicate services seem to account for the most substantial impact from the human activities. This suggests that C1 Enjoyment of recreational activities and C2 Scenery should be selected because these are the only services that have four minus signs in Table 4.7. We use this as an argument for selecting C2, because C2 has been identified as an intermediate service for C1.
Among the several ecosystem services that have three negative signs in Table 4.7, we select S4 Diversity and R3 Eutrophication mitigation for further analysis. The reason for choosing R3 is primarily the fact that Table 4.1 indicates that R3 plays an important role as an intermediate service on which human activities depend. This is not surprising given that eutrophication effects are a major issue in both the Baltic Sea and the Swedish part of the North Sea. S4 Diversity falls within the fundamental group (i.e., S1-S6 and R1) and is judged to be important because of the basis it gives to most other ecosystem services. Among these services, S4 Diversity plays a key role as an intermediate ecosystem service by contributing to ecosystem productivity and overall functioning of habitats. Further, we consider S4 to be sensitive to pressures from the maritime sector and hence a possible indicator of management and policy success.
To conclude we select S4 Diversity, R3 Eutrophication mitigation and C2 Scenery as those intermediate services that are judged to be relevant for an in-depth study in the rest of this report. The next step in Chapter 5 links GES descriptors and indicators to these three services and then assesses the current status of these services.
Table 4.7. Main impact of human activities on the supply of marine ecosystem services (as screened in the different reports).
Ecosystem services Maritime transport and port activities, incl. marine tourism and recr. focusing on the use of ships/boats Maritime energy sector Fisheries and aquaculture Marine tourism and recreation not focusing on the use of ships/boats S1 Biogeochemical cycling S2 Primary production
+
+
+
S3 Food web dynamics
S4 Diversity
-
-
-
S5 Habitat-
-
-
S6 Resilience-
R1 Climate and atmospheric regulation+
+
R2 Sediment retention-
-
-
R3 Eutrophication mitigation-
-
-
R4 Biological regulation+
R5 Regulation of hazardoussubstances
+ and -
+ and -
-
P1 Food
-
-
+ and -
P2 Inedible goods
+
+ and -
P3 Genetic resources
-
-
P4 Chemical resources
-
P5 Ornamental resourcesP6 Energy
P7 Space and waterways
C1 Recreation
-
-
-
-
C2 Scenery-
-
-
-
C3 Science and education C4 Cultural heritage C5 Inspiration-
5
Ecosystem services and GES
descriptors and indicators
For assessing current status and future trends, we need information on which factors are influencing the availability of the selected intermediate ecosystem services identified above: S4 Diversity, R3 Eutrophication mitigation and C2 Scenery. This chapter explains how we make the link between these services and the GES descriptors and associated indicators defined in COM (2011).
5.1
Linking selected ecosystem services to
GES descriptors and indicators
As shown in Table 5.1, we conclude that S4 Diversity is most closely connected to descriptor D1 – “Biological diversity is maintained. The quality and occurrence of habitats and the distribution and abundance of species are in line with prevailing physiographic, geographic and climatic conditions”. It is worth noting that the concept of ecosystem services in Figure 2.1 suggests that the four categories of services are surrounded by a larger system of diversity in species, gene and interactions – which is close to the definition of biodiversity (see below).
Further, we find R3 Eutrophication mitigation to be most closely related to descriptor D5 about eutrophication (“human-induced eutrophication is minimised, especially adverse effects thereof, such as losses in biodiversity, ecosystem degradation, harmful algae blooms and oxygen deficiency in bottom waters”). Finally, C2 Scenery was found to have a close connection to descriptor D10 about marine litter (“properties and quantities of marine litter do not cause harm to the coastal and marine environment”), as well as descriptor D8 about contaminants (Concentrations of contaminants are at levels not giving rise to pollution effects). For descriptor D8, one of the indicators reflects the occurrence of significant acute oil pollution events. In general, the descriptors have an ecological focus whereas people’s enjoyment of scenery is determined by many subjective factors.
Table 5.1. Linking selected intermediate ecosystem services to GES descriptors. GES descriptor Selected intermediate ecosystem services
S4: Diversity R3: Eutrophication mitigation C2: Scenery D1: Biological diversity
x
D2: Non-indigenous species D3: Population of commercial fish/shell fish D4: Elements of marine food websD5: Eutrophication
x
D6: Sea floor integrity D7: Alteration of hydrographical conditions
D8: Contaminants
x
D9: Contaminants in fish and seafood for human consumption
D10: Marine litter
x
D11: Introduction of energy, including underwater noise
We now proceed by going through each of the GES descriptors D1, D5, D8 and D10 for discussing the associated indicators and identifying those which are influencing the status of ecosystem services.
5.1.1 Selection of indicators for D1 Biological diversity
The first step is to determine what indicators are relevant for describing the ecosystem service S4 Diversity with regard to the human activities studied in this synthesis. The GES diversity descriptor D1 includes 14 indicators.
Apparently, all indicators describe the status of the ecosystem service, but for practical reasons we find that it is sufficient to concentrate on a subset of these indicators, see Table 5.2. In addition, we do not have sufficient information to evaluate all the listed descriptors. For example, knowledge about the genetic structure of the Baltic Sea ecosystem is at best limited.
Garpe (2008) introduce diversity in terms of an ecosystem function with the following words: “The benefits of biodiversity to other ecosystem services are numerous. Biodiversity typically enables an ecosystem to perform a variety of functions, thus providing various ecosystem services, while buffering against natural and human-induced disturbance (…). The potential of diversity (particularly functional and genetic) to maintain resilience and support resource extraction may become increasingly critical in the current light of global environmental change.” (p. 49).
Biodiversity concerns the richness in variation among living organisms and their complex ecological relationships, which is vital for the delivery of valuable ecosystem goods and services. Diversity in this respect concerns variation within species, among species and between ecosystems. The status in terms of biodiversity is not only determined by the number of species but needs to be evaluated with respect to the deviation from natural conditions regarding genetic, species and ecosystem diversity. In addition to eutrophication and hazardous substances, biodiversity is currently affected by fisheries, habitat destruction and climatic change (e.g. affecting salinity).
Variation within species is thus one important aspect of biodiversity maintaining the resilience of single species to external pressures. Such variation could potentially be indicated by the genetic structure of species populations. For practical reasons, we assume that population size is a
reasonable proxy for genetic variation and hence include indicator 1.2.1 in our evaluation.
Diversity among species indicates that all different species within an ecosystem remain in vital populations. It would also be reflected by distributional range of various species, and for this reason we include indicator 1.1.1 in our analysis. Diversity between ecosystems requires conservation of different features that characterize an ecosystem in relation to other ecosystems. It thus reflects the extent to which the ecosystem structure of the Baltic Sea and the North East Atlantic is maintained in terms of species composition, productivity, habitat distribution and physical/chemical conditions. Ecosystem structure is
described by indicator 1.7 but we find that 1.6.1, 1.6.2 and 1.6.3 in combination with the two previously mentioned indicators are more practical to evaluate and may serve as proxy indicators of maintained ecosystem structure and function.
Table 5.2. Evaluation of indicators for GES descriptor D1.
GES descriptor: D1 Biological diversity is maintained. The quality and occurrence of habitats and
the distribution and abundance of species are in line with prevailing physiographic, geographic and climatic conditions.
Ecosystem service: S4 Diversity
Criterion Indicator Evaluation: What
indicators are most relevant for describing the
ecosystem service S4 Diversity with regard to the human activities studied in this synthesis?
1.1 Species distribution 1.1.1 Distributional range
x
1.1.2 Distributional pattern within thelatter, where appropriate
1.1.3 Area covered by the species (for sessile/benthic species) 1.2 Population size 1.2.1 Population abundance and/or
biomass, as appropriate
x
1.3 Population condition 1.3.1 Population demographic characteristics (e.g. body size or age class structure, sex ratio, fecundity rates, survival/mortality rates) 1.3.2 Population genetic structure, where appropriate
1.4 Habitat distribution 1.4.1 Habitat distributional range 1.4.2 Habitat distributional pattern 1.5 Habitat extent 1.5.1 Habitat area
1.5.2 Habitat volume, where relevant 1.6 Habitat condition 1.6.1 Condition of the typical species
and communities
x
1.6.2 Relative abundance and/or
biomass, as appropriate
x
1.6.3 Physical, hydrological and
chemical conditions
x
1.7 Ecosystem structure 1.7.1 Composition and relative proportions of ecosystem
components (habitats and species)
5.1.2 Selection of indicators for D5 Eutrophication
The GES eutrophication descriptor D5 includes 8 indicators. Table 5.3 shows which indicators are judged to be relevant for describing the ecosystem service R3 Eutrophication mitigation with regard to the human activities studied in this synthesis. The selection is motivated below and is primarily based on the B report.
An excess discharge of nutrients to the sea is the basis for eutrophication and the indicator for nutrient concentrations (5.1.1) is consequently relevant to consider. The actual nutrient concentration does not necessarily indicate if eutrophication is present or not (e.g. consider high nutrient – low chlorophyll regions). Eutrophication is the accumulation of nutrients in the water. Rather than studying actual nutrient concentrations, it is therefore more interesting to consider the deviation of the nutrient concentration from a “natural”
concentration, or to look for trends in the nutrient concentration to determine if nutrients are accumulating or not.
Ratios between nitrogen, phosphorus and silica, indicator 5.1.2, give information about what nutrient is limiting. For example, the nitrogen to phosphorus ratio N/P affects cyanobacteria blooms, which are of relevance to marine recreation.
Eutrophication is often defined as an accumulation of nutrients in the water and an excessive growth of phytoplankton. Chlorophyll concentration, which is easily measured, is used as a proxy for phytoplankton biomass. The indicator chlorophyll concentration is therefore relevant to describe eutrophication. Water transparency is closely related to chlorophyll concentration and hence relevant to consider when dealing with eutrophication.
Indicator 5.2.4, shift in floristic composition, includes bloom events of nuisance/toxic algal blooms. For marine recreation activities close or in the water, algal blooms are a big nuisance. For this indicator only algal blooms are considered.
Abundance of perennial seaweeds and seagrasses adversely impacted by decrease in water transparency, indicator 5.3.1, is closely related to chlorophyll concentration in the water and to nutrient concentrations.
Dissolved oxygen is also marked as a relevant indicator. When biomass decays oxygen is consumed and low oxygen levels or hypoxia occurs. Just as for nutrient levels, the oxygen level needs to be considered relative to natural or undisturbed conditions as there are areas that are naturally low in oxygen. The objective of this study is not to analyse eutrophication and all of its indicators but rather to use a few of them to determine the status and trend of the ecosystem service with regard to the relevant maritime activities. We will therefore concentrate on nutrient levels (5.1.1), the reason that eutrophication occurs, and on toxic algal blooms (included in 5.2.4), which are the most obvious way that eutrophication affects marine recreation.
Table 5.3. Evaluation of indicators for GES descriptor D5.
GES descriptor: D5 Human-induced eutrophication is minimised, especially adverse effects
thereof, such as losses in biodiversity, ecosystem degradation, harmful algae blooms and oxygen deficiency in bottom waters.
Ecosystem service: R3 Eutrophication mitigation
Criterion Indicator Evaluation: What
indicators are most relevant for describing the
ecosystem service R3 Eutrophication mitigation with regard to the human activities studied in this synthesis?
5.1 Nutrients level 5.1.1 Nutrients concentration in the
water column
x
5.1.2 Nutrient ratios (silica, nitrogen and phosphorus), where appropriate 5.2 Direct effects of
nutrient enrichment
5.2.1 Chlorophyll concentration in the water column
5.2.2 Water transparency related to increase in suspended algae, where relevant
5.2.3 Abundance of opportunistic macroalgae
5.2.4 Species shift in floristic composition such as diatom to flagellate ratio, benthic to pelagic shifts, as well as bloom events of nuisance/toxic algal blooms (e.g. cyanobacteria) caused by human activities
x
5.3 Indirect effects of nutrient enrichment
5.3.1 Abundance of perennial seaweeds and seagrasses (e.g. fucoids, eelgrass and Neptune grass) adversely impacted by decrease in water transparency 5.3.2 Dissolved oxygen, i.e. changes due to increased organic matter decomposition and size of the area concerned
5.1.3 Selection of indicators for D8 Contaminants
The GES descriptor D8 includes 3 indicators. Table 5.4 shows which indicators are judged to be relevant for describing the ecosystem service C2 Scenery with regard to oil spills. The selection is motivated below and is primarily based on the C report.
Oil spills give rise to several environmental impacts – one of them being a distinct impact to the coastal scenery in the affected area for a period of time. Indicator 8.2.2 in Table 5.4 captures this impact, whereas indicators 8.1.1 and 8.2.1 rather describe non-visible effects from oil spills. Changes in the latter two indicators, however, might in the long run perhaps lead to visible impacts, but we judge indicator 8.2.2 to be the most relevant indicator for describing impacts to the coastal scenery. Further, indicator 8.2.2 might also be a good
starting point for describing also expected impacts to other ecosystem services from oil spills – if there is no occurrence of significant acute oil spills, it will be reflected in this indicator. If there are many significant acute oil spills, it will perhaps be reflected in this indicator first.
Table 5.4. Evaluation of indicators for GES descriptor D8.
GES descriptor: D8 (Concentrations of contaminants are at levels not giving rise to pollution
effects.)
Ecosystem service: C2 Scenery
Criterion Indicator Evaluation: What
indicators are most relevant for describing the ecosystem service C2 Scenery with regard to the human activities studied in this synthesis? 8.1 Concentration of
contaminants
8.1.1 Concentration of the contaminants mentioned above, measured in the relevant matrix (such as biota, sediment and water) in a way that ensures comparability with assessments under Directive 2000/60/EC
8.2 Effects of contaminants
8.2.1 Levels of pollution effects on the ecosystem components concerned, having regard to the selected biological processes and taxonomic groups where a cause/effect relationship has been established and needs to be monitored 8.2.2 Occurrence, origin (where possible), extent of significant acute pollution events (e.g. slicks from oil and oil products) and their impact on biota physically affected by this pollution
x
5.1.4 Selection of indicators for D10 Marine litter
The GES descriptor D10 deals with marine litter. Here we select the indicators that are relevant for the ecosystem service C2 Scenery in terms of the relevant maritime activities, see Table 5.5. The selection of indicators is therefore primarily determined by the visual aspect of marine litter, and based on the analysis in the B report. The indicators that capture the visual aspect are indicators 10.1.1, marine litter washed ashore or deposited on the coastlines, and 10.1.2, amount of litter in the water column or deposited on the sea floor. Most of the marine recreation activities take place at the coast and we therefore choose to focus the further analysis on the indicator for marine litter on land,