Study of the Fish Communities
at Lillgrund Wind Farm
Final Report from the Monitoring Programme for Fish and Fisheries 2002–2010
Swedish Agency for Marine and Water Management Date: 2013-12-01
The studies were carried out by the organisation that was then called the National Board of Fisheries on behalf of Vattenfall Vindkraft AB.
Key words: Offshore wind power, acoustics, fish communities, benthic fish, silver eel, artificial reef, cumulative effects, Öresund Strait
Recommended format for citation:
Bergström L, Lagenfelt I, Sundqvist F, Andersson I, Andersson M H, Sigray P, 2013. Study of the Fish Communities at Lillgrund Wind Farm – Final Report from the Monitoring Programme for Fish and Fisheries 2002–2010. On behalf of Vattenfall Vindkraft AB. Swedish Agency for Marine and Water Management, Report number 2013:19, 134 pp, ISBN 978-91-87025-43-3.
To order a copy please contact:
Swedish Agency for Marine and Water Management Box 11930, 404 39 GÖTEBORG
Telephone: +46 (0)10-696 60 00
The report can be downloaded (as a PDF file) from the Swedish Agency for Marine and Water Management website: www.havochvatten.se
and Vattenfall’s website: http://www.vattenfall.se/sv/lillgrund-vindkraftpark.htm Editor (legally responsible): Björn Risinger
Cover photograph: Lillgrund Wind Farm. Mathias H. Andersson © ISBN 978-91-87025-43-3
The National Board of Fisheries reference number : Göteborg: 36-2536-01 and 124-2121-05 The Swedish Agency for Marine and Water Management reference number: 3341-13 The Swedish Agency for Marine and Water Management
Box 11 930, 404 39 Göteborg www.havochvatten.se
Study of the Fish Communities at Lillgrund Wind
Farm
Final Report from the Monitoring Programme for
Fish and Fisheries 2002–2010
Lena Bergström – Department of Aquatic Resources, Swedish University of Agricultural Sciences
Ingvar Lagenfelt – Swedish Agency for Marine and Water Management Frida Sundqvist – Department of Aquatic Resources, Swedish
University of Agricultural Sciences
Ingemar Andersson (editor) – Swedish Agency for Marine and Water Management
Mathias H. Andersson – Department of Zoology, Stockholm University / Swedish Defence Research Agency, FOI
Peter Sigray – Swedish Defence Research Agency, Department of Underwater Technology, FOI
Translation to English was carried out by Vikki Bengtsson, Pro Natura Swedish Agency for Marine and Water Management Report 2013:19
Foreword
Wind power is a renewable source of energy and its development can
contribute to the achievement of several environmental targets. Consideration must also however, be taken regarding the location, design and impact on human health and the environment.
An EU Directive to promote the use of renewable energy (2009/28/EG) has been in place since the beginning of 2009. In Sweden, this Directive in practice means that the amount of renewable energy used, should increase by 49 % by 2020. Sweden has set a target of 50 percent (Prop. 2008/09:163).
In 2009, the Swedish Parliament established a planning framework for wind power, which means that by 2020, there should be plans in place to build wind farms with an annual production of 30 TWh per year, of which 20 TWh should be on land and 10 TWh offshore (Prop 2001/02:143, NU 2001/02:17, rskr 2001/02:117). Wind power has increased significantly in recent years from 0.05 TWh in 1993 to 7.2 TWh in 2012.
The development of wind power requires planning, consultation, monitoring and supervision, but also new knowledge. The responsibility for this is shared between a number of different government agencies, including the Swedish Agency for Marine and Water Management.
Lillgrund Wind Farm began operation in 2008, and it is currently the largest offshore wind farm in operation in Sweden.
The monitoring programme at Lillgrund has made a valuable contribution to the increase in the understanding of the impact of offshore wind farms on fish communities. The programme has also put focus on the need for studies over a longer period of time, as well as on the cumulative impact on for example migratory fish such as silver eel.
The Swedish Agency for Marine and Water Management hopes that the report will provide an important source of information for environmental impact assessments as well as for the planning and licensing processes for wind power. The Swedish Agency for Marine and Water Management would like to thank all of those who have contributed during the long period, which this project has been undertaken.
Göteborg November 2013, Björn Sjöberg Director, Department for Marine and Water Management
SUMMARY ... 9 Acoustics (sound) ... 9 Benthic Fish ... 10 Pelagic Fish ... 12 Fish Migration ... 13 Conclusions ... 14 INTRODUCTION ... 15
Offshore Wind Power in Sweden ... 15
The Impact of Wind Power on Fish and Fishing ... 15
Study Design ... 17 Wind Farm ... 19 Final Report ... 21 ACOUSTICS ... 22 Introduction ... 22 Fish Hearing ... 23
How Fish are Affected by Noise ... 26
General Noise Environment in the Öresund Strait ... 27
Noise Production from Wind Turbines in Water ... 28
Method ... 29
Acoustic Equipment and Implementation ... 29
Data Analysis ... 30
Results ... 31
Ambient Noise at Sjollen ... 31
Wind Turbine Noise... 33
Noise from the Entire Wind Farm ... 34
What do Fish Hear? ... 37
Discussion ... 37
The Contribution Made by the Wind Farm ...38
The Impact of Noise on Fish ...38
Assessment of the Situation at Lillgrund ... 40
BENTHIC FISH ... 42
Introduction ... 42
Expected Impact ... 42
The Fish in the Öresund Strait ... 43
Method ... 43
Fish Sampling Areas ... 44
Fish Sampling Method ... 44
Discussion ... 73
PELAGIC FISH ... 76
Introduction ... 76
Expected Impact ... 76
Method ... 77
Commercial Fishing Catch Statistics ... 77
Fisheries independent statistics ... 78
Results ... 78
Catch Statistics from Commercial Fishing ... 78
Statistics Independent of Commercial Fishing ... 82
Discussion ...83
FISH MIGRATION... 86
Introduction ... 86
Expected Impact ... 86
The Impact of Sound and Magnetic Fields on Eel ... 87
Method ... 89
Active Telemetry ... 89
Passive Telemetry ... 90
The Eels ... 94
Data Processing and Statistical Analyses ... 96
Results ... 98 Baseline Study ... 98 Production Phase ... 98 Passage Pattern ... 99 Migration Time ... 107 Passage Time ... 111
Passage Times in Relation to the Length of the Eels and Water Currents. ... 111
Discussion ... 113
OVERARCHING DISCUSSION ... 117
THANK YOU... 123
REFERENCES ... 124
Summary
In 2001, the Swedish Government authorised the construction of an offshore wind farm at Lillgrund in the Öresund Strait between Denmark and Sweden. In 2002, the Environmental Court defined the final terms and conditions for the wind farm development and the extent of the monitoring programme required.
Lillgrund wind farm came into full operation in 2008, and is currently the largest offshore wind farm in operation in Sweden.
The Swedish National Board of Fisheries conducted a monitoring programme, in the area, in the years before (2002–2005) and after (2008– 2010) the construction of the wind farm; a base line study and a study when the wind farm was operational, respectively. No investigation was conducted during the construction phase. The aim was to investigate the impact of the wind farm during the operational phase on the benthic and pelagic fish as well as on fish migration. These studies have partly been integrated into work conducted as a part of the Vindval Research Programme, funded by the Swedish Energy Agency.
Acoustics (sound)
• The overall sound energy from the wind farm under water is mainly generated by vibration from the gearbox.
• An analysis of the sound pressure level for the wind farm area, showed a correlation between noise level and the number of turbines in the wind farm (the so called park effect), where each individual turbine helps to increase the overall noise level in the area.
• Sound measurements from Lillgrund wind farm showed that noise levels within a distance of 100 metres from a turbine at high wind speeds are high enough to be a risk for some species of fish to be negatively affected, e.g. in the form of direct escape behaviour, or masking of vocal
communication between individuals.
• Stress reactions can also occur at distances of more than 100 metres from a turbine. This is due to the fact that the noise from the turbines is continuous and louder than the ambient noise levels within some frequencies.
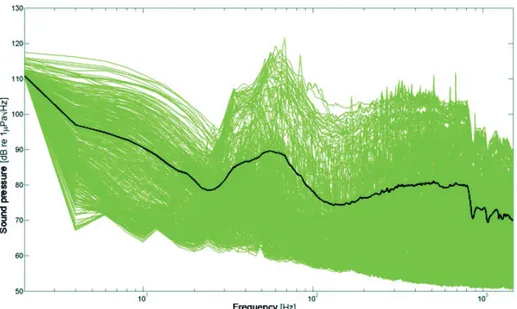
Measurements of the underwater noise levels were carried out at varying distances from individual turbines, from longer distances away from the entire wind farm as well as within a reference site (Sjollen) 10 km north of the wind farm. The results show that the wind farm produces a broadband noise below 1 kHz as well as one or two tones where the 127 Hz tone is the most powerful (vibrations from the first stage in the gear box). The majority of the overall underwater sound energy from the wind farm lies around the tone of 127 Hz.
The maximum noise levels, generated by the wind turbine, working at full production (12 m/s), at 1 m were 136 dB re 1µPa(RMS) for the dominant tone of
the turbine which was 127 Hz (integrated across 123–132 Hz) and 138 dB re 1µPa(RMS) at the full spectrum (integrated across 52–343 Hz). At a distance of
100 m from the turbine, the noise levels are reduced to 104–106 dB re 1µPa(RMS) across the full spectrum, which is close to the locally measured
ambient noise in the Öresund Strait, but the noise level was still around 23 dB above the background level for the 127 Hz tone.
An analysis of the sound pressure level for the wind farm area showed a correlation between noise level and the number of turbines in the wind farm (called the park effect). Close to the wind farm (<80 m), the noise environment was dominated by the individual wind turbine with a calculated sound
propagation loss of 17•log (distance). At greater distances (80 m to 7000 m) the sound propagation loss was non-linear and less than 17•log (distance). This is explained by the fact that the other turbines in the wind farm contributed to the total noise level. At even greater distances (>7 km) the entire wind farm
functioned as a point source and the sound propagation loss was once again measured as 17•log (distance).
The noise levels equivalent to those recorded and calculated from Lillgrund wind farm have not been shown to cause any physical injury to fish according to the current published scientific literature. It was only within some 100 metres from a turbine at high wind speeds that the noise levels were high enough to result in the risk of negative effects on some species of fish in the form of direct escape behaviour or possible masking of communication. The response depends upon the individual species’ sensitivity to sound. Fish have been shown to become stressed when they find themselves in a consistently noisy environment, which in turn can result in for example, lower growth rates or can have an impact on reproduction. Stress in general can also, in
combination with other negative factors, make them more susceptible to disease etc., due to an impaired immune system. Animals can choose however, to remain in an area despite the disturbance, if the area is sufficiently
important for their survival or reproduction.
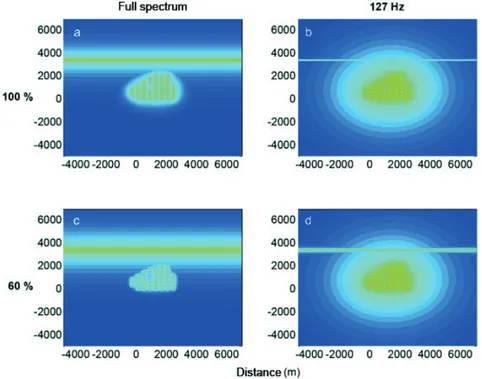
Based on the calculated sound propagation around the wind farm, salmon and eel could theoretically detect the 127 Hz tone at 250 m and 1 km distances respectively at a productivity rate of 60 and 100 %, which is equivalent to a wind speed of approximately 6 and 12 m/s. The calculated distances would be limited by the hearing ability of both fish species and not the background noise levels in the Öresund Strait. For herring and cod, the theoretical detection distance was calculated to be between 13 and 16 km respectively for a production rate of 60 and 100 %. This distance should have been greater, but is limited for these species due to the ambient noise levels in the area. These calculations indicate that fish can potentially detect sound from the wind farm at relatively long distances. Local variations with regard to depth and physical barriers such as peninsulas, e.g. Falsterbonäset in the southern end of the Öresund Strait, can however, have a large impact on the actual sound propagation.
Benthic Fish
• The temporal development of the fish community in Lillgrund was similar to that observed in the reference areas during the study period. For the wind farm as a whole, no effect was observed on species richness, species composition or on the abundance of fish.
• Several species of fish however, showed an increase in abundance close to the wind turbines compared with further away, especially eel (yellow eel) (Anguilla anguilla), cod (Gadus morhua), goldsinny wrasse (Ctenolabrus rupestris) and shorthorn sculpin (Myoxocephalus
scorpius). The results reflect a redistribution of fish within the wind
farm, rather than a change in productivity or migration from
surrounding areas. The increase in abundance is probably due to the wind turbine foundations providing an opportunity for protection and improved foraging. The distance within which an increased abundance could be observed was estimated, for different species, to be between 50– 160 metres from a wind turbine.
• Fish distribution may to some extent have been influenced by the local acoustic environment, as a lower degree of aggregation close to the wind turbines at higher noise levels. The effect was most obvious for eelpout and eel (yellow eel). No response was seen for cod in relation to sound levels. Changes in the species composition of the fish communities over time were studied in comparison with two reference areas. Of these, the northerly reference area (Sjollen) had a larger marine component than the southern reference area (Bredgrund). The species composition at Lillgrund had similarities with both of the reference areas.
The results from fish sampling with fyke nets and gill net series indicate that there have been no significant changes in the number of species, the species composition or the fish abundance after the wind farm was built, looking at the wind farm as a whole. Some changes have however been noted in relation to individual species. An increased catch of shore crab and eel (yellow eel) was observed during the first two years of production, but not in the third year. The catch of eelpout increased in all areas during the period studied, but to a slightly lesser extent at Lillgrund when compared to the reference areas. For the other species, the changes observed at Lillgrund were similar to at least one of the reference areas. These results suggest that the fish communities within the wind farm were primarily affected by the same general environmental conditions as the fish communities within the reference areas, rather than by the effects of the wind farm.
An analysis of the distribution patterns of fish close to the turbines showed an increased abundance in the immediate vicinity of the wind turbines in four of the eight species of fish studied: specifically shorthorn sculpin, goldsinny wrasse, cod and eel (yellow eel). The effects were seen already after the first year and were similar over all three years studied. An effect was also identified for eelpout, but only in 2010. The aggregation effect was seen within a distance of 50–160 metres from the wind turbines, different for the different species.
A comparison of the relative effect of different factors, based on the data from an extended survey in 2010, showed that the observed distribution pattern could be explained to a larger extent by the presence of the turbines rather than the underwater topography of the area. The analysis also indicated weak effects of the local acoustic environment on fish distribution patterns, with a reduced presence of fish at higher noise levels. The response was
strongest for eelpout and eel. No response in relation to noise level was seen for cod. For shorthorn scuplin and common shore crab a response was seen only
during the autumn. The magnitude of the effect of noise was, however, lower than the aggregation effect. Hence, fish aggregated close to the wind turbines in all conditions, but the effect was weaker when the noise levels were higher.
It is recommended that the the wind farm area is reinvestigated after a number of years to follow the long-term development of the fish populations, and to see if the aggregation effect observed continues and potentially also increases over time. A prerequisite for a long term positive development of fish abundance is that the removal of fish, such as from fishing or predation by marine mammals and fish-eating birds, does not increase in the area.
Pelagic Fish
• There was a dramatic increase in commercial fishing for herring north of the Öresund Link (close to the north of the wind farm) in the first years of operation of the wind farm, in contrast to south of the bridge that forms a part of the Öresund Link, where it virtually completely stopped. This change may imply that the Rügen herring migration was affected by the Lillgrund Wind Farm. Due to the fact that there were other factors in addition to the wind farm contributing to the herring movements, it proved difficult to identify any correlation.
The evaluation was based on catch statistics from the commercial fisheries in the Öresund Strait (ICEs subdivision SD 23) and fisheries independent statistics from ICES for adult herring (Rügen herring) (ICES subdivision SD 21–23, western Baltic Sea and southern Kattegatt) and density of juvenile fish (ICES subdivision SD 24).
There was a dramatic increase in commercial fishing for herring north of the Öresund Link in the first years of operation of the wind farm, in contrast to south of the bridge where it virtually completely stopped. The reason may be largely explained by the regulations banning drift-net fishing and a favourable market for herring, but potentially also because of the Öresund Link which was completed in 2000.The potential impacts of the wind farm are therefore difficult to distinguish from the impacts of these other factors because detailed resolution in the catch statistics are missing from the years before 1995 prior to the start of the building work on the Öresund Link.
The statistics independent of commercial fishing from ICES showed no significant correlation between the density of herring juveniles in the western Baltic Sea and the number of adult herring (3 years old or more) in the following years in the Öresund Strait (ICES SD 21–24). There was however a weak tendency towards a negative development of the fish population over the period 1993 – 2010. The presence of Rügen herring and their migration through the Öresund Strait is likely strongly influenced by the fact that the population shows large fluctuations between the years. In addition, there is a possible overlapping effect on the soundscape from the wind farm and the Öresund Link, which has been in use since 2000.
Overall, the variety of factors together mean that it is difficult to identify any clear results with regard to if the migration of Rűgen herring is influenced by Lillgrund wind farm.
Fish Migration
• According to the results from this work, the wind farm at Lillgrund is not a barrier for the migration of the eels that come into contact with it. An equally large proportion of the tagged and released silver eels
(approximately one third) passed the transect line with receivers, at Lillgrund both before the wind farm was constructed (baseline study) and after it was in operation.
• There was no statistically significant difference indicating any alteration in the migration speed of eels, but there were occasional longer migration times when the wind farm was working at higher levels of production (>20 % of maximum) which may indicate that some eels are affected by the wind farm. The fact that the eels also showed a tendency towards being noted on fewer occasions than expected within the wind farm at low productivity (<20 %) and on slightly more occasions than expected at higher productivity (>20 %), could indicate that they have greater difficulty in navigating past the wind farm at higher levels of productivity than lower.
The impact of the wind farm on migration was studied via tagging of migrating silver eels. In total, 300 acoustically individually tagged eels were included in the study and of these, 100 contributed with useable information. The baseline study period started on a small scale in 2001 and ended in 2005. The majority of the eels were tagged and monitored during the production period (2008– 2010). All tagged silver eels were released south of the wind farm.
The results showed that an equally large proportion of the tagged and
released silver eels; approximately one third, passed a transect with receivers at Lillgrund wind farm, both during the baseline period 2001–2005, and when it was in production 2008–2009. The greatest proportion of eels passed through the deeper part of the transect by the navigation channel Flintrännan close to the Danish border at Drogden during the production phase (31 %) and baseline period (43 %). A somewhat larger proportion of the eels were registered
passing the most easterly part of the transect, close to Klagshamn, during the production phase (14 %) compared with the baseline period (5 %). A behaviour which occurred during the production phase, was that some individuals moved back to the release site, after being in the vicinity of wind farm. The most commonly observed behaviour during the study in 2010 was that an eel was registered moving south of the wind farm in a more or less northerly direction, but without being registered to the north of the wind farm.
The range in the time taken for the movement of the eels from the release site to the transect running through the wind farm was very great, from four to more than 1000 hours. There was no statistically significant difference in the time taken to travel, between periods with low production (<20 % of
maximum) and periods with high production (>20 %) or for individuals which passed through or outside of the wind farm.
Even if the eels did not show any statistically significant behaviour, changes in movement patterns may occur for some individuals. The fact that there was a tendency towards longer periods of time taken for movement at higher
production levels (not statistically significant) (>20 %) could indicate that some individual eels are influenced by the wind farm. The proportion of eels that took more than a week (168 hours) to make the journey was 48 % during
the period with higher production (>20 %) compared with 28 % at lower production. No significant difference in the proportion of passes within or outside of the wind farm respectively could be shown. The eels showed however, – a tendency of being recorded on fewer occasions than expected inside the wind farm at low production levels (<20 %) and on more occasions than expected at higher production levels (>20 %). The irregularities in the proportions, compared with the expected result, could indicate that individual eels stayed longer in the wind farm when it was functioning at higher
productivity. If the eels discover the wind turbine only when they are very close and do not change course, then other factors such as the speed of the current across the shallow marine areas become significant and can mean that the time spent in the area is shorter and records fewer. At high productivity, the eels may hesitate and/or divert their course and be recorded from close to or within the area, to then be recorded on the transect outside of the wind farm.
The mechanisms that lie behind the possible impact from the
electromagnetic field or the noise pattern are difficult to distinguish, as both can have an impact on the same areas. Travelling speed showed no linear relationship with the level of production in the wind farm.
Conclusions
The study at Lillgrund has resulted in an increase in the understanding of how offshore wind farms can affect fish, which is very valuable. Even within an international context, there are currently very few experience-based studies of offshore wind farms in operation.
The results from three years of monitoring during the operational phase show that the effects of the wind farm on fish populations and fishing were limited. One of the clearest results showed that some benthic fish species were attracted to the foundations of the wind turbines with their associated scour protection (reef effect). In addition, the effect on the local noise environment in the form of increased noise in the Öresund Strait was documented. The results of the eel tracking study may indicate that some eels are influenced by the wind farm on their migration. Some care should be taken however, when applying the results of these studies in other offshore environments and on a larger scale. The monitoring has only been carried out for three years and thus reflects only a short-term perspective. Lillgrund wind farm is also one of the first large-scale wind farms and is situated in an area with regular and noisy shipping traffic and both frequent and large variations in environmental factors such as salinity and currents.
A key knowledge gap that remains after the completion of this work is the lack of studies over a longer period of time, to help identify the long term ecological effects of, for example, the reef effect. Ideally, the wind farm should be re-visited after a number of years to see how the fish populations have developed over the longer term, and see if the observed aggregation of certain fish species close to the wind turbines continues, and to possibly see if any quantitative effects have taken place. Studies are also required in relation to how stress may affect fish species/individuals which choose the reef-like foundations and their noisier environment. Additional studies, primarily for the Baltic Sea, are also required to establish if there are any cumulative effects on migratory fish such as silver eels.
Introduction
In 2001, the Swedish Government authorised the construction of a wind farm at Lillgrund in the Öresund Strait. (Department of the Environment, reference no.r. M1998/2620/Na). In 2002, the Environmental Court defined the final terms and conditions for the development (Växjö Court, case no. M 416-01). In the planning conditions (condition no.5) the
Government stated that a monitoring programme on the impact of the wind farm on the fish populations and fishing within the development area should be undertaken. The studies that have been undertaken within the monitoring programme to identify potential impacts on fish populations and fishing include both a period before the development of the wind farm and after the wind farm was in production.
The programme began with a baseline study over the period 2002–2005 (Lagenfelt et al. 2006). Lillgrund wind farm came into full operation at the beginning of 2008. This report is a compilation of the results from the studies that have been carried out during the wind farm’s first three years of
operation 2008–2010, as well as how these relate back to the period before the wind farm was established.
Offshore Wind Power in Sweden
Both on and offshore wind power is planned to contribute a significant part when the increased requirement for renewable energy sources are to be met, both nationally and internationally. The majority of the wind farms in Sweden are currently based on land, because offshore wind farms are more expensive to build and run. At the end of 2010 there were in total, 71 offshore wind farms with an operating capacity of of 163.4 MW (of which Lillgrund wind farm contributes 48 turbines and just over 110 MW) (The Swedish Energy Agency, Wind Power Statistics, 2010).
There are however, a large number of wind farms that have planning permission, but have not yet been built (September 2011, a total of 349 turbines with 1715 MW, divided over seven wind farms). Five of these wind farms are situated along the Swedish coast in the Baltic Sea proper. In the Baltic Sea proper, there are also plans for an additional three very large wind farms, including a total of up to 1200 turbines, with an operating capacity of approximately 3 800 MW and a production of approximately 12 TWh (two in the Bight of Hanö, Taggen and Blekinge Offshore, and one in the Södra Midsjöbanken).
The Impact of Wind Power on Fish and Fishing
The National Board of Fisheries has previously, as a part of a government initiative in 2006, published a review of the current knowledge of the impact of offshore wind farms on fish populations and fishing (Bergström et. al. 2007).
An offshore wind farm goes through three separate phases during its lifetime which vary in the character and extent of impact.
1. Construction phase, this is calculated to take from one to several years for larger wind farms.
2. Production phase, which is expected to last at least 20–30 years. 3. Decommissioning phase.
The impact from the construction phase is to a large extent similar to other types of building work offshore, with noise (the most intensive noise occurs when the piles for the turbine foundations are being driven down into the sea bed) and the dispersion of sediment in the water column. The knowledge regarding the impacts of building in water is quite extensive with a relatively large quantity of peer reviewed scientific publications. The impact during the decommissioning stage is considered to result in similar sorts of disruption as under the construction phase.
Experience-based studies from offshore wind farms in operation are, in contrast, few (see Wilhelmsson et al. 2010, for a summary). Lillgrund is the largest offshore wind farm in operation in Sweden.
Compilations of the environmental impacts of offshore wind power are continually being published on an international basis and in relation to
environmental impact assessments. The latest knowledge needs however to be updated based on recent experience, due to the fact that the last large review was published around 2006–2007 (Zucco et al. 2006, Åslund et al. 2006, Bergström et al. 2007). Several wind farm projects from several countries can be followed in current reports, e.g.
• Belgian (http://www.mumm.ac.be/EN/Management/Sea-based/windmills.php),
• British COWRIE-project (www.offshorewind.co.uk),
• Danish (http://www.ens.dk/da-DK/UndergrundOgForsyning/ VedvarendeEnergi/Vindkraft/Havvindmoeller/Sider/Forside.aspx), • Dutch Nordzeewind (www.noordzeewind.nl), and
• German wind farm project (www.bsh.de/de/Meeresnutzung/ Wirtschaft/Windparks/index.jsp).
During the production phase, the primary potential impact is related to aspects of changes in habitat, partly as a consequence of the creation of new habitat consisting of the wind turbine foundations and scour protection, partly as a consequence of loss of habitat due to a change in the noise environment (an increased noise level) or electromagnetic environment (alteration in
electromagnetic fields from cables on the sea bed). In some circumstances the
potential risk of the impact of a change may be in terms of the light
environment (shade and reflections from the turbines and rotor blades) as
well as changes in currents (by hindering and redirecting existing water
currents), but these impacts are likely to be very low on fish.
Changes, primarily in relation to the noise environment and
electromagnetism could reduce the quality of the habitat for fish, but also be negative for fish species that use noise and the earth’s magnetic field for navigation. The creation of new physical structures may result in an increase in
the aggregation of fish in the area, because the structures provide improved opportunities for protection and foraging. The wind farm may also come with
fishing restrictions of varying magnitude, in the form of the equipment that
may be used and possibly even limitations in access, which can have direct economic consequences for those fishermen that are affected, as well as potentially on the fish population development. New restrictions on the fisheries are however, not planned in the Lillgrund Wind Farm area. In addition to these effects, changes in other parts of the ecosystem may lead to indirect ecological effects on fish, and the fish may, in turn, affect other components of the ecosystem. There is also a risk that new structures on the sea bed can provide habitat for invasive (non-native) species.
Overall, the cumulative effects may arise when larger and larger parts of the marine environment are exploited for wind power etc., even if the effects are not significant from the individual cases. (Berkenhagen et al. 2010).
Study Design
The monitoring programme has been designed to evaluate the impact of the wind farm, when in production, on the fish fauna, by comparing the situation in the years before and after construction. The studies have been carried out for at least three years before and after construction respectively, in order to be able to usefully establish the magnitude of the natural variations. In order to see if any observed differences are dependent on the proximity of the wind farm or on other external factors, equivalent studies have also been undertaken on reference areas; Bredgrund, south of Lillgrund and Sjollen north of
Lillgrund and the Öresund Link with its bridge.
The basic proposal for the monitoring programme included a range of different elements. In table 1, the sampling schedule is presented for the entire study period (2002–2005 and 2008–2010 respectively). No studies were undertaken during the construction phase. The programme has to some extent been modified over time, in order to incorporate experience developed over the course of the project. The potential impact of the wind farm, in the longer term, is not covered by the monitoring programme, which only covers the first three years of production.
During the production phase, studies of the underwater sound (acoustic studies) were undertaken, fish sampling directed at bottom-living fish and studies of the migration patterns of eel (studies using telemetry). Studies of the pelagic fish have been included by analysing commercial fishing catch statistics for the Öresund Strait as well as analysis of the more independent ICES fishing data for a larger sea area.
Table 1. Overview of the studies carried out within the monitoring programme for Lillgrund wind farm (L). The studies have in some cases been integrated with studies within the framework of the Vindval – Research Programme (V). In Italics: Baseline only
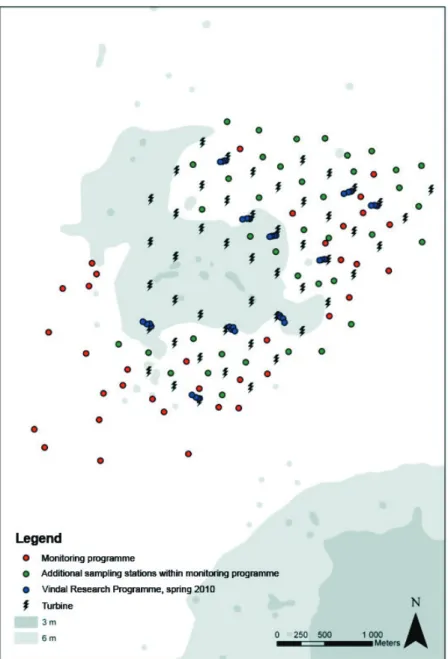
Baseline Constr. Operational phase 2001 2002 2003 2004 2005 2006 2007 2008 2009 2010 Noise Acoustic Measurements L V V Benthic Fish Fish Sampling, Spring (Fyke Nets) L L L L LV LV LV Fish Sampling, Autumn (Fyke Nets) L Fish Sampling, Autumn (Gill Nets) L L L L L L Fish Sampling Targeting Spawning Grounds L L L Habitat Mapping L Pelagic Fish Commercial Fishing Catch Statistics L L L L L L L L Acoustic Survey L L L Fish Migration Eel Telemetry L L L L L V LV L
The number of fish sampling stations using fyke nets increased from 24 to 36 in 2005. In 2010, fish sampling with fyke nets was also undertaken in the autumn, and the fish sampling with gill net series was not continued. The number of fyke net sampling stations was increased from 36 to 76. The aim with the changes was to obtain a better picture of the distribution of the fish in the vicinity of the turbine, and complement the studies of the distribution effects undertaken within the Vindval Research Programme. As a consequence of using the same equipment for fish sampling in the spring and the autumn, it was also possible to compare the presence of different fish species between the two seasons. This was particularly interesting in relation to the presence of common shore crab, which has become more common in the Öresund Strait over the last decade or so.
Fish sampling using gill net series in the autumn was significantly disturbed by the heavy presence of shore crab, which may partly have influenced the results. It was however assessed, that it was appropriate to continue to carry out this sampling technique up to and including 2009.
The planned vegetation mapping was abandoned, because it was deemed as not being feasible to undertake this in a technically equivalent manner across the entire area.
Targeted fish sampling for specific species that may have used Lillgrund as spawning grounds was previously included as a part of the baseline studies. Sampling targeting spawning populations of turbot was carried out between 2002 and 2004 and of lumpfish in 2003–2004. The fishing was severely disrupted however by drifting algae in all years, primarily at Lillgrund and Bredgrund. This disturbance continued despite attempts to alter the time of the fish sampling period. Due to the level of disturbance, it has not been possible to obtain reliable baseline data for a study to see whether the wind farm at Lillgrund has had an impact on the spawning of turbot and lumpfish. This fish sampling was thus abandoned after 2004. A description of the results available from the fish sampling targeting
spawning populations which was carried out, is available in the report from the baseline studies (Lagenfelt et al. 2006).
The impact of the construction of the wind farm at Lillgrund on pelagic fish was studied during the baseline studies with hydroacoustics (Lagenfelt et. al. 2006). The studies were primarily aimed at quantifying the pelagic fish within the open water and were partly intended to be associated with the Rügen herring migration between spawning and nursery grounds. An analysis of the statistical strength of the studies showed however, that the likelihood of identifying even large changes in the quantity of pelagic fish after the wind farm was in production was low.
The activity involving hydroacoustics was replaced with an analysis of commercial fishing catches of herring in the Öresund Strait (catch area SD 23), as well as an analysis of ICES studies of herring juveniles and
reproductively mature herring in the western Baltic Sea and southern Kattegatt (catch area SD 21–24).
Wind Farm
Lillgrund wind farm is situated approximately seven kilometres out from the Swedish coast and seven kilometres southeast of the Öresund Link with the Öresund Bridge. The wind farm consists of 48 wind turbines, a substation with transformer building as well as cables between the turbines (in total 22 km 33 kW cables divided across five sections), the substation and to the shore (a 130 kW cable). The wind turbines are placed in straight rows with a distance which is slightly below optimum for the 2.3 MW generators that are used (Dahlberg 2009). The distance between the rows of wind turbines is 300m and the distance between each turbine in a row is 400m. The wind turbines cover an area of 4.6 km2.
The wind turbines stand on gravity based foundations, hexagonal concrete pedestals which are 19 metres at their widest, on a bed of macadam on the sea bed. Around the base of each tower, there is ballast and a one to 1.2 m thick scour protection layer. The depth of the water in the area varied from between four and nine metres before construction and was dredged to be between seven and eleven metres before the installation of the foundations.
The wind turbines have a total height of approximately 115 metres up to the end of the blades, a rotor diameter of 93 metres and the tower a height of 68.5 metres. The blades rotate with a speed of 6–16 revolutions per minute. In total, the wind farm has a maximum production capacity of 110 MW and an annual production of approximately 330 000 MWh. Maximum electricity production is reached at a wind speed of 12–13 m/s (Jeppsson et al. 2008).
Figure 1. Lillgrund wind farm – an overview.).
The wind farm was available for production for 99% of the time during the years 2008 to 2010, when the studies on the fish populations were primarily carried out (May up to and including November). In the remaining periods, there was no production, or the wind farm even used small amounts of energy. Figure 2 is an illustration of the production over time. The
soundscape under the surface of the water around the wind farm reflects the wind farm’s production up to capacity.
Figure 2. Production (% of the maximum) from the whole wind farm at Lillgrund, during the months of May to November (7 months), i.e. the main period when fish studies were carried out in the area, for the years 2008–2010 (from productivity data from Vattenfall for the wind farm).
Final Report
The studies in this project have partly been integrated with the studies
undertaken as a part of the research programme Vindval, which is financed by the Swedish Energy Agency. The final report has been coordinated with equivalent studies within the Vindval Research Programme, by including summarised results from the Vindval Research Programme in this report (bottom-dwelling fish), or by analysing all the data from both studies together (acoustics, fish migration).
The first chapter of the report covers the soundscape in the Öresund Strait and how fish perceive and react to noise. This is followed by a presentation of the results for benthic, bottom-dwelling fish species, which to a large extent are stationary and are thus more greatly affected than pelagic, open-water living fish species as a consequence of the altered sea bed structure. After the chapter on pelagic fish species, there is a chapter that discusses the effects of the wind farm on the migrating eels, silver eels. Eels that spawn in the Sargasso Sea have a very long migration route from the Swedish coast/Baltic Sea, which is why any disturbance of this migration can be of great significance in terms of whether the fish arrive or not. The report finishes with an overarching discussion where the different studies are weaved together and discussed within a wider context.
Acoustics
Introduction
Fish use sound for several biological functions such as to find food, for advanced warning of approaching predators or to find partners (Hawkins 1993). Many fish can create sound with the help of muscles, by vibrating their swim bladder or by grinding their teeth or rubbing their fin rays together. This has the aim of driving away rivals or attracting partners (Bass & Ladich 2008; Kasuman 2008). Sound in the sea can also provide fish with spatial perception, which eases orientation when breaking waves and biological noise created by marine organisms provide information on the coastline and reef or current wind direction. (Lagardère et al. 1994; Simpson et al. 2005; Fay 2009). The increase in industrial activities e.g. shipping traffic, seismic studies,
construction and operation of offshore energy sources as well as military activities at sea, have led to a general increase in underwater noise levels over the last hundred years (Ainslie et al. 2009; Hildebrand 2009; Kikuchi 2010). It is very important that these sources of noise and their impact on the marine environment are studied so that the already hard pressed aquatic ecosystems do not suffer further. In recent years, offshore wind power has attracted significant attention due to the fact that wind turbines have been built in areas close to the shore with high biodiversity. The turbines differ from other sources of noise because they generate noise continuously when in operation, although the noise varies, in level and frequency, as a function of wind speed, and they will stand in the same location for at least 20 years. (Wahlberg & Westerberg 2005; Madsen et al. 2006; Wilhelmsson et al. 2010). The underwater noise generated by offshore wind farms may have an impact on fish if the noise is sufficiently high and overlaps with those frequencies which fish use
(Slabbekoorn et al. 2010).
In order to assess the significance of noise and vibration from an offshore wind farm for fish, the following questions were formulated:
1. What frequencies and noise levels are generated by Lillgrund wind farm? 2. How much does the wind farm contribute to the current soundscape in the
Öresund Strait?
3. At what distances can cod, herring and European eel detect noise from the wind farm?
4. Are the noise levels sufficiently high as to directly result in injury to the fish or to have an impact on their behaviour?
To provide a background to the assessments, a brief review of fish hearing and how fish react to sound, as well as the general soundscape in the Öresund area close to the wind farm are presented.
This project was largely financed by the Vindval Research Programme (almost 90 %) and to a lesser extent by Vattenfall (just over 10 %). A detailed description of the methods used and results are provided in the Vindval Research Programme report (Andersson et al. 2011).
Fish Hearing
Sound energy propagates through water via particle motion and these movements create longitudinal pressure differences where the medium is compressed and decompressed, resulting in pressure fluctuations. Sound propagation moves much faster and with much less propagation loss in water than in air. All fish can sense particle motion, but only fish with a swim bladder can sense pressure changes. The body of a fish has roughly the same density as the surrounding water, which means that the fish will move in concert with the sound waves in the water. The inner ear of a fish contains calcium carbonate stones called otoliths, which rest on hair cells (figure 3). When the fish vibrates in the sound waves, the otoliths move at a different pace to the rest of the fish due to the fact that they have a higher density. This creates a differential movement between the hair cells and the otolith and this difference in motion is interpreted as sound (vibrations). The physiology of fish thus means that they are primarily sensitive to the particle motion (or acceleration) created by sound rather than the changes in pressure (Kalmijn 1988, Popper & Fay 2010).
Figure 3. The inner ear of a fish. (a) The location of the inner ear within the head of a fish, with the three semi-circular canals and three otolithic organs (utricle, saccule and legena). (b) A cross section of an otolithic organ with the liquid-filled membrane sac, the hard otholith and hair cells with sensory hairs. (c) Hair cell with sensory hair (one kinocilium and several shorter stereocilia) and a sensory nerve receptor. The figures are modified from Sand (1992). When fish that have a swim bladder are exposed to a sound wave, there is a consequent pulsation through the swim bladder. The movement in the swim bladder is transferred to the otoliths via a mechanical connection and is
registered as sound. Fish are thus sensitive to the particles of the sound field as well as the pressure component. How well fish can register sound pressure varies between species as there is a large anatomical variation in the location of the swim bladder relative to the otoliths. If the fish have a mechanical
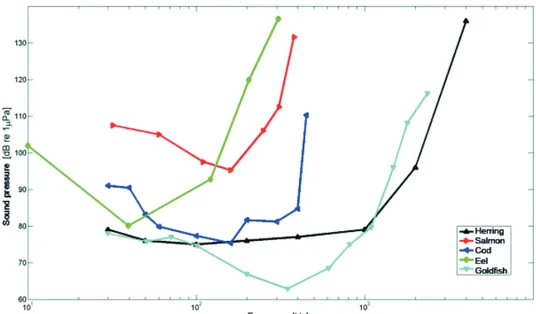
connection between the swim bladder and the inner ear, this normally results in an increased sensitivity both with regard to the frequency and the strength of the sound (Popper & Fay 2010). The anatomical differences result in a large variation in how well fish register sound, which is illustrated in figure 4 where the audiogramme (auditory threshold values) for different species of fish are compared. Herring (Clupea harengus) and goldfish (Carassius auratus) are both species of fish which have a special connection between the swim bladder and inner ear which means that they represent some of the species of fish with
the best auditory sense. Salmon (Salmo salar) and eel (Anguilla anguilla) have their swim bladder located further back in their body than cod (Gadus morhua) and thus they have a lower auditory threshold value, i.e. they have poorer hearing. The lack of connection between the swim bladder and the inner ear means that salmon, eel and cod do not hear sounds with a frequency higher than 400 Hz and have a generally higher auditory threshold compared with herring and goldfish. As figure 4 highlights, the auditory threshold can vary by around 40 dB between species, which means that care needs to be taken when making generalisations. Sound is measured in the logarithmic scale decibel (dB) which is related to pressure (Pascal) in water with the help of reference values 1μPa. It is worth noting that there is also a variation of several decibels for the threshold values within a species. The values presented in figure 4 are the average values for a number of fish within each species.
Figure 4. Auditory sensitivity related to sound pressure for a number of species of fish. Black for herring (Clupea harengus) (Enger 1967), red for salmon (Salmo salar) (Hawkins & Johnston 1978), blue for cod (Gadus morhua) (Chapman & Hawkins 1973), green for eel (Anguilla anguilla) (Jerkø et al. 1989) and magenta for goldfish (Carassius auratus) (Fay 1969). The variation in sensitivity for both frequency and sound intensity depends on anatomical differences between species. The figure is modified from Andersson et al. (2011).
Fish lacking a swim bladder e.g. many bottom dwelling species such as flat fish and fast swimming pelagic species such as mackerel (Scomber scombrus), can only detect sound with the help of their inner ear. This limits their ability to hear frequencies to between one to 400 Hz (Enger et al., 1993; Horodysky et
al., 2008). Fish have roughly the same sensitivity for vibrations with a
threshold value which lies between 10–4 to 10–5 m/s2 for frequency intervals
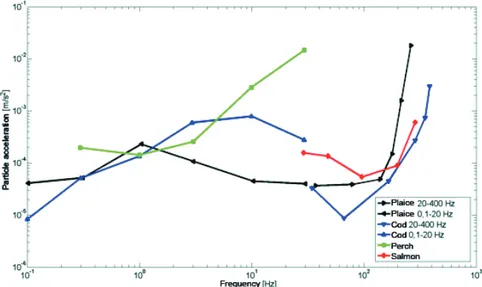
of between one and 400 Hz. Figure 5 shows the sensitivity for plaice
(Pleuronectes platessa) which has no swim bladder and cod, salmon and perch (Perca fluviatilis) all of which have swim bladders. There is a variation in
threshold values for different fish species, both for sound pressure and
movement, because there are differences between individuals but also between studies. One example is cod in figure 5, where studies of the sensitivity for vibrations from 0.1 to 20 Hz was carried out by Sand & Karlsen (1986) and for 20 to 400 Hz by Chapman & Hawkins (1973). The results do not overlap with
one another like for plaice, but Sand & Karlsen (1986) explain this by the fact that there are different levels of background noise in the two studies.
Figure 5. Hearing sensitivity in terms of particle acceleration in red for plaice (Pleuronectes platessa) (Karlsen 1992a and Chapman & Sand 1974) and in blue for cod (Gadus morhua) (Sand & Karlsen 1986 and Chapman & Hawkins 1973) presented in two different studies, in green for perch (Perca fluviatilis) (Karlsen 1992b) and in red salmon (Salmo salar) (Hawkins & Johnston 1978). Sensitivity is relatively similar for the majority of species from 1 to 400 Hz. The figure has been modified from Andersson et al. (2011).
Acceleration detection dominates the sound detection at frequencies below roughly 50 Hz (Chapman & Hawkins 1973) whilst pressure detection is more effective at the resonance frequency of the swim bladder (around a few hundred Hertz). The ability to locate the source of the sound has been studied for fish both with and without a swim bladder (Chapman & Hawkins 1973; Schuijf & Buwalda 1980). Cod have been shown to also be able to detect the distance to the source of noise in the acoustic near field (Schuijf & Hawkins 1983). This is a unique quality amongst fish which should give them a three dimensional sound image of the surroundings. The underlying mechanisms for this, have however, not been completely investigated, but the hair cells which react to the movement of the otoliths have some polarity, which help the fish to locate the source of the sound. Studies on plainfin midshipman (Porichthys
notatus) and for round goby (Neogobius melanostomus), showed that the fish
quickly adjust to the acoustic sound field direction which is related to the particle motion gradient. (Rollo et al. 2007; Zeddis et al. 2010). At close range, the fish lateral line can also detect movement. The lateral line consists of canals with hair cells (neuromasts) and of independent hair cells on the surface of their body. The lateral line system of a fish is an organ not usually used to detect acoustic signals, but to detect localised water currents around the fish, but it helps to increase the acoustic resolution in the near field. (Coombs & Braun 2003, Webb et al. 2008).
Animals integrate audio signals over a short period of time (from a couple of milliseconds to around a hundredth of a millisecond). Integration occurs not only over time, but also within a specific frequency band, the so-called critical band (Fay 1991). The width of the critical band in fish has only been calculated
for a few species (goldfish by Enger 1973; cod by Hawkins & Chapman 1975; and salmon by Hawkins & Johnstone 1978). The width of the critical band determines how broadband sound sources should be treated spectrally, to calculate how the noise levels are perceived. A rough estimate which is often used for vertebrates, is that the critical band follows the technically well-defined 1/3 octave band. See Wahlberg & Westerberg (2005) for a more in-depth discussion regarding how fish detect broadband signals.
Sound propagation in water occurs with significantly less propagation losses and at a higher speed than in air. There are several basic differences between pressure and motion. Particle acceleration for example contains information about the direction of the sound wave. In addition, the propagation loss is different for pressure and acceleration close to the source of a sound. In the so-called acoustic near field (a distance that is dependent upon the size of the sound as well as the frequency and speed of the sound), sound pressure and particle motion are not related to one another; the latter decreases more quickly with distance than the former. In the far field the relationship between the pressure and the acceleration component is proportional. In open water, the relationship between the two components is relatively well known, which means that the acceleration component can be determined from pressure measurements, whilst they need to be quantified separately in shallow seas.
How Fish are Affected by Noise
Despite the fact that studies on how fish react to noise began early in the 1900s, we still have a relatively poor understanding of how sensitive fish are to noise. It is only in recent years, with the help of new technology for measuring sound that the effects of noise on fish have begun to be investigated. There are
however, still large knowledge gaps, and in view of the large variation of species within the bony fish group, it is difficult to generalise the results.
Certain types of noise such as piling noises, seismic explorations
(compressed air guns) and explosions can generate very high noise levels over a short period of time in the water. When fish are exposed to these noise levels they can suffer permanent (PTS – Permanent Threshold Shift) or temporary (TTS – Temporary Threshold Shift) hearing damage where the sensory hairs are wrenched away from the inner ear sensory epithelium of the fish. If the fish is situated close to the source of the noise, they can die as a consequence of the damage to the inner organs and swim bladder (Popper & Hastings, 2009). Some studies have noted that the sensory hairs regrow, but contrasting results have also been described in other studies (McCauley et al. 2003; Smith et al. 2006). Fish hearing can be damaged in a similar way as a consequence of long-term exposure to lower levels of noise. In a study with white noise with sound levels just above 140 dB re 1µPa (RMS), injuries similar to those as a
consequence of short term exposure to loud noises were observed for 0.3–4.0 kHz (Scholik & Yan 2001). Even if recovery occurs, the fish experiences a period with an impaired hearing ability which can have an impact on their ability to survive.
In addition to physiological damage, studies have shown that a number of fish species exhibit escape behaviour from powerful noises. At sudden exposure and to unknown noises, the majority of fish react even to low intensity sounds.
Studies have shown escape behaviour in herring and cod in relation to research vessels, seismic investigation and piling noises (Olsen 1971, Engås et al. 1996; Muller-Blenkle et al. 2010). In many cases, the reaction occurs as soon as the sound can be differentiated from the background noise, but in other cases the sound generated must be above the background noise (Chapman & Hawkins 1973). The operational noise from an offshore wind turbine differs in character from the above mentioned noise because the noise is continuous, in contrast to piling noise which consists of loud pulses and ships which come and go. The noise level and frequency varies however, for a wind turbine, as a function of the wind speed. There is currently no research that has been carried out in the field, on how fish react to the operational noise from a wind turbine. Recorded wind turbine noise replayed in an aquarium has shown clear behaviour reactions to the noise at varying sound levels (Müller 2007; Andersson et al. 2007). Even if escape behaviour has been discovered for a number of fish species, it is unclear whether this has any significance for fish at a population level, i.e. their ability to survive and reproduce. Fish are able to become accustomed to noise, that is not too high and that is not associated with danger. Short visits to a location with elevated noise levels can however have negative consequences for a fish and it is not always escape behaviour that is the only reaction that indicates that fish are disturbed (Bejder et al. 2009). Fish have been shown to become stressed when they find themselves in an environment that is constantly noisy, which in turn could lead to lower growth rates (Sun et al. 2001; Davidson et al. 2009) but stress can potentially also disturb reproduction (Pickering 1993). The greatest gap in current knowledge is how eggs and larvae are affected by noise. They lack the ability to escape from a disturbing noise and are therefore more vulnerable than adult fish (Popper & Hastings 2009). In addition, there are no current studies which show whether the operational noise could mask acoustic
communication, such as during reproduction (Slabbekoorn et al. 2010). Studies have however shown that noise from boat traffic can mask the communication in vocalising fish species (Codarin et al. 2009). As a comparison to the noise levels from a wind turbine, studies have shown that cod can generate grunts at roughly 120 to 133 dB re 1µPa at a distance of 1 m (Hawkins & Rasmussen 1978;
Nordeide & Kjellsby 1999).
General Noise Environment in the Öresund Strait
The underwater noise environment in the Öresund Strait is dominated by intensive shipping traffic where more than 36 900 commercial ships (oil tankers, container ships, passenger ferries and fishing boats) pass through the area each year (Sjöfartsverket 2008). These figures are based on AIS (Automatic
Identification System) data from the Swedish Maritime Administration and include all ships of more than 300 tonnes. Other boat traffic, such as pleasure boats, is thus not included. This intensive traffic creates a constant noise level below 1 kHz. The noise level below 150 Hz varies a great deal because the sound propagation is influenced by the shallow depths in the Öresund area. In addition to the shipping traffic, there are also seismic investigations of the seabed,
military activities as well as a huge fleet of pleasure boats which contribute to the sound environment. The Öresund Bridge has also been shown to contribute to the sound environment in the area. Each day a numerous cars and trains pass
across the bridge and vibrations from these passages are transmitted via the pillars of the bridge into the water. The noise levels when a train passes over has been measured to between 110 dB – 120 dB re 1µPa(RMS) at 50 m from the bridge
pillars with the majority of the energy below 500 Hz (Appelberg et al. 2005). The majority of the sources of the sound described above, generate sound below 1 kHz, which coincides with the frequency where the majority of fish have the best hearing and generate sound themselves (Slabbekoorn et al. 2010). Natural sounds also contribute to the sound environment, such as rain and wave action, but also biological sounds produced by fish and marine mammals. These
biological sounds are likely to be negligible compared with the artificial sounds in the Öresund region.
Noise Production from Wind Turbines in Water
There was no pile-driving carried out during the building phase of Lillgrund wind farm, but dredging occurred at a number of places before the gravitational foundations were put in place. Noise was generated from the ship during dredging but also from the dredging activities when a suction device, bucket or other piece of equipment hit the bottom to take up material from the bottom to the surface and put it on a nearby barge. The noise consists of both short, loud pulses of noise and more broadband sound. No sound measurements were made during the construction phase for Lillgrund, but measurements from similar dredging activities in England and the USA showed sound levels up to 120–140 dB re 1µPa(RMS) at distances of 150 m for frequencies below 1 kHz
(Clarke et al. 2002) and 140 dB re 1µPa2 at distances of 100 m for 125 Hz centre
frequency above 1/3-octave band (Robinson et al. 2011).
When the wind turbine is in place and in operation, the majority of the noise is generated in the form of vibrations inside the turbine, emanating from the gear box and generator, which are transmitted via the turbine and foundations into the water. The noise that is generated by the blades is largely deflected by the surface of the water (Lindell, 2003; Sigray et al. 2009). Previous studies carried out in European waters have shown that offshore wind farms generate a broadband sound with a few powerful tones (see cited references in Madsen et
al. 2006 and measurements in Lindell 2003; Tougaard &
Damsgaard-Henriksen 2009). There seems to be a wide variation in the calculated noise levels between different wind farms. The noise levels which are given in different studies for the dominating tone component (25 to 180 Hz) lies between 120 and 150 dB re 1μPa(RMS) at a distance of 1 m from the turbine.
These values originate from measurements from both gravitational foundations of concrete and monopile foundations made of steel. The differences observed cannot only be attributed to the different types of foundation but rather are probably dependant on the type and age of the turbine and the size of the turbine as well as the foundation. The noise level is however in general always related to the wind speed because wind turbines rotate more quickly at higher wind speeds.
The highest levels of particle acceleration measured from Utgrunden wind farm reached 0.018 m/s2 at 1 m (integrated across 2–200 Hz) at 5 m/s, and
somewhat higher than 0.010 m/s2 (integrated across 2–200 Hz) at 11 m/s
measured at a wind turbine. The noise levels measured are in line with what other studies have shown to induce changes in fish behaviour (Knudsen et al. 1992; Karlsen et al. 2004; Sonny et al. 2006). The levels reduce quickly with distance, and already at 10–20 m from the wind turbine, the noise is drowned out by the natural background sound from the sea. It can justifiably be
assumed that the particle acceleration at Lillgrund is of the same order as Utgrund, and this aspect is therefore not discussed further in this study.
How quickly the noise level from a wind turbine dissipates, as a function of distance, depends on several factors. The single most important factor is the character of the material on the sea bed and if there are noise channels, such as created by shallow water or in thermoclines, which trap the sound and mean that it can travel further than would otherwise be the case. This is why sound can travel further in shallow water than in deeper water. In areas of shallow water, the sound propagates cylindrically and it is often assumed that the sound
pressure decreases by 10·log (distance). In deep water, sound spreads spherically and it is usually assumed that the sound pressure reduces by 20·log (distance) (Urick 1983). The real environment is however, often more complex, which makes calculations of the noise levels more difficult, but measurements
supported by modelling provides a relatively good picture of the sound levels as a function of different distances from a wind farm. Wind farms consist of several turbines and each individual contributes to the total soundscape. It is therefore important to measure both close to the individual turbines as well as at longer distances to measure the contribution of the entire wind farm. There is otherwise a significant risk that the total noise level from a wind farm is underestimated.
Method
Acoustic Equipment and Implementation
In May 2008, a pilot study was undertaken to study the noise pattern at Lillgrund wind farm. A hydrophone (Brüel & Kjær 8101 with a sensitivity of– 184 dB re 1V/1μPa in the frequency region 1 Hz to 125 kHz) (figure 6a) was mounted on a tripod and deployed with a boat as a base. Measurements were taken at several distances from the turbines both within and on the outskirts of the wind farm. The results showed a variation in the noise levels due to large variations in wind speed and wind direction.
In order to obtain a better understanding of the sound environment in the Öresund area as well as within and outside of the wind farm, additional noise measurements were made in November 2009 as well as during the period May to June 2010. The Brüel & Kjær hydrophone system was placed 80 m south of the turbine A07 (N55° 30’ 010 E12° 46’ 935) and was connected via a cable to a receiver system inside of the turbine A07 where an amplifier, filter and a computer were stored. The computer was used for storing data but was also connected to a modem so that the system could be managed remotely (figure 6b). The whole system was connected to the local electrical network for power and was programmed to record sound for five minutes, every 30 minutes for five weeks. In addition, a battery-driven hydrophone system, DSG-Ocean (sensitivity -185.6 dB re 1V/uPa in the frequency region 2 Hz–37 kHz) (figure 6c), was moved around and placed at different distances (80, 160, 400 and
1000 m) from wind turbine A07 and from the entire wind farm. The DSG-system was programmed to record over the same five minutes every 30 minutes as the Brüel & Kjær system. Both systems recorded with a speed of 25 kHz. Due to the fact that no sound measurements were made before the wind farm was built, measurements of the underwater sound levels were also carried out at Sjollen (N55° 36’ 024 E12° 52’ 635), one of the reference sites for fish sampling within the monitoring programme. This site is situated 10 km north of the wind farm and has similar conditions on the sea bed and depth as the wind farm area. It is also affected by the same shipping channel, Flintrännan, which passes Lillgrund. A hand-held GPS was used when placing out the hydrophones at the planned locations. Vibration measurements within the turbines A01 and A07 and data regarding wind speed and direction as well as electricity production for the individual turbines was provided by Vattenfall Wind Power Data Centre in Denmark. For a more detailed description of the measuring equipment and implementation, see Andersson et al. (2011).
Figure 6. Acoustic measuring systems used at Lillgrund. (a) Brüel & Kjær 8101 hydrophone on a tripod, connected to a boat via a cable and later into a turbine, (b) Receiver equipment from inside a turbine with an amplifier, filter and a computer for storing the data which was also connected to a modem, so that it could be managed remotely, (c) DSG-Ocean hydrophone which is battery-driven and was moved around, within and outside of the wind farm. Photo: Mathias H. Andersson.
Data Analysis
In total, more than 300 hours of underwater sound was recorded during the study. The data was collated according to wind speed (0–2 m/s, 3–6 m/s, 7–9 m/s and 10–14 m/s). The data was then analysed to determine the passage of ships in the vicinity. This was carried out to differentiate the noise from the wind farm from other sounds in the Öresund Strait, as well as to establish the natural sound environment for the Öresund area without any contribution from nearby ships. All data was analysed with the help of the acoustic
programme Raven and MatLab® (MathWorks). The first analyses showed that all turbines contributed noise, and that the estimate of the noise levels at longer distances would be incorrect if only based on the measurements taken close to an individual turbine. A numerical model was developed instead, which was based on and verified with the actual measurements. The model treated all 48