Master’s thesis • 30 credits
Agricultural programme – Economics and Management
Establishment of Water Protection Areas:
Comparing Benefits of Protecting
Groundwater Services to Agricultural Costs
Swedish University of Agricultural Sciences
Faculty of Natural Resources and Agricultural Sciences
Establishment of Water Protection Areas: Comparing Benefits
of Protecting Groundwater Services to Agricultural Costs
Julia WahtraSupervisor: Efthymia Kyriakopoulou, Swedish University of Agricultural Sciences, Department of Economics
Examiner: Jens Rommel, Swedish University of Agricultural Sciences, Department of Economics
Credits: 30 credits
Level: Second cycle, A2E
Course title: Master thesis in Economics
Course code: EX0907
Programme/Education: Agricultural programme – Economics and Management Course coordinating department: Department of Economics
Place of publication: Uppsala Year of publication: 2019 Cover picture: Julia Wahtra
Title of series: Degree project/SLU, Department of Economics
Part number: 1224
ISSN: 1401-4084
Online publication: http://stud.epsilon.slu.se
Key words: cost-benefit analysis, groundwater services, water protection areas, distributional effects, agriculture
Acknowledgements
I would like to thank my supervisor, Efthymia Kyriakopoulou at SLU, for all her excellent advice. I would also like to express my sincere gratitude to Henrik Nordzell and Tore Söderqvist at Anthesis, as well as to the other persons involved in the research project which this thesis has been a part of, for their valuable input and support during the entire writing process.
Abstract
In this study, a CBA of expanding a water protection area and imposing more restrictive pro-tection regulations to safeguard a groundwater source used for drinking water supply was performed. The case study area was a location in the Southern part of Sweden. The aim of the study was to contribute to enabling economically motivated water management decisions and to address the distributional effects of water protection measures. Benefits in terms of enhanced protection and secured provision of good quality drinking water supply and other groundwater services were compared to costs for the agricultural sector. Groundwater services were identified by a novel classification system for biotic and abiotic surface and groundwater services, developed based on an extensive literature review. The protection measure alternative was concluded as profitable compared to the reference alternative with a NPV of SEK 128.9 million. Potential uncertainties and omitted cost and benefit items were examined in a sensitivity analysis, but these factors were not considered to have altered the outcome of the CBA. It was deemed challenging to identify all groundwater services supplied by the groundwater source and to determine the relationship between the protection measure and the impact on these services. More research is required to develop the applicability of the classification system. Another conclusion was that the benefits of protecting a drinking water source to a large extent depend on the number of people using it for their drinking water supply.
Sammanfattning
I den här studien genomfördes en kostnadsnyttoanalys av att utvidga ett befintligt vattenskydds-område och införa mer restriktiva skyddsföreskrifter för att skydda en grundvattenkälla som används för dricksvattenförsörjning. Fallstudieområdet var en plats i södra delen av Sverige. Syftet med studien var att bidra till möjliggörandet av ekonomiskt motiverade vattenförvalt-ningsbeslut och att adressera fördelningseffekter av vattenskyddsåtgärder. Nyttorna i form av ett ökat skydd och säkerställt tillhandahållande av dricksvatten av god kvalitet samt andra grundvattentjänster jämfördes med kostnader för jordbrukssektorn. Grundvattentjänsterna identifierades utifrån ett nytt klassificeringssystem för biotiska och abiotiska yt- och grund-vattentjänster, som utvecklats baserat på en omfattande litteraturöversikt. Skyddsåtgärds-alternativet konkluderades som lönsamt jämfört med referensSkyddsåtgärds-alternativet med ett nettonuvärde på 128,9 miljoner SEK. Potentiella osäkerhetsfaktorer och utelämnade kostnads- och nytto-poster undersöktes i en känslighetsanalys, men dessa faktorer bedömdes inte förändra analysens utfall. Det ansågs utmanande att identifiera alla grundvattentjänster som tillhandahölls av grundvattenkällan samt att fastställa förhållandet mellan skyddsåtgärden och påverkan på dessa tjänster. Ytterligare forskning behövs för att utveckla klassificeringssystemets tillämplighet i detta avseende. En annan slutsats var att nyttan från skydd av en dricksvattenkälla i stor utsträckning beror på antalet personer som är beroende av den för sin dricksvattenförsörjning.
Abbreviations
CBA – Cost-Benefit Analysis NPV – Net Present Value NSB – Net Social Benefits PV – Present Value
SDR – Social Discount Rate SEK – Swedish Krona USD – American Dollars WTP – Willingness to Pay
Table of Contents
1 INTRODUCTION ... 1
1.1 Aim and delimitations ... 2
1.2 Objectives ... 3
2 DRINKING WATER ... 4
2.1 Surface and groundwater drinking sources in Sweden ... 4
2.2 Water protection areas ... 4
2.3 Water pollution from agriculture ... 5
3 LITERATURE REVIEW ... 6
3.1 Costs and benefits of water protection measures ... 6
3.2 Contributions to the literature ... 7
4 COST-BENEFIT ANALYSIS ... 8
4.1 Purpose and motivation for conducting CBA ... 8
4.2 Theoretical Framework ... 8
4.3 Conducting a CBA ... 9
4.4 Limitations of CBA ... 11
5 CASE STUDY ... 12
5.1 Description of the case study area ... 12
5.2 Description of the reference alternative ... 13
5.2.1 Drinking water supply ... 14
5.2.2 Agricultural activities ... 14
5.2.3 Groundwater services ... 16
5.3 Description of the protection measure alternative ... 16
5.4 Impacts of the protection measure alternative ... 18
5.5 Quantification ... 18
5.5.1 Administrative costs ... 18
5.5.2 Reduced profits in the agricultural sector ... 19
5.5.3 Protection of good quality drinking water ... 19
5.5.4 Avoided risks from pesticide use ... 19
5.6 Discount rate ... 19
5.7 Valuation ... 20
5.7.1 Administrative costs ... 20
5.7.2 Reduced profits in the agricultural sector ... 20
5.7.3 Protection of good quality drinking water ... 23
5.7.4 Avoided risks from pesticide use ... 24
5.8 Results ... 25
6 ANALYSIS ... 25
7 CONCLUSION AND DISCUSSION ... 27
8 RECOMMENDATION ... 28
REFERENCES ... 29
APPENDICES ... 33
Appendix 1: Classification System ... 33
Appendix 2: Calculations ... 37
List of figures
Figure 1. Approximate map of the case study area. The demarcations are not exact. ... 12
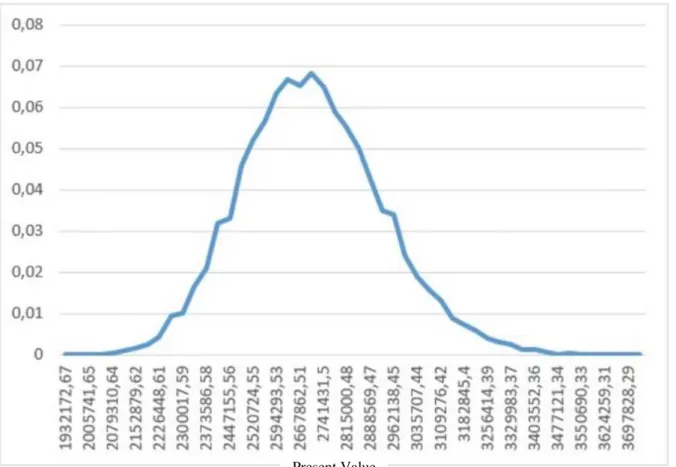
Figure 2. Probability distribution of outcomes from the Monte Carlo simulation. ... 22
List of tables
Table 1. The nine main steps to perform a cost-benefit analysis of projects and policies ... 10Table 2. Crop rotation, yields, absolute prices, production costs and contribution margins in the case study area ... 15
Table 3. Absolute prices for non-organic milk, fattened calf and young male cattle ... 15
Table 4. Groundwater services supplied by the groundwater source ... 16
Table 5. Zoning, agricultural land and regulations within the proposed water protection area ... 17
Table 6. Activities affected by the protection measure relative to the reference alternative. (+) implies positive impact and (–) implies negative impact ... 18
Table 7. Cost and benefit items from implementation of the water protection measure relative to the reference alternative ... 18
Table 8. Work time, price per hour and price per permit for consultancy and administration ... 20
Table 9. Yield, absolute price, production cost and contribution margin from crop production in the protection measure alternative ... 21
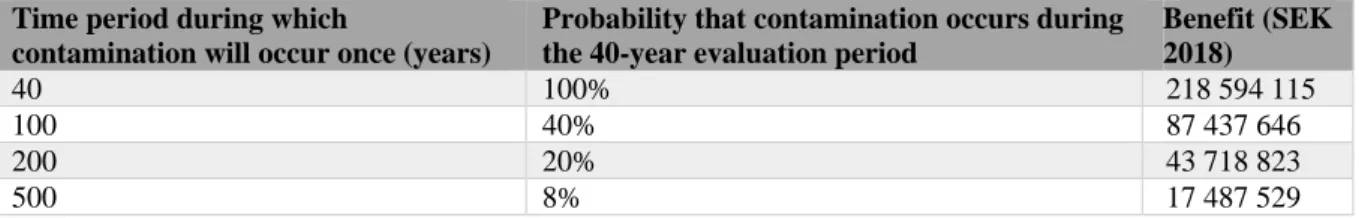
Table 10. PV of benefits from protecting the drinking water by the protection measure, depending on probability of a contamination taking place ... 23
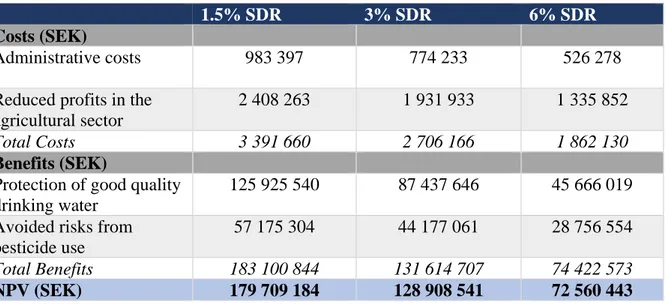
Table 11. Costs, Benefits, and NPVs with 1.5% SDR, 3% SDR (Base Case Scenario) and 6% SDR (2018 values) ... 25
1 Introduction
Access to safe drinking water is fundamental for the economic development and public health of society (WHO, 2017), which was recently recognised by the 2030 Agenda for Sustainable Development. The 2030 Agenda was adopted in 2015 by all members states of the United Nation and contains 17 Sustainable Development Goals, including a specific goal to ensure availability and sustainable management of water sources for all people on earth (UN, 2017). Drinking water is primarily used for drinking, but also for other purposes (Svenskt Vatten, 2016b). Besides granting water for drinking, surface and groundwater sources provide other vital services contributing to human well-being (CICES, 2018). For example, water is a crucial input for the production of food, recreational and cultural experiences as well as a source of energy and habitat for living species.
All inhabitants in Sweden are considered to have access to safe water, but many hazards which could harm the supply of good quality drinking water remain (Government Offices of Sweden, 2018). These are commonly linked to human activities such as road traffic, agricultural production and industrial processes (SOU, 2016:32). Due to climate change and urban development, there is an aggravated risk that these hazards will expose the drinking water supply system. County administrative boards and municipalities have the authority to implement various legal measures to protect the quality and quantity of drinking water sources (SEPA, 2010). One measure is the establishment of water protection areas, regulated in Chapter 7, Section 21-22 of the Environmental Code (SFS 1998:808). The purpose of water protection areas is to give sufficient protection to water bodies that are important for our drinking water supply, from a multi-generational perspective (SEPA, 2010). Establishing water protection areas put different restrictions on activities and pollution sources at its location. The imposed restrictions should support the water protection aims of EU and Swedish legislation to ensure intended use of the drinking water source now and in the future.
Despite the growing importance of securing drinking water sources, local and regional authorities lack methods and material as a basis to plan and implement protective measures (SOU, 2016:32). Another issue is the significant discrepancy in guidelines available for protective actions, with variations both in terms of methods and judgments between local authorities.
The lack of clear guidelines and supportive material counteracts optimal implementation of protection measures and results in economically unmotivated policy decisions, causing conflicts between stakeholders in society. Because property owners practising agricultural activities commonly bear a large part of the economic costs related to water protection areas, due to restrictions on land use and farming activities (SOU, 2016:32), this protection measure causes particularly unfortunate conflicts. The Federation of Swedish Farmers argues that water sources need protection in a way which alleviates conflicts and is reasonable for all stakeholders involved (LRF, 2016). They argue that the production of food and drinking water as a general rule is possible to combine. Alternatively, whenever we take Swedish agricultural land out of production due to water protection restrictions, the same amount of food it used to produce might be replaced by imported food (LRF, 2016). As a consequence, the adverse environmental effects of agricultural production move to another country, possibly with graver environmental impacts on society (LRF, 2016). Proper appraisal of the societal effects of water protection areas and other protection measures is much needed to address these conflicts and to accomplish adequate protection of drinking water sources.
To make well-informed analyses as a basis for decisions concerning protective measures of drinking water sources, further knowledge about the measures' positive and negative societal effects is needed (SOU, 2016:32). This study will contribute to this work by valuing benefits and costs from expanding an existing water protection area and imposing more restrictive protection regulations. A classification system of all services provided to society by surface and groundwater sources will be developed to enable their value to be taken into account in policy decisions in general and to motivate protective measures to assure good quality drinking water in particular. The deficiency in supportive methods and frameworks discourages valuation techniques for environmental goods and services to be used in real-world decisions (Griffiths et al., 2012; Postel and Thompson, 2005). By performing cost-benefit analyses of water protection measures, distributional effects could also be addressed and remediated. Well-informed analyses and prioritisation of which protective measure to use and where will help to establish or expand water protection areas where they are the most beneficial to society.
1.1 Aim and delimitations
The overall aim of this thesis is to contribute to the assessment of effects on society from water protection measures, focusing on water protection areas, to enable informed and more economically motivated management decisions. Costs and benefits of expanding and imposing more restrictive protection regulations on an existing water protection area at a rural location in the Southern part of Sweden with a groundwater source are calculated. The location addresses the conflict of interest between protecting drinking water sources and agricultural production. The specific research question is:
What is the net present value of expanding a water protection area when considering benefits of protecting groundwater services and costs for the agricultural sector?
The results will be of importance to demonstrate the various benefits of protecting drinking water sources, besides ensuring supply of good quality drinking water. They will also pay attention to distributional effects and allow for analysis of uncertainty regarding estimation of benefits, costs, and choice of social discount rate (SDR).
The study will be carried out by an extensive literature review to identify all services usually provided by surface and groundwater drinking sources in Sweden. The services are subsequently structured in a classification system1 applicable to different types of drinking
water sources with a variety of preconditions. The aim is to allow for categorisation and economic valuation of drinking water sources in terms of what services they provide to society. The classification system will give novel contribution to the research by considering both biotic and abiotic services from surface and groundwater drinking sources. It will be used in the cost-benefit analysis (CBA) to assess the protection measure’s impact on services provided by the groundwater source. Costs for the agricultural sector in terms of profit losses and administrative work will also be considered.
1 The complete classification system is found in Appendix 1 and should be considered as work-in-progress
The study is limited in the sense that it focuses on the impact on groundwater services and the agricultural sector, which are the main activities in the case study area. Only costs and benefits which could be identified based on the material and data available are included in the analysis. A lifetime of 40 years is assumed for the proposed water protection area, with an evaluation period from 2018 to 2058.
1.2 Objectives
The primary objective of the study is to estimate costs and benefits of expanding an existing water protection area and imposing more restrictive protection regulations. The secondary objective is to produce and test the applicability of a classification system of biotic and abiotic services provided by surface and groundwater sources.
2 Drinking water
This chapter gives an overview of drinking water sources in Sweden and the purpose and design of water protection areas. The various pollutants from agricultural activities are also described.
2.1 Surface and groundwater drinking sources in Sweden
Drinking water in Sweden is produced from raw water in water treatment plants (Svenskt Vatten, 2016b). The municipalities are responsible for the production of all drinking water, except for the amount people receive from private wells (Svenskt Vatten, 2016a). Half of the raw water comes from surface water sources and the other half from groundwater sources. It is also common that the two types of sources are interconnected through e.g. induced infiltration2 (SEPA, 2010). Surface water sources refer to lakes and streams, and groundwater sources consist of either natural or artificial groundwater.
Both surface and groundwater can reach the same good drinking water quality with the right treatment, but groundwater generally has a better immediate quality (Svenskt Vatten, 2016a). The treatment process needed to produce drinking water from surface water is therefore much more complex and includes several steps. By contrast, when the raw water from groundwater sources is well protected, and of particularly good quality, the plant could exclusively subsist of a pumping device. As raw water from groundwater sources constitutes 50% of our drinking water supply, maintaining its high quality is paramount to secure current and future drinking water supply. Protection of the high quality of groundwater also lower cleaning costs and result in a reduced risk of having to use backup sources.
2.2 Water protection areas
Water protection areas are established to protect drinking water sources from activities and land uses which may have an adverse effect on the quality and quantity of the water (SEPA, 2010). They could be established on land and water areas to protect surface or groundwater sources that are used for, or are likely to be used for, water extraction (Chapter 7, Section 21 of the Swedish Environmental Code). The source should have sufficient protection from occasional and continuous anthropogenic pollution, referring to all substances which could potentially harm the current or future supply of drinking water. Point source pollutants stem from a single and identifiable source of pollution, e.g. a sewage treatment plant or an industry, whereas diffuse source pollutants appear over a large area, not attributed to a single source (EPA Victoria, 2018). Agricultural land, woodland, and private sewers are typical examples of sources of diffuse pollutants (SEPA, 2016).
The precautionary principle is fundamental when local authorities form water protection areas and design their regulations (SEPA, 2010). It underlies the general rules of consideration in Chapter 2 of the Swedish Environmental Code (SFS 1998:808) and applies to all activities or measures which may cause damage or detriment to public health, humans and the environment. The principle is however not intended as an argument to establish too large water protection areas as a precaution or to conduct insufficient preparational investigations such as descriptions
of hydrological conditions and risk assessments. Before deciding whether to establish a water protection area a risk inventory covering the whole catchment area is required, which is the entire area within which the water is moving to the water source (SEPA, 2010). A usual definition of the risk for an undesirable event to happen is the product of its consequences and the probability that it will occur (SEPA, 2010).
The rule of thumb is that the protection regulations should cover the entire catchment area, and when the scope of the water protection area has been determined, it is divided into different protection zones (SEPA, 2010). These are either water abstraction zone (encompasses the point where the raw water is abstracted), primary protection zone, secondary protection zone and, if necessary, tertiary protection zone (SEPA, 2010). The regulations are most restrictive at the water abstraction zone and least restrictive in the tertiary protection zone. The regulations should be reasonable when considering the purpose of the water protection area, as they limit individuals' disposal right of their land, and adjustments to local conditions are important (SEPA, 2010).
2.3 Water pollution from agriculture
Industrial agriculture is one of the main reasons for global water pollution (FAO and IWMI, 2018). In the European Union, 38% of all water bodies are under high pressure from agricultural pollutants. Land uses in Swedish agriculture which involve risk to surface and groundwater drinking sources are: use of pesticides and biocides3, fertiliser and manure, soil tillage causing
increased hummus levels in surface water, livestock and drainage (SEPA, 2010). Agricultural point source pollution occurs in connection to e.g. manure and silage facilities and due to accidental pesticide spill. However, the most common water contamination related to agriculture is diffuse pollution (FAO and IWMI, 2018). Diffuse pollutants are very hard to measure and monitor as they do not have a certain point of discharge (SMED, 2013). In modern agriculture, diffuse pollutants come from the intense use of fertilisers and manure (EEA, 2018). Chemical pesticides used to protect plants from fungus, pests or competing plants is another diffuse pollution, mainly transported to surface and groundwater sources by runoff and wind (KEMI, 2016; EEA, 2018).
The adverse effects of diffuse pollutants are harmful to the health of people, domestic animals and wildlife. Because of the long-term effect of diffuse pollutants on surface and groundwater sources, and the difficulty to remediate them, these type of pollutants entail risk to the drinking water supply system (SEPA, 2010) and bring on significant increases in treatment costs (EEA, 2018).
3 Pesticides and biocides are chemical or biological products used to preclude or restrain animals, plants or
micro-organisms from damaging human health or properties. Of these products, biocides include all pesticides which are not intended to protect plants or plant products (KEMI, n.d.).
3 Literature review
The literature review consists of articles evaluating costs and benefits of water protection measures. Cost-benefit analyses which evaluate specific water protection measures are very limited, especially CBAs which also account for the effect on other surface and groundwater services besides drinking water supply and impacts on the agricultural sector. Hence relevant studies using different methodologies to investigate benefits and costs related to water quality improvements have been covered.
3.1 Costs and benefits of water protection measures
Already thirty years ago, Dixon and Sherman (1991) acknowledged the difficulty to motivate protection of natural areas due to substantial underestimations of associated benefits and because private costs often overweigh private benefits. Thus, even though net social benefits are positive, less area is protected compared to what is socially optimal. Dixon and Sherman (1991) argued that economists play an important role to improve monetary estimates of benefits related to the protection of natural areas, not at least for watersheds. Around twenty years later, Griffiths et al. (2012) deem that despite substantial research on economic values of environmental non-market goods, only slowly has this literature been integrated into analyses of regulation impacts. Their article examines the US Environmental Protection Agency’s estimation of benefits related to surface water quality improvements during the last thirty years. Because of variations in available data, different local conditions, objectives and methodologies, they conclude that there is a large variation in the definition of water quality indicators, which entangles transfer of benefit estimates between studies.
Postel and Thompson (2005) discuss the importance of valuation of water services in the light of increased population and development pressure on watersheds. The increased pressure poses a risk to the quality and cost of drinking water and to reliability of water suppliers. Important conclusions are that further research is required on linkages between land use and hydrological effects within watersheds, as well as on the valuation of ecosystem services. Postel and Thompson (2005) argue for the need to develop methods that enable usage of valuation techniques in real-world decisions. Today water suppliers and stakeholders are often unsure about to what degree some measure will generate water service benefits or if the benefits will outweigh the costs. They also add to the discussion of distributional effects by recommending that authorities should only undertake watershed protection with a specific goal of equally distributing the gains. Otherwise, there is a risk of benefiting urban industrial business at the expense of rural communities, increasing social inequities.
Bateman et al. (2006) further examined the distributional effects of water protection measures by analysing possible agricultural costs and non-market benefits of implementing the EU Water Framework Directive. The Directive aimed to achieve “good quality status” of all European water bodies by 2015. They noted that even though the Directive was claimed to deliver considerable benefits, there is no formal economic assessment of such benefits. The authors used GIS techniques to model agricultural land use, hydrology and water quality effects to address the distribution of costs and benefits, with the Humber basin (UK) as case study area. Bateman et al. (2006) conclude that agriculture bears a large share of the implementation costs of the EU Water Framework Directive and that GIS-based methodology is vital to address the aggregation, transfer and distribution of benefits from earlier studies.
Eisen-Hecht and Kramer (2002) performed a CBA of preserving the current level of water quality in the Catawba River basin (USA), which is primarily threatened due to population growth. The Catawba River is used for various commercial business as well as providing surrounding inhabitants with drinking water and recreational and aesthetic qualities. A stated preference survey was designed to evaluate people’s willingness to pay (WTP) to protect the water quality by implementing a management plan. The annual mean WTP for five years of payments was USD 139, based on answers from 1085 residents, corresponding to a total economic benefit of USD 340.1 million. The estimated benefits were related to recreational use and the use and non-use value of good quality water. The total cost of the management plan over 10 years was concluded to be USD 244.8 million. The costs included compensation to farmers who had to install buffer strips on productive agricultural land causing a reduction in income. Eisen-Hecht and Kramer (2002) argue that similar analyses reflecting the public good values of water sources are essential to help stakeholders make well-informed management decisions to assure water of good quality. Because high standard contingent valuation studies are both money and time consuming, they highlight the potential for benefit transfer to conduct CBAs at sites with no primary data.
3.2 Contributions to the literature
The most important contribution of this study is that it will add to the scarce literature assessing costs and benefits of water protection measures, which is essential to enable well-informed and economically motivated decisions about water protection measures. Not at least to address distributional effects causing substantial conflicts in water management. Also, much of the existing research focuses exclusively on the valuation of good quality drinking water supply and not on the non-market benefits of protecting groundwater sources. By identifying all services provided by surface and groundwater sources, the total economic value of drinking water sources could be considered in decisions regarding drinking water protection. The classification system developed in this study will give contributions in this matter, as well as the attempt to identify and value the effect on groundwater services through a case study.
4 Cost-Benefit Analysis
In this chapter, the purpose and motivation for conducting CBA to evaluate policies and projects are described. The chapter provides the conceptual basis of CBA and the methodological steps required to perform the analysis.
4.1 Purpose and motivation for conducting CBA
The effects on society from expanding the water protection area and imposing stricter protection regulations will be evaluated using CBA. It is a method aiming to support social decision-making (Boardman et al., 2014), as it helps decision-makers to define costs and benefits from various policies (Johansson and Kriström, 2016). The specific objective of a CBA is to allocate the scarce resources of society efficiently, or as efficient as possible (Boardman et al., 2014). When performing a CBA, all impacts of a policy to every member of society is (as far as possible) quantified in monetary terms. The procedure involves identifying and sorting all impacts affecting human well-being as benefits or costs, valuing them economically and assessing the net benefits relative to status quo. The more precise definition is net social benefits (NSB), i.e. social benefits (B) minus social costs (C). There are different types of CBAs, and in this study, an Ex ante CBA will be performed. An Ex ante CBA gives immediate assistance in decisions regarding whether to allocate society’s resources to a specific project or policy as it is executed before the decision about implementation (Boardman et al., 2014).
4.2 Theoretical Framework
The conceptual basis for CBAs is the objective to accomplish allocative, or Pareto, efficiency – a key concept in modern welfare economics (Alan Yeakley et al., 2016). Pareto efficiency is achieved if no alternative allocation of goods can be made such that at least one person is made better off, without making anyone else worse off. If there is an alternative allocation to status quo, which would generate this outcome, it would be a Pareto improvement. A Pareto improvement, relative to status quo, could be obtained if a policy yields net social benefits (Boardman et al., 2014). Then it is possible to find a set of payment transfers which would compensate those who bear the costs of the policy, making no one worse off and at least one person better off.
In real life, the Pareto criterion is rarely fulfilled, and policies generally have both winners and losers (Johansson and Kriström, 2016). Instead, CBAs usually follow the Kaldor-Hicks criterion as a decision rule; only adopt policies that generate a potential Pareto improvement (Boardman et al., 2014). The Kaldor-Hicks criterion provides a basis for the CBA decision rule to only undertake a policy if its net social benefits are positive because then it is hypothetically possible to compensate the losers (Johansson and Kriström, 2016). Following this criterion, water protection areas should be established as long as overall society is made better of due to, e.g. higher viability of services provided by the drinking water sources. However, it is important to have the concept of Pareto efficiency in mind for the discussion of compensation to those who bear the costs from implementing water protection areas as the Kaldor-Hicks criterion undertakes a rather strong ethical assumption (Johansson and Kriström, 2016).
When a market is allocatively efficient, the social surplus is maximised (Boardman et al., 2014). In a perfectly competitive market, this is accomplished by the market process itself. On the other hand, when institutions and behaviour deviate from ideal circumstances, the market fails to provide an efficient allocation causing a market failure (Perman et al., 2011). Market failure is a crucial concept in environmental economics and a strong argument for promoting policy intervention to protect drinking water sources. Because there is no market for most surface and groundwater services provided by water sources, except for the commodity “water for drinking”, too little of them might be produced compared to what is allocatively efficient. This is the case because many of these services are public goods, which means that once they are produced they are free for everyone to enjoy, resulting in the absence of economic incentives for the private sector to produce such goods and services (Boardman et al., 2014). Without government intervention, nothing or too little is produced. As a result, the social surplus is not maximized, which constitutes a strong argument for establishing water protection areas.
4.3 Conducting a CBA
When conducting a CBA, at least two different alternative projects must be considered (Boardman et al., 2014). If no alternative project is relevant, the comparison is made between the single project and status quo. The two alternatives analysed in this study are: expansion of a water protection area with a set of new more restrictive regulations, or no expansion of the water protection area.
Those with standing are households within the water supply area as they are the ones directly benefiting from the groundwater source. Not imposing the new demarcations and protection regulations will be referred to as the reference alternative. Not implementing the protection measure could be equivalent to status quo, or it could result in a degradation of the groundwater services. In this analysis, the costs and benefits of maintaining the good quality of the drinking water source (protection measure alternative) are compared to the costs and benefits of proceeding business-as-usual, which implies a risk of degraded drinking water quality and provision of groundwater services (reference alternative). A strong motivation for choosing the CBA methodology is that it addresses the expected distribution of benefits and costs, which is important when imposing regulations which affect several stakeholders.
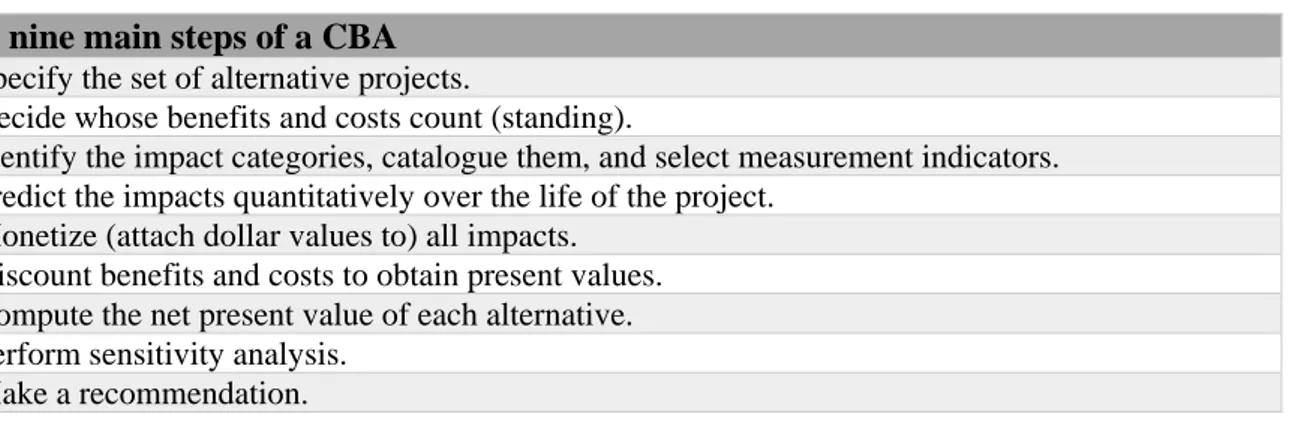
Performing a CBA includes going through nine major steps which help to structure and manage the analysis (Boardman et al., 2014). The nine main steps are displayed in Table 1. The classi-fication system is an integral part of step (3) to be able to include impacts on groundwater services from the water protection measure. The process of developing the classification system is described in Appendix 1.
Table 1. The nine main steps to perform a cost-benefit analysis of projects and policies
The nine main steps of a CBA
1. Specify the set of alternative projects.
2. Decide whose benefits and costs count (standing).
3. Identify the impact categories, catalogue them, and select measurement indicators. 4. Predict the impacts quantitatively over the life of the project.
5. Monetize (attach dollar values to) all impacts. 6. Discount benefits and costs to obtain present values. 7. Compute the net present value of each alternative. 8. Perform sensitivity analysis.
9. Make a recommendation.
The decision rule for deciding whether to implement a project relative to status quo is: adopt the project if its net present value (NPV) is positive (Boardman et al., 2014). To calculate the NPV, future costs and benefits are discounted to obtain present values. Discounting is necessary due to people’s preference for consumption today rather than in the future (Boardman et al., 2014). Adding weight to the discounting of future generations is also legitimate if we assume economic growth such that future generations will be richer compared to the current one (Johansson and Kriström, 2016). The NPV is calculated as
(1) 𝑁𝑃𝑉 = ∑ 𝐵𝑡 (1+𝑟𝑡)𝑡− ∑ 𝐶𝑡 (1+𝑟𝑡)𝑡 𝑇 𝑡=1 𝑇 𝑡=1
where T is the lifetime of the specific project, Bt and Ct are costs and benefits that occur in time
t and rt is the SDR at time t. The literature about which SDR to choose is broad and contains
several contradictory opinions (see chapter 5.6 for discussion). The European Commission recommends a SDR of 3% for social analyses within the Member States of the EU (European Commission, 2014), and the choice of real SDR in this CBA is 3%, following the recomm-endation of the European Commission.
Even though the ultimate decision rule is straightforward in a CBA, economic valuation of many significant impacts could be both problematic and litigious (Boardman et al., 2014). For most cases, people’s WTP to attain or avoid the impacts of a policy can be derived from market demand curves. Valuation of environmental impacts on the other hand usually presents a great challenge. Because well-functioning markets for most environmental outputs are absent, people’s WTP cannot be decided through market behaviour, therefore, indirect market valuation methods are generally applied to value environmental goods. These are either revealed preference methods or stated preference methods (Boardman et al., 2014). With revealed preference methods, WTP is determined from observed behaviour. Usual methods based on reveal preferences are hedonic pricing and the travel cost method. The most common stated preference methods are choice experiments or contingent valuation, where people value environmental goods and services through survey questionnaires.
In a CBA, the net sum of all WTP estimates for a policy of those with standing corresponds to the policy’s total economic value (TEV) (OECD, 2018). The TEV could be divided into use, and non-use values and both must be considered when conducting a CBA (Johansson and Kriström, 2016). Use values are obtained from current, planned or possible use of a good or service, whereas non-use values are either in the form of existence, bequest or altruistic values (OECD, 2018). One significant advantage of stated preference studies is that it is possible to discover such non-use values people obtain from environmental goods and services, which usually do not leave a behavioural trace (Boardman et al., 2014).
When primary studies are either absent, unachievable or too expensive benefit transfer is a valuable tool to elicit values of environmental goods and services (Johnston et al., 2015). Primary studies are by most academics considered as the best way to provide information for policy decisions, but when necessary, benefit transfer is the second-best option (Johnston et al., 2015). Benefit transfer also improves the impact of primary research by expanding their relevance to other settings and time frames. It both provides policymakers with a tool for well-informed analyses of policies and other decisions as well as improving the gains from investing in primary valuation studies. The benefit transfer tool will be used to conduct the CBA in this study as it does not include performing a primary valuation study.
4.4 Limitations of CBA
As is the case for all methods, CBA entails several limitations. A significant limitation is that it might not be possible to quantify and assign monetary values to all impacts identified in the analysis (Boardman et al., 2014). To remediate this problem, impacts which are not possible to monetise should be described in qualitative terms such that the analyst could determine whether the inclusion of these costs or benefits would alter the outcome of the CBA. Another issue is that only a limited number of policy alternatives could be considered in a CBA, resulting in a risk of excluding policy alternatives which could have yielded higher NSB (Boardman et al., 2014). Scholars and philosophers have also criticised the fundamental utilitarian assumption in CBA, which is that the sum of all individuals’ utility should be maximised and that it is reasonable to make trade-offs in terms of gains and losses between individuals.
Because monetising benefits generally is the most challenging task in a CBA, an alternative approach is cost-effectiveness analysis (Boardman et al., 2014). This method allows the analyst to compare the ratio of quantified benefits to the total monetary cost to determine which policy alternative is the most cost-effective. Unlike CBA, this approach does not enable the analyst to conclude that the most cost-effective option is also the most efficient one. Another method where monetisation of impacts is not required is multigoal analysis, where different policy options are compared based on relevant goals.
5 Case study
The case study area is a location in the Southern part of Sweden with a groundwater source used for drinking water supply. The reference alternative in the case study is to keep the current water protection area. The water protection measure alternative is to expand the water protection area and impose more restrictive protection regulations. The majority of the information about site-specific conditions, characteristics of the groundwater source, the drinking water supply system and surrounding hazards has been collected by e-mail correspondence with, and from investigations sent by, the person responsible for water and sewage at the municipality. All information has been obtained from the contact at the municipality unless else is stated. The consultancy Sweco (www.sweco.se) developed the proposed water protection regulations and performed the technical description of the groundwater source and its hydrological conditions and the risk assessments. An appraiser at another consultancy performed the investigations on compensation to farmers for profit losses. All investigations were performed on behalf of the municipality. Some information has been left out to keep the anonymity of the case study area to avoid provoking any conflicts regarding the proposed expansion of the water protection area.
5.1 Description of the case study area
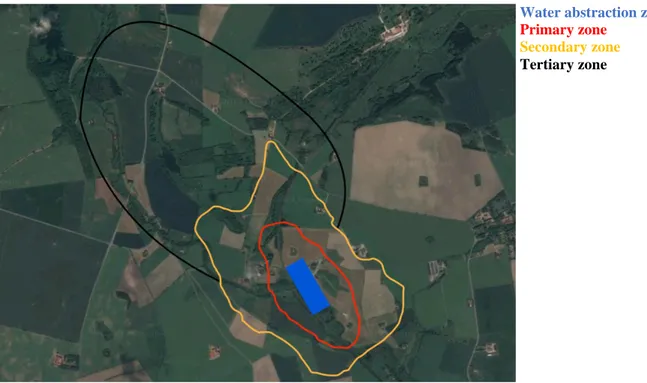
The groundwater source is situated in a valley, 5 km outside of an urban centre with around 6500 inhabitants. The remaining settlements in the catchment area consist of smaller communities and rural areas. The case study location with the proposed demarcations for the new water protection area is displayed in Figure 1 below.
According to the technical description, the groundwater source lies in a marsh region with a wetland and unexploited land on its western side. The remaining parts of the valley are characterised by open land, pastures and smaller areas of arable land, with surrounding
Water abstraction zone
Primary zone
Secondary zone
Tertiary zone
deciduous forests on its steep sides. Parts of the valley have high natural values, and vast regions north of the groundwater source are nature reserves and Natura 2000 areas due to its geological values and high biodiversity associated with, e.g. pastures, broad-leaved deciduous forests, swamp forest and wetlands.
A river runs from north to south throughout the valley, and three other additional rivers connect to it from west and east. The river, as well as the area around the groundwater source, is of national interest for nature conservation. There is a connection and a dependence between the surface and groundwater, but this relation is not fully elucidated. What could be concluded in the technical description is that the water level in the watercourses occasionally is lower than in the surrounding swelling sediment, resulting in induced leakage from the watercourses to the material in which the groundwater source is sited. The surrounding wetlands also depend on water supply from the groundwater source to some extent. The main activity in the catchment area, and around the groundwater source, is agriculture. There are some surrounding forested areas, but these are far away from the water abstraction zone, and the majority of the forests are not used for economic purposes.
5.2 Description of the reference alternative
The reference alternative of expanding the water protection area and impose stricter regulations is to maintain business-as-usual during the evaluation period of 40 years. This section explains the main activities in the case study area and their expected development in the reference alternative. These are activities which would be affected by the water protection measure. The current water protection area was established in the late eighties and covers around 95 ha (information obtained from the website Water Information System Sweden (WISS), www.viss.lansstyrelsen.se). Because the water protection area was established before today’s guidelines, it only has a single protection zone except for the water abstraction zone, in which only abstraction activities are allowed. According to the current protection regulations, spreading of manure, animal urine and other fertilisers must not take place in larger quantities than is required from a fertiliser point of view. Remaining types of fertilisers, as well as animal pesticides and plant eradication agents, must only be used to the extent necessary for regular use of the agricultural property. Spreading of pesticides is only allowed by the current legislation for usage of chemical products. Stockpiles of toxins and other hazardous substances which are harmful to groundwater require permission from the regional Environmental and Health Care Agency, but this is common practice in Sweden.
According to the contact at the municipality, no alternative protection measures besides an expansion of the current water protection area have been considered or investigated, but one option would be to invest in new cleaning techniques. As pesticide use is the primary concern in the case study area, filters with activated carbon could be installed in a future scenario with critical contamination levels in the untreated water, but this alternative implies other severe risks and costs related to, e.g. malfunctions, programming and maintenance. There are also substantial non-use values connected to naturally clean water (Hasler et al., 2007), which would be lost from this alternative measure. On the other hand, we cannot know for certain that the groundwater source would become contaminated by pesticides by proceeding business-as-usual. To account for this uncertainty, the probability of contamination occurring without imposing the water protection measure is assumed to be once during the next 100 years (see 5.7.3 for probability reasoning).
Climate change is an exogenous factor which could harm the drinking water supply in a future scenario. According to the estimations of SMHI (2015) the summers in the most southern parts of Sweden will become warmer and dryer and the winters warmer and wetter. Annual precipitation is expected to increase with 15-25% until the end of 2100, compared to the reference period of 1961-1991. Winter runoffs will be higher and the season with lower flows extended. More intense rainfalls will cause an increased risk of flooding along with pressure on existing risk sources which could give rise to, e.g. increased contaminant dispersion. Higher temperatures and annual precipitation also affect groundwater levels, but it is difficult to predict the exact effects of a future climate (Sydvatten, 2014). Depending on the type of soil, groundwater levels could increase by up to 25% or decrease with 10%. The weather alterations will result in changed conditions for the drinking water supply, but these effects are hard to predict and are not considered in this analysis.
5.2.1 Drinking water supply
The groundwater source in the case study area consists of four wells, and the annual water extraction is approximately 3 million m3 (information obtained from the municipality’s
website). The groundwater source provides drinking water to the urban centre with 6 500 inhabitants, another city with around 30 000 inhabitants and several other larger villages. The groundwater is extracted from a depth of 25 m and subsequently cleaned through a purification process with several steps in a water treatment plant. Finally, it is supplied via pumps to the water consumers. The water treatment plant provides around 22 500 persons with drinking water from the groundwater source of analysis (information obtained from the municipality’s website). The drinking water is used for food, drink, bath, shower, toilet and irrigation.
The groundwater source is judged to have a very high protection value4, as it constitutes the main public water supplier for the city, the urban centre and the villages in this region (SEPA, 2010). There are two backup groundwater sources if the current groundwater source were to be unfit for drinking water supply. However, since the distribution nets are not entirely composed to enable pumping of both raw water and treated water back and forth between the sources, they are not enough to fully cover today’s abstraction need without additional investments.
5.2.2 Agricultural activities
Seven farmers own or are tenants to ten properties with agricultural businesses within the proposed water protection area, and the total amount of agricultural land is 113 ha. One farmer has non-organic dairy production, one has beef cattle production, and the remaining farmers solely have crop production. The value of the current agricultural operations is assessed based on milk prices, beef cattle prices and estimated yields and prices from crop production. Expected future price developments are also considered.
According to investigations5 with estimations of profit losses for farmers affected by the new
protection regulations (obtained from the contact at the municipality), the crop rotation within the primary zone is composited as per Table 2. The appraiser collected data on yields, absolute prices (henceforth referred to as prices) and production costs from Agriwise (ww.agriwise.se),
4 This is the second highest value class out of four different classes (SEPA, 2010).
5 The investigations were carried out to calculate profit losses for the farmers in the case study area as a basis for
compensation. They were performed by a professional appraiser on behalf of the municipality. Names and all personal details about the farmers were anonymised in the investigations.
a farm tool for economic planning and analysis. The information on prices, costs and yields from the investigations were used in this analysis. The prices from the investigations were converted to new prices for 2018, by using the agricultural output price index and the costs by using the agricultural input price index, obtained from the Swedish Board of Agriculture (SJV, n.d.). Contribution margins were rounded off to integers.
Due to lack of data on the exact type of crop per hectare within the secondary and tertiary zone (see section 5.3), it is assumed that the crop rotation is the same in these zones since the natural preconditions are very similar, and several farmers have cultivations in two or all zones. Ley (used to produce silage) is cultivated on 50% of the land (56.5 ha) and the other crops are cultivated on the remaining 50% (56.5 ha) one year each in a four-year crop rotation cycle. One farmer grows winter rye in addition to the other crops.
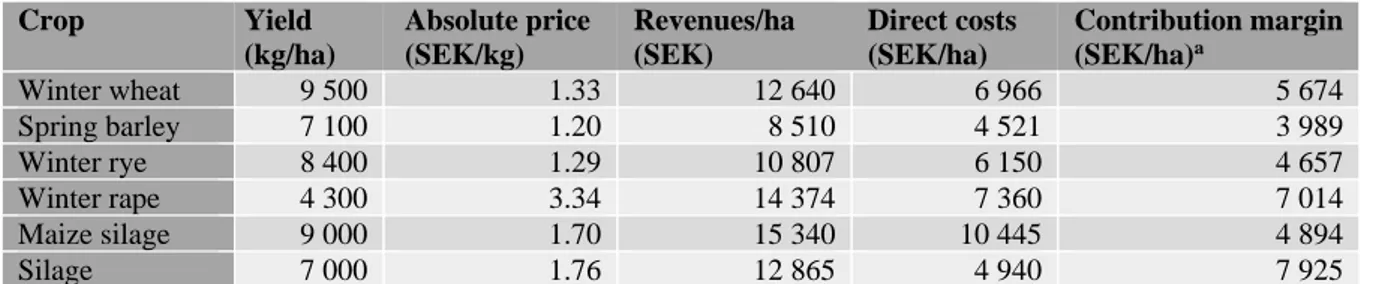
Table 2. Crop rotation, yields, absolute prices, production costs and contribution margins in the case study area (Source: Investigations on profit losses obtained from the contact at the municipality)
Crop Yield (kg/ha) Absolute price (SEK/kg) Revenues/ha (SEK) Direct costs (SEK/ha) Contribution margin (SEK/ha)a Winter wheat 9 500 1.33 12 640 6 966 5 674 Spring barley 7 100 1.20 8 510 4 521 3 989 Winter rye 8 400 1.29 10 807 6 150 4 657 Winter rape 4 300 3.34 14 374 7 360 7 014 Maize silage 9 000 1.70 15 340 10 445 4 894 Silage 7 000 1.76 12 865 4 940 7 925
a Net after direct production-related costs have been deducted. b Includes 500 SEK/ha in environmental support for cultivating ley.
Prices in SEK per 100 kg (2018 values) for non-organic milk, fattened calf6 and young male cattle7 are displayed in Table 3. There is no data over annual milk deliveries from the dairy
farmer or annual slaughter from the beef cattle farmer, but these are assumed to be constant throughout the evaluation period for the reference alternative.
Table 3. Absolute prices for non-organic milk, fattened calf and young male cattle (Source: the Swedish Board of Agriculture’s database. Absolute agricultural prices, SEK per 100 kg)
Product Absolute price (SEK per 100 kg)
Non-organic milk (actual fat content) 376 Fattened calf 2619 Young male cattle 3 273
Based on a thorough analysis of historical and forecasted price developments of agricultural commodities (see Appendix 3), the real price of winter wheat, spring barley and winter rye is assumed to decrease with 1% each year over the evaluation period. From the analysis of price development during recent years and a price forecast made by FAO and OECD (2018), milk prices could be expected to increase during the evaluation period, and beef cattle prices decrease, but due to lack of historical data, a sufficient prognosis could not be made. Annual prices for silage, maize silage and winter rape are also assumed to remain constant due to the same reasons and because different measurement techniques have been applied when collecting price data historically.
6 Slaughtered at the age of 8-11 months (Svenskt Kött, n.d.-b). 7 Meat from male cattle older than 12 months (Svenskt Kött, n.d.-a).
Annual yields typically fluctuate depending on exogenous factors such as weather conditions without specific upwards or downwards trends, hence yields are assumed to remain the same during the evaluation period. The effects of climate change described in 5.2.l may affect agricultural activities positively in terms of, e.g. longer cultivation seasons, but these effects are judged as too uncertain to be included in this analysis. This could result in an under-estimation of yields over the evaluation period.
5.2.3 Groundwater services
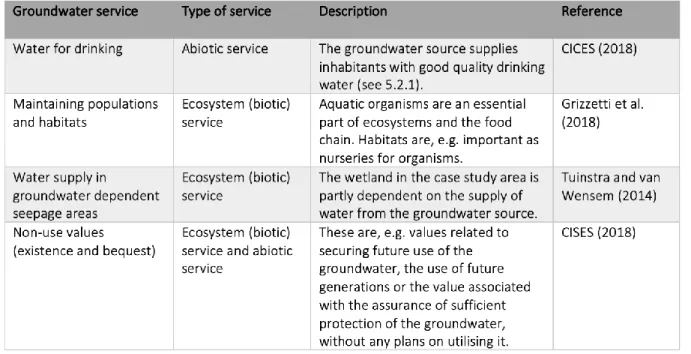
Activities affected by the water protection measure, in turn, influence the condition and supply of other groundwater services, besides “water for drinking”, which are important to include such that the TEV of the groundwater source is considered. As the case study area does not have any surface water sources for drinking purposes, only groundwater services are examined. Groundwater services supplied by the groundwater source are presented in Table 4. They have been identified based on the technical description of the water source and its hydrogeological conditions and the classification system of surface and groundwater services (Appendix 1). It is possible that the groundwater source provides other services, which could not be identified based on the material available.
Table 4. Groundwater services supplied by the groundwater source
5.3 Description of the protection measure alternative
The motivation for expanding the water protection area is that the Swedish River Basin District Authorities have introduced a new Programme of Measures as a consequence of the EU water framework directive. The Programme states that all water protection areas established before the introduction of the Environmental Code must be reviewed to ensure adequate protection. Another purpose is to protect the drinking water from pesticide contamination, which constitutes a risk due to the extensive agriculture. The decrease in hectares with pesticide-intensive crops such as cereal and oilseeds have been considerably lower in the most southern parts of Sweden compared to the rest of the country and pesticide use in kg/ha is higher
compared to other regions (HaV, 2014). However, no water quality measurements of the raw water from the groundwater source indicate anthropogenic influence or pesticides levels above current target values.
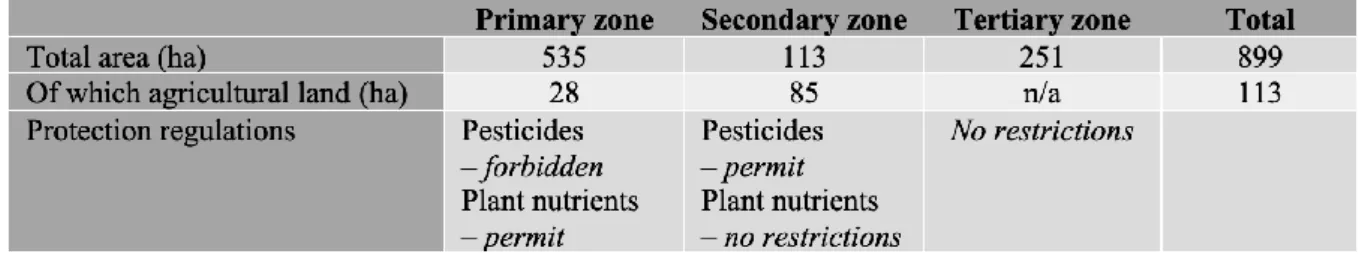
The proposed total water protection area is 899 ha, which includes 113 ha of agricultural land. The zoning is found in Table 5 and has been defined based on how many days it would take a specific pollutant to travel from the outermost part of the zone to the water source. The lifetime of the water protection area, interpreted as the time before it needs to be updated, is 40 years. This time horizon is chosen based on information about the lifetime of this type of water protection measure, obtained from the database Water Information System Sweden (WISS, www.viss.lansstyrelsen.se).
Table 5. Zoning, agricultural land and regulations within the proposed water protection area
According to the new protection regulations, spreading of pesticides is forbidden in the primary zone. Spreading and handling of pesticides in the secondary zone requires a permit. Spreading of plant nutrients requires a permit in the primary zone, but not in the secondary zone. Exceptions apply for those farmers operating within the primary zone who have permits for animal keeping regulated by the Environmental Code which includes land for spreading of manure from the animals. Because it is unknown whether the farmers with animals also use commercial fertiliser for their crop production, it is presumed that they have to seek a permit for spreading of plant nutrients as well. There will not be any protection regulations in the tertiary zone.
It is assumed that permit applications are required per farmer, and not per property, and that the farmer needs two separate permits for spreading of pesticides and plant nutrients. A permit may be associated with special conditions which the farmer must follow for the permit to be valid (SEPA, 2010), but for this analysis a permit will imply permission for spreading of pesticides and plant nutrients according to business-as-usual. The permit requirements allow the municipality to monitor the use of pesticides and plant nutrients to ensure these activities are carried out without risk of contamination to the groundwater source. The regional Environmental Confederation (Miljöförbundet) manages all permit applications.
The protection regulations include additional paragraphs regulating other activities in the catchment area, but these pose a relatively low risk to the groundwater source (information collected from risk assessments obtained from the contact at the municipality). Hence, even though this analysis explicitly focuses on the agricultural sector, the effect on these other activities from the protection measure is probably negligible.
5.4 Impacts of the protection measure alternative
Table 6 lists the activities which will be affected by expanding the current water protection area and imposing stricter protection regulations. The drinking water supply and other groundwater services are expected to be positively affected by the new regulations, whereas the agricultural sector is expected to be negatively affected. Benefit and cost items associated with these impacts are identified in Table 7. Benefits are protection of good quality drinking water and reduced risks to other groundwater services related to restricted pesticide use. The agricultural sector will experience costs in terms of reduced profits due to restrictions on pesticide use, and administrative costs related to permit applications.
Table 6. Activities affected by the protection measure relative to the reference alternative. (+) implies positive impact and (–) implies negative impact
Activity Impact
5.2.1 Drinking water supply (+) 5.2.2 Agricultural activities (–) 5.2.3 Groundwater services (+)
Table 7. Cost and benefit items from implementation of the water protection measure relative to the reference alternative
Costs Benefits
Administrative costs Protection of good quality drinking water Reduced profits in the agricultural sector Avoided risks from pesticide use
5.5 Quantification
This chapter describes how the different cost and benefit items associated with the protection measure alternative were quantified.
5.5.1 Administrative costs
The new protection regulations will imply administrative costs for the farmers who have to apply for permits. The four farmers with crop production in the primary zone will need a permit to spread plant nutrients within this zone, and since all seven farmers have some production in the secondary zone, they all have to apply for permits to spread pesticides. Administrative costs are quantified based on information from a recent report evaluating costs and benefits from establishing a water protection area on Gotland (Sweco, 2017). Because of the comprehensiveness of the applications, farmers generally hire a consultant to make the applications. The regional Environmental Confederation subsequently decide whether to grant permission or not. On average, a permit application is expected to require six hours of work and the administrator at the Environmental Confederation is expected to need four hours to administrate the application and make a decision. It is assumed that the permits have to be renewed every third year (Sweco, 2017).
5.5.2 Reduced profits in the agricultural sector
Reduced profits were quantified based on the information from the investigations on profit losses to farmers obtained by the contact at the municipality, but the method for calculating the profit losses have some differences in this analysis and assumptions made do not necessarily reflect the ones in the investigations. The reason for these differences is that a CBA is performed from a societal perspective and has other assumptions as a basis, and the results of the analyses are not to be compared with each other.
According to the investigations, the most likely scenario is that the farmers within the primary zone, who are prohibited from using pesticides, will switch to a crop rotation with three years of ley (to produce organic silage) followed by one year of fallow. This cycle is assumed to continue throughout the evaluation period and will result in lower yields per year, enhanced due to one year of fallow. The annual yield is 4400 kg/ha.
5.5.3 Protection of good quality drinking water
The quantification of this benefit was made based on the daily consumption of drinking water from the groundwater source, which is suggested as a relevant indicator of this groundwater service by Grizzetti et al., (2016). Daily consumption of drinking water amounts to 160 litres/person/day for a total of 22 500 persons.
5.5.4 Avoided risks from pesticide use
To quantify the impact on ecosystem services identified by a classification system, the effect on ecosystems’ capacity to supply ecosystem services must be clarified in biophysical terms with proper indicators (TEEB, 2010). However, guidelines for choosing good indicators for assessing ecosystem services are still lacking, resulting in inconsistent assessments (Hattam et al., 2015). When the functioning of, and the interdependence between, ecosystem services are poorly understood, as is the case at the location of analysis, the challenge to find adequate indicators is aggravated (Hattam et al., 2015). Due to these issues, the impact on all groundwater services was valued jointly, except for effect on drinking water supply (see 5.5.3).
The value was assessed from peoples WTP to avoid risks to groundwater by reducing pesticide use in the agricultural sector. The value was assumed to be provided to all households within the water supply area, which is approximately 10 227, obtained by dividing 22 500 (water consumers) by 2.2 (average number of persons per household in Sweden, SCB, n.d.). The number of households who are willing to pay to reduce environmental and health risks from pesticide use could be larger than the people receiving drinking water from the groundwater source, hence the estimated benefit could be regarded as a minimum value.
5.6 Discount rate
To evaluate the annual impacts of imposing the protection measure alternative, a central step is to decide which weights to apply to the impacts occurring each year of analysis (TEEB, 2010). By applying weights to all impacts throughout the evaluation period, it is possible to compare the costs and benefits appearing in the future, to the costs and benefits arising today. The decision about the proper set of weights to apply is carried out by selecting a SDR. This choice is of absolute importance when conducting a CBA (TEEB, 2010). Depending on the level of
the SDR, the outcome of the CBA and thus the recommendation whether to implement the project or policy, could vary substantially.
Choosing the right SDR is especially challenging regarding environmental projects and policies, since they usually have a long lifetime with impacts taking place far into the future (Boardman et al., 2014). A high SDR severely disfavours projects with benefits occurring far in the future, and costs in the beginning of its lifetime. Hence, it is commonly argued that a declining SDRs over time is more ethical, especially for environmental projects such as reforestation and restoration of ecosystems, where benefits from an investment are realized many years ahead. A declining SDR also gives more weight to future generations (Arrow et al., 2014). Because of the importance and uncertainty associated with the choice of SDR, it is necessary to evaluate the outcome of the CBA depending on different levels of discount rate. In the base scenario of this study, a discount rate of 3% will be applied in accordance with the recommendations of the European Commission (2014). For the sensitivity analysis, the effect of SDRs of 1,5% and 6% will be evaluated, following the suggestion of Johansson and Kriström (2016).
5.7 Valuation
In this chapter, costs and benefits from the protection measure alternative are monetised. That is, expanding the current water protection area to 899 ha and imposing more restrictive regulations. The evaluation period is 40 years, and all values are discounted to the base year 2018 with a 3% SDR. All costs and benefits are expected to occur at the end of every year, except for administrative costs which are assumed to incur at the beginning of every third year.
5.7.1 Administrative costs
Administrative costs were monetised based on hourly consulting rates for managing permit applications and hourly charges for administrating applications (Table 8). All price data was retrieved from the Sweco report (2017)8. The PV of administrative costs is SEK 774 233
(calculations in Appendix 2).
Table 8. Work time, price per hour and price per permit for consultancy and administration (Source: Sweco, 2017)
Time (h) Price (SEK/h) Price/permit
Consultant 6 800 4 800
Administrator 4 900 3600
5.7.2 Reduced profits in the agricultural sector
To elicit new 2018 values for organic silage, the same procedure was performed as in the reference alternative (Table 9). To calculate the costs for the agricultural sector, profits from crop production in the reference alternative were compared to the profits from crop production in the protection measure alternative. Based on the analysis in section 5.2.2, the real prices of winter wheat, spring barley and winter rye are assumed to decrease with 1% each year over the
8 The authors of the report collected the hourly rates and charges from The Rural Economy and Agricultural