Master of Science Thesis
KTH School of Industrial Engineering and Management Energy Technology EGI-2020:381
InnoEnergy
Division of Energy Systems SE-100 44 STOCKHOLM
Power investm ent outlook for Chile to 2040
Master of Science Thesis EGI 2020:381
Power investment outlook for Chile to
2040
Brendan Abadie Approved 2020-06-16 Examiner Dilip Khatiwada Supervisor Maryna HenryssonA bstract
This study aims to build a medium-term (2019-2040) model for the Chilean
electricity generation system in the OSeMOSYS software, a linear cost optimisation model, in light of the most recent developments in government policy and targets. In 2019, the Chilean government committed to decommissioning all coal plants by 2040 at the latest, and set out a non-binding target to be carbon neutral by 2050. The carbon neutrality target could be enshrined in the climate change law, which has yet to be ratified. In this thesis, a focus was put on the upfront capital cost of the
system, and the emissions attributable to Chile’s GHG Inventory (called the SNI GHG in Chile) from operating the system.
Three scenarios are developed within the thesis, in line with three paths the power system may follow: a BAU scenario including current power purchase agreements, a scenario in which power purchase agreements for fossil fuels are bought out and the free market then takes over, and a non-conventional renewable energy (NCRE) scenario in which certain renewable technologies account for 68% of production in 2040. The model is validated against the results from 2019 and a broadly similar model developed in the private sector.
Sensitivity analysis scenarios were conducted for the input parameters: price of natural gas, price of coal, capital cost of solar PV, capital cost of wind, capital cost of wind & solar, and the capacity factor of hydropower. The sensitivity analyses show the most sensitive input parameters are the price of natural gas and capital cost of wind with respect to the outputs of capital cost, NCRE production ratio such as the share of all solar, wind, and certain hydro technologies as a percentage of total electricity production and GHG emissions.
A bstrakt
Denna studie syftar till att bygga en medelfristig (2019-2040) modell för det chilenska elproduktionssystemet i programvaran OSeMOSYS, en linjär kostnadsoptimeringsmodell, mot bakgrund av den senaste utvecklingen i regeringens politik och mål. År 2019 åtog sig den chilenska regeringen att stänga av alla kolanläggningar senast 2040 och fastställde ett icke-bindande mål att vara koldioxidneutralt år 2050. Målet om koldioxidneutralitet kan fastställas i lagen om klimatförändringar, som ännu inte har ratificeras. Detta arbete fokuserar på systemets kapitalkostnad i förväg och de utsläpp som kan hänföras till Chiles GHG-inventering, kallad SNI GHG i Chile, från drift av systemet.
Tre scenarier utvecklas inom avhandlingen, i linje med tre scenarier som kraftsystemet kan följa: ett BAU-scenario inklusive nuvarande kraftköpsavtal, ett scenario där kraftköpsavtal för fossila bränslen köps ut och den fria marknaden sedan tar över, och ett scenario med icke-konventionell förnybar energi (NCRE) där vissa förnybara tekniker står för 68% av produktionen 2040. Modellen valideras mot resultaten från 2019 och en i stort sett liknande modell utvecklad i den privata sektorn.
Känslighetsanalysscenarier genomfördes för ingångsparametrarna: pris på naturgas, kol på pris, kapitalkostnad för solceller, vindkraft, kapitalkostnad för vind & sol och kapacitetsfaktor för vattenkraft. Känslighetsanalyserna visar att de mest känsliga ingångsparametrarna är priset på naturgas och kapitalkostnad för vind med avseende på kapacitetskostnadens produktion, NCRE-produktionskvoten, till exempel andelen av alla sol-, vind- och vissa hydroteknologier i procent total elproduktion) och växthusgasutsläpp.
Contents
Contents ... 5
1 Introduction ... 1
Background ... 1
Aims, scope objective ... 2
Thesis structure ... 3
Literature review ... 4
1.4.1 Policy for renewable energy investment and GHG emission ... 4
1.4.2 Power system modelling tools ... 5
1.4.3 Power system models in the global context ... 7
1.4.4 Power system and related models in Chile ... 7
2 State of Affairs in Chile ... 10
Country Context ... 10
2.1.1 History ... 10
2.1.2 Electricity Sector Profile ... 11
2.1.3 Potential ... 13
Institutional Environment ... 14
3 Methodology ... 18
Scenario and Modelling Approach: Open Source Energy Modelling System (OSeMOSYS) ... 18
3.1.1 Origins of the OSeMOSYS model ... 18
3.1.2 Techno-economic parameters used in the model ... 19
3.1.3 Designing a Reference Energy System for Chile ... 21
3.1.4 Scenarios ... 22
Assumptions and data sources ... 23
3.2.1 Global assumptions ... 23
3.2.2 Specific data sources and assumptions ... 25
4 Results... 36
Scenario 1: Business as Usual Scenario ... 36
Scenario 2: No Power Purchase Agreements Scenario ... 40
Scenario 3: Non-Conventional Renewable Energy Scenario ... 43
Results of sensitivity analysis ... 47
Model calibration... 49
5 Discussion ... 51
6 Conclusion ... 62
7 Further research ... 64
8 Annex ... 66
How OSeMOSYS works... 66
Model calibration... 68
List of Figures
Figure 1 Breakdown of the old electrical system in Chile. SIC and SING have since been connected to form the SEN. Map icon retrieved from [136] ... 12 Figure 2 Authors own graphic of the generation mix in Chile in 2018 presented in the Anuario Estadístico [65]. ... 13 Figure 3 Visual depiction of functionality block structure [98] ... 19 Figure 4 The reference energy system for used to design the OSeMOSYS model for Chile ... 21 Figure 5 The demand, in PJ, as modelled and predicted by the CNE in Chile [127]. ... 32 Figure 6 The annual, demand per capita, in GJ. (source: Author’s estimation from CNE demand projections and World Bank population projections [125,135,138] ... 33 Figure 7 Demand profile for free customers with a demand of more than 5 MW [103]. ... 33 Figure 8 Demand profile of regulated customers with a demand of less than 500 kW, or between 500 kW and 5 MW should they choose to be regulated customers [103]. 34 Figure 9 Production by technology, in PJ, for the BAU scenario in the time period 2019-2040 ... 36 Figure 10 Capital investment, in US$M, for the BAU scenario in the time period 2019-2040 ... 37 Figure 11 Total annual capacity, in GW, for the BAU scenario for the time period 2019-2040 ... 38 Figure 12 Annual emissions, in Mt, in the BAU scenario in the time period 2019-2040 ... 38 Figure 13 Production by technology, in PJ, for the Null PPA scenario in the time period 2019-2040 ... 40 Figure 14 Capital investment, in US$M, for the null PPA scenario in the time period 2019-2040 ... 41 Figure 15 Total annual capacity, in GW, for the null PPA scenario in the time period 2019-2040 ... 42 Figure 16 Annual emissions, in Mt, in the no PPA scenario in the time period 2019-2040 ... 42 Figure 18 Production by technology, in PJ, for the NCRE scenario in the time period 2019-2040 ... 43 Figure 20 Capital investment, in US$M, for the NCRE scenario in the time period 2019-2040 ... 45
Figure 19 Total annual capacity, in GW, for the NCRE scenario in the time period 2019-2040 ... 44 Figure 21 Annual emissions, in Mt, in the NCRE scenario in the time period 2019-2040 ... 45 Figure 22 Comparison of emissions between BAU scenario (left) and the null-PPA scenario (right) which have the same investment costs. ... 51 Figure 23 Comparison of the capital investment cost and annual emissions for the BAU (top), null PPA (middle) and NCRE (bottom) scenarios. ... 53 Figure 24 Comparison of the production by technology and emissions for the BAU (top), null-PPA (middle) and NCRE (bottom) scenarios. ... 54 Figure 25 Comparison of investment (capital) costs between the null-PPA (left) and NCRE (right) scenarios ... 56 Figure 26 Different options for regional splits within the OSeMOSYS model, each with specific advantages and disadvantages. Left: current implementation of one SEN region, middle: two region model for SIC and SING with accurate demand
projections for each to model the transmission upgrades needed, right: smaller regions [136]. ... 59 Figure 27 Gross capacity additions and cumulative investments from BloombergNEF Chile Power System Outlook, for the coal-phase out scenario. Both figures and results are completely produced by BloombergNEF [59]. ... 68 Figure 28 The annual emissions for the coal-phase out scenario from BloombergNEF Chile Power System Outlook, for the coal-phase out scenario. Both figures and results are completely produced by BloombergNEF [59]. ... 69
List of Tables
Table 1 Key companies involved in the generation, transmission and distribution of electricity in Chile [63]... 11 Table 2 Institutional summary surrounding electricity production. Format of table developed with NewClimate Institute [90] ... 16 Table 3 Time independent parameters used in the model [99]... 19 Table 4 Time dependent parameters used in the model [99]... 20 Table 5 Individual technology discount rates from 2013 DECC figures, as reported in 2015 NERA paper [102] ... 23 Table 6 Reference investment (capital, fixed costs and non-fuel variable costs as laid out by the Comisón Nacional de Energía (CNE) using 2018 values [104].. Some
figures are provided in the government report as a range. This thesis uses the middle value of the range. ... 25 Table 7 Global values for the commodity price forecasts from the World Bank
Pinksheets, compared with the World Outlook 2017 [107]. These values are then converted to Chile using a conversion factor based on the 2019 values. ... 26 Table 8 Specific consumption of fossil fuel technologies in Chile, as an average [104]. ... 27
Table 9. Capacity expansion (in MW) for currently under construction projects ... 28
Table 10 Lifetime operation emission factors for both NCRE and biogenic sources for Solar PV, Wind Power, CSP, dam hydropower, factoring in technological
improvements in the next 30 years as new technologies and processes for production are evermore efficient [121] ... 31 Table 11 Emissions factors used in the model for Chile based on EPA values ... 31 Table 12 Summary table of the sensitivity analysis results. Red text represents an undesirable change with respect to the thesis research and Chile’s goals. ... 47 Table 13 Comparison of operating and construction emissions for NCRE and dam hydro ... 57 Table 14 Comparison between the production by NCRE, total investment cost and emissions across the three scenarios in 2019 and 2040 ... 61 Table 15 Demand projection by the CNE for the years 2018-2038 for regulated and free customers [51] ... 70 Table 16 Parameters for conventional fossil based energy sources [104,119,135] ... 71 Table 17 Residual capacity, in GW [65] ... 72 Table 18 Variable cost, in US$M, for each year of the modelling period, displayed in the top row (i.e. 19=2019) ... 73 Table 19 Total annual minimum activity constraint used for the BAU scenario ... 74 Table 20 Minimum renewable energy production target for tagged commodities, as used in the NCRE scenario ... 74 Table 21 Total annual max capacity investment constraint (in units of GW) ... 75 Table 22 Total annual max capacity constraint used in all scenarios. Small
hydrowpower has environmental licenses for 1 GW up to 2025. It is assumed that, because it is an NCRE technology, there will be no limit on this afterwards. Dam hydropower and run of the river hydropower both have limited environmental
A cknowledgm ents
Several people are due thanks for enabling this thesis to happen. First, my wonderful supervisor Maryna who has stuck with me through thick and thin to ensure that I graduate, providing amazing reviews. I do most appreciate all the help.
Professor Khatiwada for the advice and support as my examiner, which helped me to create a more fully rounded scientific model.
The team at NewClimate Institute – Lukas Kahlen, Tom Day, Sofia Gonzales-Zuñiga, Swithin Lui and Frauke Röser – who gave me the opportunity to discover and learn about the science governing politics in the climate crisis movement (and for the data visualisation tricks, as seen in some tables here).
Lastly, this mater thesis was part of the InnoEnergy MSc Renewable Energy, my thanks be to them.
1
1 Introduction
B ackground
In order to achieve the Paris Agreement’s long-term temperature goal to hold the global average temperature increase to well below 2°C above preindustrial levels and to pursue efforts to limit the temperature increase to 1.5°C, governments around the world need to raise ambition, beyond that which is currently seen globally [1].
Looking at a sample of 31 countries found in the Climate Action Tracker, just two are Paris Agreement compatible, and just a further five are 2C compatible.
Therefore, as things stand, the global effort to reduce greenhouse gas (GHG) emissions is insufficient [2,3].
The production of electricity is both the primary cause of climate change and the primary means of mitigation [4]. Whilst all sectors must contribute to achieving the goal set forth in the Paris Agreement, the electricity sector can and has to move faster as low-carbon electricity provision is a key enabler for the decarbonisation of other sectors [5]. However, whilst the operation of the electricity sector transcends simple market transactions, and is impacted by governance and institutional arrangements, I will focus on the energy policy that Chile has set out and its international commitments [6].
Therefore, fundamental to reducing GHG emissions in the electricity sector is the deployment of renewable energy technology [7]. To model future energy systems and predict emissions pathways based on policy scenarios, there are now many competing techno-economic models which provide policy makers and academics with a view of the economic implications of filling the gaps in technology which many current climate policies around the world are targeting. Such models include
TIMES/MARKAL, LEAP, POLES, PROSPECTS+ and OSeMOSYS [8–11]. The electricity sector is often the highest emitting sector in a country, even in countries where the economy relies on production from sectors such as agriculture [12,13]. However, despite major advancements in some countries, globally efforts to decarbonise the energy supply has largely failed, with the carbon emissions intensity average remaining largely the same from 1990-2013 [14–16].
In this regard, Chile is of great interest. Chile’s contribution to global emissions is just 0.2%, but the emissions for the electricity sector grew by 101% between 1990-2010 whilst the energy generation from non-conventional renewable energy (NCRE) grew from 5% to 22% between 2014 and 2019 [17,18]. Chile has set a very ambitious goal of net-zero emissions by 2050, but has not published a concrete electricity sector
2 plan for the next 20 years to achieve this target, let alone an accountable, specific economy wide plan. In fact, even the planned decommissions for coal power plants only goes up to 2025 [19]. As such, there is a need for a model which will lay out a plan which will enable the country to stick to its commitments, of special importance given that there is an 84% gap in capacity between the current installed low-emission technologies and the needed capacity. The SAMBA model captured elements of the Chilean electricity sector in 2015, but had a Brazilian focus and now has outdated data sources [20]. A 2012 paper performed a scenario assessment using MESSAGE for just Chile, but this assessment has two limitations: first, 2012 data is outdated and second the assessment was conducted before the grid interconnection of 2017 between SIC and SING [21]. Furthermore, MESSAGE is not free to use in all cases, unlike OSeMOSYS. As such, I used OSeMOSYS to assess the Chilean electricity sector and mitigation potential with current data and policies. It is particularly relevant because this will be the first Chile centred OSeMOSYS model.
A im s, scope objective
The overall objective of this thesis is to determine the cost for the electricity sector of Chile’s coal phase out plan, and the 2050 net zero emissions commitment, and to calculate the resultant model period emissions. The GHG emissions results are then benchmark compared to international commitments to the UNFCCC, including their Biennial Update Reports and the draft updated National Determined Contribution. The purpose of the research then is to evaluate the potential for 100% renewable energy deployment in a country case for Chile, and then quantify the annual point of use emissions for the sector if national goals are reached. As such, the primary
research question is: “What will be the GHG emissions and investment costs for the
electricity sector if Chile achieves its goal to be coal free by 2040?”. Following on
from this, a sub-research question is “What will be the GHG emissions and
investment costs for the modelling period of 2019-2040 if Chile achieves its goal of carbon neutrality by 2050?”
This study constructed an OSeMOSYS model to develop a pathway for the current 2050 net-zero plan using available data sources, for the medium term 2019-2040 using 2018 as a base year. Three scenarios were constructed: a business as usual scenario, a scenario with no power purchase agreements, and a non-conventional renewable energy scenario. The scenario rationale can be found in the Methodology (Section 3). The scope of this thesis encompasses renewable energy generation in Chile from 2019-2040. Whilst Chile currently has the absolute transmission and distribution networks
3 to transport electricity, this may not be the case region to region. As official
government figures for data from 2017 onwards are given for the combined region Sistema Electrico Nacional (SEN), and not Sistema Interconectado (SIC) or Sistema Interconectado del Norte Grande (SING), this thesis does not model granular inter-regional transmission and distribution. Furthermore, this thesis covers three types of emissions: methane, carbon dioxide and NOx. Emissions sources and values can be found in the Emissions Factor section of the Methodology. This thesis does not cover yet other co-emitted air pollutants such as PM2.5. As the emissions penalty for NOx is locally based (sometimes to within 100km2), it was not possible to include this penalty for the Chile region as a whole.
Thesis structure
This thesis contains 8 chapters in total.
Chapter 1 covers the background and motivations of the project before moving to a literature review covering: policy for energy investment and GHG emissions; power system modelling tools in a global context; and power system modelling tools in the Chilean context.
Chapter 2 presents the current state of affairs in Chile, looking at the history of the economy of the state before examining the existing power system infrastructure, management of the system (both generation and transmission & distribution), the potential for renewable energy generation in the country, and the overarching institutional structures and laws which have had a profound impact on the generation mix over the past decade.
Chapter 3 presents the methodology, providing the key data sources and reasoning behind assumptions.
Chapter 4 presents the results for the capital cost, GHG emissions and NCRE share for the three scenarios.
Chapter 5 is the discussion and analysis of results, which is followed by the
conclusion in Chapter 6. Chapter 7 provides ideas and rationale for further areas of research, and Chapter 8 contains the Annex with additional information.
4
Literature review
1.4.1 Policy for renewable energy investment and GHG emission
First this study will look at the effect of (climate) policy on investments in renewable energy. The first and most direct policy instrument available to a government is the variety of pricing and incentive mechanisms. If able to set variable pricing, a country may wish to choose between flat pricing and peak pricing, and Kök et al found that flat pricing can lead to substantially lower carbon emissions (through renewable energy investment) in the majority of scenarios they explore [22]. The other pricing mechanism which more and more countries are choosing to employ is subsidies on renewable energy investment and carbon emissions. Two common subsidies are direct subsidies in the form of tax credits, and indirect subsidies in the form of taxes [22]. A study by Emodi et al using a LEAP-OSeMOSYS model found that a carbon tax in Australia would reap economic benefit, resource savings and lower environmental externalities by 2050 [23]. A carbon tax can, however, also have the adverse effect on renewable energy investment if the emission intensity of conventional energy sources is sufficiently low (such as in the case of a well performing carbon capture storage system) [22]. Polzin et al found similar results in that taxes (generally) could have a negative impact on further capacity additions in renewables, although solar might buck the trend by seeing increased investment [24]. Cansino et all found that a Pigouvian tax in the form of a Fossil Fuel Levy (directly penalizing fossil fuels) was effective at encouraging renewable energy investment, whereas Polzin found that tax reductions for renewables tended to increase overall capacity in renewables [24,25]. However, despite the ambivalence of taxes’ effects on renewable energy investment in the literature (i.e. taxes can help or harm investment depending on the broader situation and other variables), carbon taxes have a multilateral positive effect on GHG emissions reductions throughout the economy, even when they are only levied in the electricity sector [26]. Finally, Renewable Portfolio Standards (RPS) are perhaps the most forceful directive a government can give to those who run the generation system, and by nature ensures increased investment in renewables by creating a minimum renewable energy capacity – such a programme is used in Chile with the Renewable Energy Law 20.257 [27]. However, although RPS are a heavy handed directive from the government to increase renewable energy investment, such standard introduce uncertainty for those running the system by complicating
investment decisions, and can have delays of 5-10 years between policy implementation and project completion [28].
5
1.4.2 Power system modelling tools
There are two main types of energy model: techno-economic models which are bottom-up models that start with the individual power facilities and technologies that fall under the field of Process Systems Engineering (PSE), and macroeconomic models which attempt to project the corresponding economic, power infrastructure or employment net costs and impacts caused by certain policies through a top-down approach, falling under the field of Energy Economics [29]. Energy system models in PSE typically operate at the unit operation, processing plant or supply chain scale, each representing a different level of aggregation [30]. Energy economics approaches use models with a high level of aggregation which based on economic theory such as the laws of supply, demand and market equilibrium [30]. These two different models are often used by different interest groups for different purposes, as each tends to lend itself to specific results. Macro-economic models are often cited by trade associations, energy intensive (supply) companies and conservative policy makers, whereas as pro-climate groups tend to opt for bottom up models as they provide greater granularity to the full consequences of different technologies. In essence, the differences between the two types of models relate to the level of aggregation and the scope of assumptions that one makes when taking one of the two approaches. There is obviously a desire to unify the two approaches and whilst economic theory does provide a unifying concept for both approaches, models mostly formulate problems as a system of linear equations which can be relatively easily solved [31]. Yet, to this day, the simplicity of using one system or another lends to energy modellers adopting one software or another.
There are several different bottom up models which serve a similar purpose, such as TIMES/MARKAL (of which PRIMES and NEMS are in the same family), LEAP, POLES, PROSPECTS+ and OSeMOSYS.
MARKAL/TIMES is a family of energy/economic/environmental models designed under the IEA’s Energy Technology Systems Analysis Programme which began in 1978. TIMES is now the primary model and receives update support every few months. The source code is free of charge after signing an agreement to not
distribute the code to third parties, after which a shell – usually ANSWER or VEDA – is used to manage the system. However, MARKAL/TIMES is written in GAMS, a commercial software, and due to the nature of the source code a license for the
software is needed, which can cost up to US$20,000, which is a major barrier to most interested parties [8].
6 PRIMES (Price-Induced Market Equilibrium System) model was developed at the National Technical University of Athens in a project co-financed by the European Commission. PRIMES was designed to focus on market-related mechanisms and explicitly project prices influencing the evolution of energy demand/supply and technology development. Evidently the electricity sector has developed a great deal between the project kick off in 1993 and 2019, so the model has received continued support and updates as well as peer reviews in the European Commission framework in 1997 and 2011 [32]. As PRIMES is a mature energy modelling system, researchers have expanded it in several different sectors (such as the transport sector with PRIMES TREMOVE) and sub-sectors (such as the Gas supply sector in a country). POLES is a recursive simulation model of the world energy system which includes an equilibrium of the energy markets. The model facilitates the assessment of energy demand and supply options through the lens of certain policies, such as GHG mitigation policies. The model does not allow for projections based on assumed technological improvements in the future, nor does it account for unintended consequences that may derive from the utilisation of any given technology, such as food shortages if the model recommends ramping up biomass. In this sense, whilst the model can match energy needs accurately, it somewhat struggles with providing an accurate long term view, and may be better suited to 10-15 year projections [33]. Also from the MARKAL/TIMES family of models is NEMS (the National Energy Modelling System), another energy-economy model, this time from the U.S. used to project production, imports, conversion, consumption and prices of energy. NEMS is a fairly rare case of a modelling system devised by and used by a government agency, in this case the U.S. Department of Energy [34].
In this thesis, OSeMOSYS (a bottom-up approach) is used. OSeMOSYS has been used extensively to cover energy systems in Africa using the TEMBA model, South America in the SAMBA model and even on a global scale in the OSeMOSYS based translation GENeSYS-MOD which was cited in the IPCC special 1.5C report [20,35– 37]. The TEMBA model represents each continental African country’s electricity supply system and transmission links between them, allowing for continent wide dialogue amongst all members and comprehensive energy planning. SAMBA focuses on the electricity supply infrastructure of South America with a focus on
hydropower, and is dominated by Brazil. Notably, however, a little granularity is lost as the scale of the models increase, and at the same time new data and policies are always being released in country specific scenarios. Such is the case with the SAMBA
7 model, which focuses on Brazil and hydropower but also includes information and model capabilities for Chile.
1.4.3 Power system models in the global context
On the subject of cost optimization power modelling in the global context, there is a plethora. The following is a short section of highlights. Tailor made code can be used to provide highly customizable optimization problems. Although they take longer to set up initially, the design allows for custom inputs, such as the results of global climate models (CGM). This has been used to quantify the impacts of climate change on energy systems [38]. OSeMOSYS has been used to model the power system
infrastructure of entire continents in the case of TEMBA and SAMBA [20,36].
Following from this, LEAP-OSeMOSYS hybrid models has been used to examine the effectiveness of emission reduction policies under climate change for optimization analysis, including tax policies and clean energy substitution models [23]. Syri et al used PRIMES to develop low-CO2 energy pathways and regional air pollution models in Europe examining a variety of pollutants [39]. POLES has been used to inform policy decision-makers on mitigation strategies and energy technology learning rates to forecast future lower prices [40]. Finally, the mitigation action plan scenarios (MAPS) Chile project claims to have used scientific modelling techniques to plan mitigation scenarios and energy planning (with a focus on low carbon development, rather than cost optimization). However, the data is outdated (from 2013) and information is very scarce on the actual tools used, and it is not easily available to academics [41]. Therefore, there is a lack of energy planning literature for Chile, never mind with a focus on investment costs and emissions reductions.
1.4.4 Power system and related models in Chile
Below is a summary of the literature that does exist for Chile, which look at emissions, climate effects or have Chile as part of a global model which focuses on pure energy planning, rather than both investment planning and emissions planning. The power infrastructure in Chile has been in a rapid state of change over the last four years with the introduction of Energy 2050 policy document [42]. On top of these developments, Law 20.257/08 on non-conventional renewable energy, which stated 5% of generation for medium-large producers needed to be from
non-conventional renewable energy (NCRE) sources in 2010-2014, started an incremental progression of requirements for producers in the country [27].
However, despite this, no cost optimization power modelling exercises have been to match demand to supply in light of the future NCRE.
8 Raugei et al developed a life cycle analysis (LCA) and net energy analysis (NEA) to evaluate existing data against data extrapolations to predict the future demand and supply in the year 2035 [43]. This approach sought to evaluate the energy system without being fixed to cost restraints. Whilst a valuable study to determine feasibility, economic parameters need to be included as this is what a government must do when conducting planning exercises. Bergen et al created their own mixed-integer linear stochastic optimization model to create a scenario based evaluation of the effect of environmental policy decisions on the energy mix and transmission investments required, but did not specifically focus on emissions [28]. Benavides et al used the GEM-E3 model, calibrated with projections from the PRIMES model, to produce a hybrid approach which evaluated how various carbon tax values above the existing $5/ton would impact the energy system [18]. Pereira et al focused more on GHG emissions when developing their own linear optimization model to link
emissions to carbon tax levels, including 155 transmission lines and 9 candidate lines linking 46 buses with up to 10 different generation technologies. This was modelled hourly for two representative days over summer/winter, but for a relatively short period from 2020-2029 [44]. O’Ryan et al created a simplified link between the ECOGEM Chile CGE model and a bottom-up type energy model built by the Chilean Energy Ministry (based on the Long-Range Energy Alternatives Planning System (LEAP)) by incorporating the share of different technologies into the CGE model, set at the same for each year [17]. This takes advantage of the strengths of both models, yet also compensating for the disadvantages of each. Gómez et al constructed an energy matrix from a system dynamics approach to focus on long-term energy policies [45]. From a less model based approach, Ana Pueyo looked at technology transfer and enabling frameworks for low-carbon technology transfer, defining technological inputs, technological transfer channels and technology spillover effects to attain a final, direct objective to the technology transfer process using ten case studies in Chile [46].
Löffler et al first created a global OSeMOSYS model for all countries up until 2050, and then included a 100% renewable target for 2050 [35,47]. However, as the model includes countries from around the world till 2050, it lacks the granularity and up to date information that is required for a Chile focused model, especially in light of the recent transformations in the transmission grid and renewable technology capacity. Moura and Howells created a model which included more information and depth for Chile in their South American SAMBA model, but took a Brazilian perspective in
9 the paper using 2014 data which would thus not capture the current situation for Chile given the developments of 2019 [20].
Therefore, as described above there is a gap in the literature. There are no energy planning models for Chile which provide analysis on investment costs, and the emissions implications of such investments. This thesis will contribute to the
literature by providing an up to date scenario analysis of the future of Chile’s power system infrastructure, focusing on the investment costs and GHG emissions
reductions that may be achieved. The thesis will use OSeMOSYS as a modelling tool, providing a power infrastructure model for the medium term (2019-2040) focusing on Chile.
10
2 State of Affairs in Chile
C ountry C ontext
2.1.1 History
Chile is a was one of Latin America’s fastest growing economies over the past decade, and has reduced the population living under the poverty line from 30% in 200 to just 6,4% in 2017. Much of this growth could be attributed to the performance of copper mining in the country, with 32.8% of the GDP originating in the industrial sector [48]. However, after growing by 4% in 2018, GDP growth fell to 1.8% in H1 2019 due to difficult external circumstances, poor climatic conditions and a delay in some Government reforms – this was exacerbated by the 2019 cost of living protests and subsequent cancellation of COP25 [49,50].
The twelve-month rolling central government deficit remained at just 1.7% of GDP in the first half of 2019, yet despite the GDP growth slowdown, electricity demand is expected to continue to grow as the population is more wealthy [51]. Although Chile is still recovering from the effects of copper prices bottoming out, greening the electricity sector is strong opportunity for the Chilean economy [52].
In 2018, Chile’s energy production was 13 Mtoe, whereas the total primary energy supply was 39 Mtoe, covering a final consumption of 76.99 TWh [53]. To cover
demand, Chile is currently reliant on commodity imports, importing 45,875,000 TJ of natural gas and 825,000 Mtoe of coal in 2017 [53]. Despite some low-grade coal
deposits in the country, extraction costs are too high and Chile imports up to 85% of the coal it uses [54]. Chile also imports all the natural gas it uses, and the diplomatic crisis of the mid 2000s between Argentina and Chile severely curtailed electricity production from natural gas in Chile [55]. When trade restarted in 2018, it was seen as lifeline for Chile to wean itself off coal as renewable energy was installed in the following decade [56].
As the electricity sector is privately owned, investment must come from private sources. The introduction of the renewable energy law (Law 20.257) saw an increase in investment with a spike of USD$2 billion in 2012 to meet the requirements of the Law. However, given the considerable potential of NCRE in Chile, convincing financial institutions to provide loans for the high initial cost projects was difficult, despite the significant positive and negative impacts on economic output and CO2 emissions respectively [57]. Insufficient financing schemes and system integration barriers were again identified as a key barrier to implementation of the approved
11 projects, as well as volatile energy prices, insufficient local products, and regulatory barriers [58]. However, by the end of the decade, $14.8B had been invested in renewable energy, with the majority of that after 2014 [59]. Although much of the country is state owned land, the Ministry of State Assets is actively looking to hand out concessions for renewable energy projects to facilitate NCRE deployment [60].
2.1.2 Electricity Sector Profile
The electrical system is privately owned. Before 2017, the grid was split into 4
regions, with the SIC and SING grids accounting for the vast majority of demand. In 2017 Chile connected the SING and SIC grids to form Sistema Electricidad Nacional (SEN). The main transmission grid operator is Transelect, whilst the main
distributors are ENEL Distribución, Companía general de Electricidad Distribution, Sociedad Austral de Electricidad, and Chilquinta Energy [61]. A more complete list of the main operators can be found below in Table 1. The electricity market is divided in three: regulated customers (clientes regulados), unregulated customers (free customers), and the spot market [62]. As such, the investment is, in the end, fronted by the private sector, who bid at auctions for contracts (see below Figure 1).
K ey com panies Generation Enel Generación (6531 MW) AES Gener (4148 MW) Colbún (3884 MW) Engie (1971 MW) Transmission Transelec (9648 KM | 16321 MVA)
Compañía General de Electricidad (3670 KM | 8661 MVA) SAESA (1602 KM | 2379 MVA)
Enel Distribución (361 KM | 8386 MVA) Celeoredes (710 KM | 5164 MVA) Chilquinta (849 KM | 1764 MVA) Distribution
Compañía General de Electricidad (70294 KM | 8090 MVA) Enel Distribución (16507 KM | 4660 MVA)
Chilquinta (16459 KM | 1890 MVA) SAESA (59559 KM | 987 MVA)
Table 1 Key companies involved in the generation, transmission and distribution of electricity in Chile [63].
In 2018, installed capacity was 23.315 GW, and end demand was 69.323 GWh, made up 49% of regulated customers and 51% free customers.
12 Compared to just 5% a few years ago, NCRE (excluding large hydropower) now accounts for 20.8% of the country’s energy supply [64]. This success was in part due to the energy auction system in Chile. The full generation mix is seen in Figure 2 [65]. Before 2005, prices were regulated by the CNE. In 2005, an auction system was created in which potential suppliers would bid to supply energy at a certain price, and the technology for the supply would not be revealed in the bid; most recently, the 2019 auction saw bids for supplying up to 5.6 TWh for the years 2026-2040 [66]. If energy auctions do not meet renewable targets, separate renewable auctions may be held, although in the last 4 years renewable energy has dominated auctions [62]. Compared to other South American countries, Chile has a few unique features. In Brazil, energy auctions are, for example, A-3 or A-5 as they must begin operation within 3 or 5 years [67], and from these PPA are determined and signed by the
Figure 1 Breakdown of the old electrical system in Chile. SIC and SING have since been connected to form the SEN. Map icon retrieved from [136]
SING
SIC
AYSÉN
13 respective parties, normally for 20 years for wind and solar and 30 years for
hydropower. Peru has technology-specific pay-as-bid sealed-bid auctions, so renewables have their own auctions [67].
Chile has similar auctions, yet the main differences are that Chile has no start date deadline, and Chile has time block based auctions as well to allow NCRE to be more competitive, allowing, say, solar to provide power just in the daytime [66]. This was revolutionary in the rise of NCRE in Chile, and was instituted in 2014. The situation in Argentina is different. Auctions are held specifically for renewable energy in the RenovAr energy auction, where up to 400 MW of capacity is auctioned at a time in Mini-rounds and more in larger rounds (although for 400 MW opened up in 2018, 269 MW was won) [68,69]. Three rounds have been completed, and the fourth is due to come live soon.
Due to geographical limitations imposed by the Andes mountain range, Chile has limited power connections with other countries in the region. Currently there is a 700 MW interconnection with Argentina, and a planned 300 MW interconnection with Peru from 2021/22. However, in December 2011 Argentina revoked the electricity export license for Salta (the border town) so there is currently no trade [63]. The cost of production for electricity in Chile is higher than in Peru, so it is likely that in the near term Chile would be a net importer of electricity from Peru [70].
2.1.3 Potential
Chile has excellent solar resources, especially in the Atacama desert which receives unusually high levels of solar irradiation equivalent to 2400 kWh/kWp per year [71]. Although PV technology will likely continue dominating investments in the region in
Figure 2 Authors own graphic of the generation mix in Chile in 2018 presented in the Anuario Estadístico [65].
14 the coming years, and makes up roughly 1/7 of all projects in the global project pipeline, Chile has the highest number of CSP projects in the project pipeline in the world, with an estimated 5500 MW in the pipeline [72]. The most notable current examples are the SolarReserve Tamarugal Solar Plant, a 450 MW project approved and to be operated by USA company SolarReserve, and Cerro Dominador at 110 MW. Chile also has a considerable project pipeline for wind energy, ranking 4th globally for wind capacity under development at approximately 8.4 GW of on-shore capacity [73].
Chile’s raw potential to electricity from renewable energy sources (rather than NCRE) stands at 12 GW for hydroelectric, 1 TW for solar, 40 GW for wind and 16 GW for geothermal [74].
Overall then, Chile has favourable geographic conditions for renewable energy, political conviction backing industry and an attractive regulatory environment, with just a few barriers impeding the deployment.
Institutional Environm ent
Table 2 below provides a summary of the institutional environment in Chile with key institutions, plans & strategies, pledges and targets, laws and regulations. Below Table 2 is a deeper dive into how the institutions are relevant for the research topics of this paper, as well as supporting evidence for the analysis that has been conducted on the institutional environment. It is important to evaluate the institutional
environment for two reasons. First, renewable energy introduction in Chile was
heavily influenced by legislation, and this trend looks to continue. Second, the results of the thesis are compared to the NDC for Chile, a policy document which is a result of the collaboration of all aspects of Chilean society.
National level
National Climate Change Cabinet (GNCC) [Gabinete Nacional de Cambio Climático] The National Climate Change Cabinet brings together national public bodies involved in climate policies, under the orbit of the Cabinet of Ministers. It seeks to reorient public policies, ensure coordinated responses and generate mitigation and adaptation actions.
15
K ey Institutions
Electricity sector level
Ministry of Energy (MdE) [Ministerio de Energía]
Hosts the Division of Environment and Climate Change [División Ambiental and Cambio Climático], the Division of Energy Markets [División de Mercados Energéticos] and the Division of Sustainable Enrergy [División de Energías Sostenibles]. As of 2nd August 2019, the Ministry was led by Juan Carlos Jobet [75].
National Energy Commission (CNE) [Comisión Nacional de Energía]
The Commission id a public and decentralised entity, with its own authority and capacity to acquire and exercise rights and obligations for the President of the republic as an intermediary for the Ministry of Energy. As a technical organisation, the Commission analyses prices, tariffs and technical laws related to companies related to the production, generation, transport and distribution of energy [76].
Superintendence of Electricity and Combustibles (SEC) [Superintendcia de Electricidad y Combustibles]
In charge of safety and quality of the operation of the electricity, gas and fuel services in Chile [77].
K ey Plans & Strategies
National level
National Climate Change Action Plan 2017-2022 [Plan de Acción de Cambio Climático 2017-2022]
The National Climate Change Action Plan is an economy wide action plan for climate change mititgation and adaptation, with pillars of action in the transport, electricity, agriculture and industrial sectors [78].
Electricity sectoral level
Energy 2050: Chile’s Energy Policy, 2016
A medium-long term policy planning document outlining strategic and technological aspects that will define the energy matrix in Chile to 2050. The document is sustained by four pillars: Quality and Security of Supply; Energy as a Driver of Energy; Environmentally-friendly energy; and Energy Efficiency and Energy Education [42].
Mitigation Plan for GHG for the Energy Sector [Plan de mitigación de gases de efecto invernadero para el sector energía], 2017
The plan, produced by the Ministry of Energy, is a public policy instrument, examining mitigation policy on various axes including cost-efficiency, equality, flexibility and the contribution to emissions reduction [79].
Energy Route 2018-2022 [Ruta Energética 2018-2022], 2018
A seven-step plan to a modern, low emission system energy system for Chile. The short term plan to complement Energy 2050 [80].
Pledges & Targets
National level
Draft Second Nationally Determined Contribution (NDC)
Unconditional: Economy-wide emissions capped at 1110-1175 MtCO2e incl. LULUCF between 2020 & 2030, and 97 MtCO2e in 2030.
Conditional: Not supplied in the draft Electricity sectoral level
Energy 2050: Chile’s Energy Policy, Ministry of Energy Statement The government plans for 70-100% NCRE by 2050 [42,81].
16
K ey Laws & R egulation
s
Draft Climate Change Law, 2019
The draft law would introduce sweeping measures and enshrine NDC targets in law, strengthening the ability of the government to ensure climate targets are met [82]
Law 20.571 on environmental taxation, 2014
Implementation of an annual tax on emissions from fixed sources of thermal power great than or equal to 50 MW [83].
Law 27.780 tax reform implementing a green tax, 2014
Implantation of a green tax on fixed sources of pollutants, including CO2, starting in 2017 [84]. Law 19.657 on Geothermal Energy and its Regulation by Decree 114, 2010
Establishment of a special system for granting concessions for the exploration and development of geothermal energy [85]
Law 20.571 regulating the payment of electricity tariffs of residential generators, 2012 Allows final users to inject electricity from renewable installations up to 100kW into the distribution grid [83].
Law 20.365 on tax exemption for solar thermal systems, 2010 & Law 20.897 amending Law on tax exemption for solar thermal systems
Grants tax deductions equivalent to the cost of the installation of new solar thermal systems. Later amended [86].
Law 20.257 on Non-Conventional Renewable Energy, 2008 & Law 20.698 on the Modification of Electrical services, 2014
Mandates that a certain percentage of power solar by electricity companies, operating at more than 200 MW, must be produced from NCRE. The perctage was later raised, and now amounts to 20% by 2025 [27]
Law 19.940 modifying the general electrical services Law from 1982, 2004
Changed several aspects of the energy generation market in Chile, facilitating the rise of small power producers [87].
Law 20.936 on new power transmission systems, 2016
Establishes new power transmissions Systems and an independent coordinating body for the national power system to ensure transmission system is not a barrier to NCRE deployment [88]. Law 20.928 on equity mechanisms in electrical service rates, 2016
Amends the price mechanism, including for regulated customers by adjusting the discount on price according to the power demand [89].
Table 2 Institutional summary surrounding electricity production. Format of table developed with NewClimate Institute [90]
According to the NDC the intended emissions shall not exceed 1175 MtCO2eq cumulative between the years 2020 and 2030, and intend to reach a peak of in the year 2027 (excluding the LULUCF sector) [91]. This sets a definitive metric of comparison for the GHG emissions results of each scenario.
The Minister of Energy, Juan Carlos Jobet, is the head of the main policy decision maker in the company, and is committed to sectoral mitigation with his steadfast backing of Energía Zero Carbon, Chile’s plan to be carbon neutral by 2050, stating “the main mandate is to facilitate the development of clean generation capacity and a balanced matrix that serves the people” [92]. The focal point for the Ministry of Energy for climate change and renewable energy is the head of the Sustainable Development and Climate Change Division, at a mid-seniority level [42,93].
17 Recently, the sector has given priority to climate mitigation and renewable energy installation through various plans and measures: the Council for Minister for Sustainability adopted the “Mitigation Plan for the Energy Sector” to align sector plans with the NDC, whilst on June 05th the Ministry announced a radical
decarbonisation plan that would see coal completely removed from the matrix by 2040. This accompanied the rapid uptake of renewable energy by electricity providers after the introduction of the Energy Agenda 2050 and the Chilean auction structure [94]. Priority was also given to climate mitigation in Energía 2050, Ruta Energética, Estrategía Nacional de Electromobilidad, and Guía Chile Energía.
Ministry of Energy uses the 2050 carbon neutral long-term target and feeds this into short-term policy implementation. The 2018-2022 Energy Pathway is structured into 7 axes, the fourth of which details low-emission energy, and uses this policy
document to realise the (at the time) target of 70% renewables by 2050. Distinct short-term planning based on long-term targets are seen elsewhere in policy too, such as in the National Energy Policy which is split into three time frames: short-term (to 2022), medium term (to 2035) and long-term (to 2050) [80,95].
The Chilean electricity and heating sector’s GHG emissions are covered in the national inventory, and other transparency framework measures are reviewed on an individual basis and presented in the BUR, major policy documents such as the National Energy Policy, and on individual websites. The most prominent of review mechanisms seems to be “MRV de politicas y acciones de mitigación del sector energía” [MRV of mitigation policies and actions in the energy sector] [96].
Overall, the institutional environment shows strong support to the deployment of non-conventional renewable energy (solar, wind, small hydro, biomass), and there are both regulatory organisation ensuring targets are met, and laws to guarantee that Chile’s energy mix moves to a great NCRE share [27,75,76,82,85].
18
3 Methodology
The purpose of modelling energy systems is typically to gain insight into future performance of the system based on historical data to aid decision making [97]. This is not just for accounting though; it also aids in the optimisation of energy resources, and can also be conducted with limited historical data if sound scientific assumptions are made. This thesis uses OSeMOSYS to model the system.
Scenario and M odelling A pproach: O pen Source Energy
M odelling System (OSeM OSYS)
3.1.1 Origins of the OSeMOSYS model
OSeMOSYS is of the family of bottom-up, or techno-economic, models designed for long-term energy planning. Unlike other models, such as MARKAL/TIMES,
OSeMOSYS is completely free to use as the code is written in GNU MathProg or Python (both open source), and uses the free solver GLPK to calculate results, whilst MoManI (Model Management Infrastructure) is used as an interface [11].
Furthermore, the model allows the user to include the existing capital stock and its remaining lifespan. However, the model faces several weaknesses including
operational requirements, governmental regulations/institutional conditions and socioeconomic situations, broader economic context and external shocks (such as the 2008 financial crisis).
In order to define the optimal pathways, the model uses the given technologies for production and necessary associated fuels to match the demand given to the model over the relevant time period, all of which is given as an input. The model allows for users to add constraints to the system, and with these three-broad categories of inputs, creates and solves a system of linear equations. The original design of the system was in “blocks” of functionality to allow for users to update and modify the system easily to their own requirements. The seven original blocks were: objective (function); costs; storage; capacity adequacy; energy balance; constraints; and emissions [98]. The overall structure can be seen in Figure 3, whilst a detailed description can be found in the Annex for how the blocks interlink to minimise the objective function.
19
Figure 3 Visual depiction of functionality block structure [98]
3.1.2 Techno-economic parameters used in the model
There are two distinct sets of data in the model: time dependent, and time independent.
Time independent
is the data which is constant across the modelling period, but may vary for each technology. Table 3 below describes the time independent parameters, as well as their units [99].
Year Split Duration of a modelled time slice expressed as a fraction of the
year. The sum of all entries equals 1.
Discount Rate Region specific value for the discount rate used across all
technologies, expressed as decimal (not a percentage). Percentage
Depreciation method Binary parameter defining the type of depreciation: 1 for sinking
fund, 2 for straight-line depreciation. 0 or 1
Capacity to Activity Unit Conversion factor relating the energy that would be produced
when one unit of capacity is fully used in one year (GW -> PJ). Unitless
Operational Life Useful lifetime of the technology in years. Years
Input Activity Ratio Rate of commodity use by a technology, as a ration of the rate of
activity. Unitless
Output Activity Ratio Rate of output of a commodity from a technology, as a ratio of
the rate of activity. Unitless
20
Time dependent data
This data may vary for both technology, year and time period. Table 4 below describes the time dependent parameters, as well as their units [99].
Specified Annual Demand Total demand for the year, linked to a time of use during the year PJ
Specified Demand Profile Annual fraction of energy service or commodity demand by time slice.
Sum of all time slices equals 1. 0 oto 1
Capacity Factor Capacity available in each time slice expressed as a fraction of the
total installed capacity, from 0 to 1. Allows for forced outages. 0 to 1
Availability Factor Maximum time a technology can run in the whole year, as a fraction
of the year from 0 to 1. Allows for planned outages. 0 to 1
Residual Capacity Remaining capacity available from before the modelling period. Must
be manually phased out at end of lifetime. GW
Capital Cost Capital investment cost of a technology, per unit of capacity. M$/GW
Variable Cost Cost of a technology per given mode of operation (variable O&M),
per unit of activity. M$/PJ
Fixed Cost Fixed O&M of a technology per unit of capacity. M$/GW
Total Annual Max Capacity
Total maximum existing (residual plus cumulatively installed)
capacity allowed for a technology in a specified year. GW
Total Annual Min Capacity Total minimum existing (residual plus cumulatively installed)
capacity allowed for a technology in a specified year. GW
Total Annual Max Capacity Investment
Maximum capacity of a technology expressed in power units.
GW
Total Technology Annual Activity Upper Limit
Total maximum level of activity allowed for a technology in one year. PJ
Total Technology Annual Activity Lower Limit
Total minimum level of activity allowed for a technology in one year. PJ
Reserve Margin Minimum level of reserve margin required that the tagged
technologies must provide for the tagged commodities. PJ
Reserve Margin Tag Fuel Binary parameter. Tags the fuels to which the reserve margin applies. 0 or 1
Reserve Margin Technology Binary Parameter. Tags the technologies which may contribute to the
reserve margin. 0 or 1
RE Tag Technology Binary parameter. Tags the renewable technologies that may
contribute to the RE minimum production target. 0 or 1
RE Min Production Target Minimum production target for the tagged technologies. Fraction
from 0 to 1. 0 to 1
Emissions Activity Ratio Emissions factor of a technology per unit of activity, per mode of
operation.
Mton/P J
Emissions Penalty Monetary penalty per unit of emission. M$/Mto
n
Annual Emissions Limit Emissions limit for the given year. Mton
Model Period Emission Limit
Emissions limit for the modelling period.
Mton
21
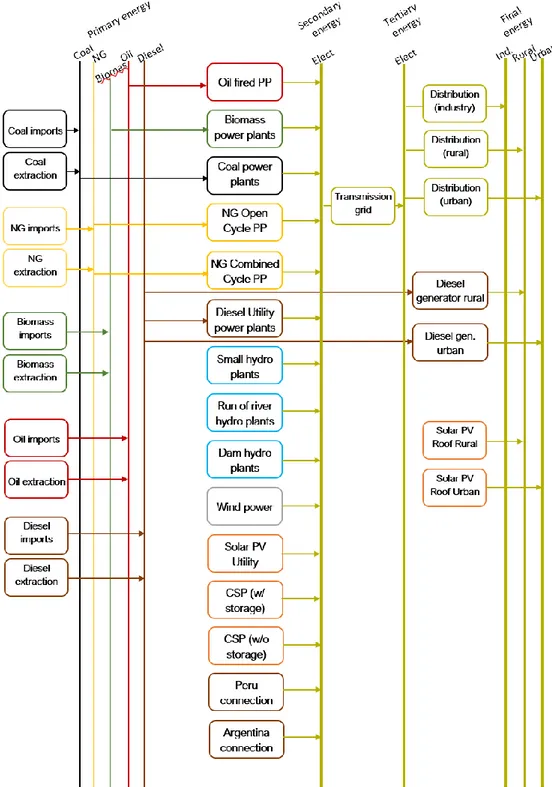
3.1.3 Designing a Reference Energy System for Chile
A Reference Energy System (RES) is a graphic of the particular energy system to be modelled. As standard, technologies are depicted as blocks whilst services (such as fuels) are depicted as lines [98]. This allows the designer to have a clear visual
representation with which to model their system, and also allows those analysing the results to see the model set up without having to go into the code or interface itself.
22
3.1.4 Scenarios
Chile has committed to removing coal from the energy matrix by 2040, and to be carbon neutral by 2050 [81]. In order to answer the research question, “What will be
the GHG emissions and investment costs if Chile achieves its goal to be coal free by 2040?”, this thesis used three scenarios. First was a (1) Business as U sual
scenario, including just the 2040 coal plant decommissions. This scenario includes power purchase agreements (PPAs) up to 2026 which includes coal and natural gas production. The volume of the production from coal and natural gas was taken from historical production, as seen in the Anuario Estadistica [65].
Second, a (2) null PPA scenario modelled the case where current PPAs are bought out, and instead open market conditions are allowed to play out.
It is possible that, despite PPAs, Chile may switch these contracts to renewable energy. There is precedent for this already in Chile, as the mining company BHP announced that it would be switching to renewable energy supply and had set aside US$780M to cover the costs of buying out PPAs for coal [100]. This is after Miner Anglo American made the same renewable energy pledge [101]. Thus a scenario to model the least net present cost pathway in such a scenario was needed.
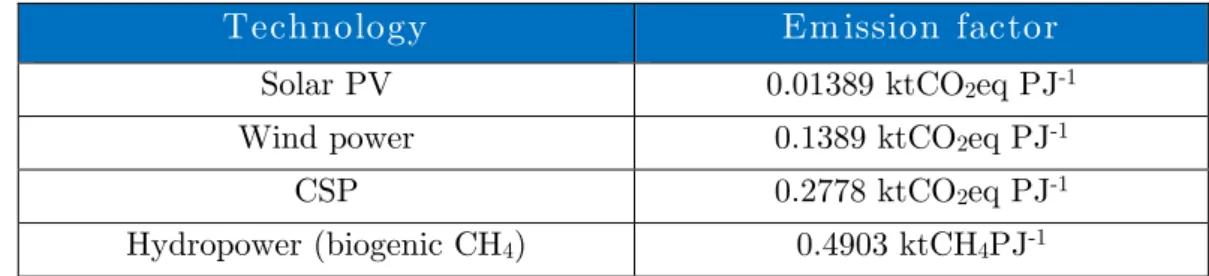
Then, a (3) non-conventional renewable energy (N CR E) was created. Chile has set a 2050 carbon neutrality target. As described earlier, the generation of electricity is both the primary cause of climate change and the primary means of mitigation [4]. As such, if Chile is to reach its neutrality goal by 2050, the electricity sector will have to reach net zero emissions by 2050 at the latest. Chile defines non-conventional renewable energy as solar, wind, biomass, ocean, and hydraulic (less than 20 MW) power.
Therefore, the N CR E used a 100% NCRE penetration ratio for 2050 to simulate Chile meeting the carbon neutrality target, which corresponds to a 2040 target of 68%.
Definition: PPA
A Power Purchase Agreement (PPA) is a long-term electricity supply agreement between two parties, usually between a power producer and a customer. The PPA
defines the conditions of the agreement, such as the amount of electricity to be supplied, negotiated prices, accounting, and penalties for non-compliance. Since it is a bilateral agreement, a PPA can take many forms and is usually tailored to the specific application. In
this thesis, a PPA refers to both corporate deals and the government auction agreements for
23
A ssum ptions and data sources
Instead, data was collected from various government documents and academic
journals. For some variables, standard numbers were used. In the OseMOSYS model, there are two distinct types of data: time dependent data which depends on the year, and time independent data which is fixed across the 22 years for which the model runs.
3.2.1 Global assumptions
Base year
The analysis throughout the paper focuses on generation and demand with a baseline year of 2018 (the latest year for which complete statistical information on electricity generation and demand was available at the time of writing).
Mode of operation
Modes of operation allow the model to simulate different outputs; for example, a combined heat and power plant would have two modes of operation, one for power and one for heat. In this model CHP plays a minor role in production, and when forcing fossil fuel-based energy production within Annual Activity Lower Limit, coal and natural gas produced in mode 2, which does not correlate to anything for coal. As such, the model was simplified to use one mode.
Discount rate
The discount rate of 8.16% was calculated using NERA Consulting’s reference to the Department for Energy and Climate Change (DECC) Hurdle Rates. Each
technology has an individual hurdle rate, so a weighted average was calculated based on the installed capacity in the country [102].
Table 5 Individual technology discount rates from 2013 DECC figures, as reported in 2015 NERA paper [102]
Solar 5.3% Biomass CHP 13.6% Wind 7.1% Hydropower 5.8% Geothermal 22.0% CCGT 7.5% OCGT 7.5% Nuclear 9.5%
Coal (carbon capture storage) 13.5%
24
Monetary Unit
The monetary unit for the model was set to the US$ with a base year of 2018.
Modelling Period
Following typical medium-term plans, this model runs from 2019-2040, with 2018 used as a base year (as this was the latest data from most sources).
Year Split
Each year is split into two primary seasons (summer/winter), and each day is split into two time periods (day/night). This is an aggregation of demand and supply data: capacity factors were found for day and night for most technologies at a high aggregation level, whilst the demand profile was given for an example day, and for each month [103]. The sunset/sun rise time was taken to be the delimiter for day and night, and from this the capacity factor, specified annual demand and other hour dependent data were calculated for summer/winter day/night. Without additional data for local breakdowns, further time splits would have yielded false positive accuracy for the model: for just one example, the capacity factor of hydropower cannot be assigned for multiple months, and is instead better presented as the included SD/SN/WD/WN.
Electricity generation technologies
Electricity generation technologies were mostly taken from the “Cost of generation” report by the CNE [104]. From this, CSP was split into two, with thermal salt storage and without. In addition to this, rooftop solar was added to the model, with and without storage, to provide the model the option of installing rooftop solar panels for residential demand. Thus the electricity generation technologies are: biomass CHP, coal power, diesel (utility), diesel generator (industry), diesel generator (urban), diesel generator (rural), trade links (Argentina, Peru), small hydropower, dam hydropower, run of the river hydropower, oil fired gas turbines, natural gas (open/single cycle), natural gas (combined cycle), CSP (with storage), CSP (without storage), solar PV (utility), rooftop solar PV (with/without storage & rural/urban), wind power. Chile has no nuclear generation capacity and does not plan on utilising nuclear. In addition, the commodity/fuel technologies are: biomass import/extraction, coal import/extraction, natural gas import/extraction, oil
25
3.2.2 Specific data sources and assumptions
Capital cost, fixed cost, variable cost
The majority of cost figures were sourced from “Informe de Costos de Tecnologías de Generación”, released by Comisión Nacional de Energía in 2019. This provided
information on the current capital costs, fixed costs and non-fuel related variable costs for each technology [104].
Technology
R eference
investm ent cost (U S$/kW ) Fixed costs (% of investm ent) N on-fuel variable costs (U S$/M W h) Thermal carbon 3000 1%-2% 2
Thermal natural gas (open
cycle) 800 1%-2% 3.5
Thermal natural gas (combined
cycle) 1048 1% 3.5
Thermal diesel (dual gas
turbine + motor generator) 687 1%-2% 3.5-10
Wind 1361 3%-4% -
Solar PV 970 1%-2% -
Solar thermal (CSP) 6055 1%-2% -
Hydropower (dam) 2180 1% 1.3
Run of river hydro (>20MW) 4050 1% 1.3
Small hydro 3565 1% 1.3
Thermal biomass 3100 3%-4% 9.3
Geothermal 5870 4%-5% -
Table 6 Reference investment (capital, fixed costs and non-fuel variable costs as laid out by the Comisón Nacional de Energía (CNE) using 2018 values [104].. Some figures are provided in the government report as a range. This thesis uses the middle value of the range.
However, rooftop solar was not covered by the Anuario Estadistico or the CNE Cost Report, and was instead garnered from a CEPAL report on the economics of rooftop solar in Chile which is endorsed by the Comisión Económica para América Latina y el Caribe (CEPAL), which gave an estimate of $2260/kW [105].
However, several technologies are still in the early stages of commercial viability, such as solar PV, CSP, geothermal and to some extent wind power. For these technologies, the learning curve was plotted in excel using data from IRENA and IEA. A power trendline was added to graph and then the equation for this displayed on the graph. This equation was then used to calculate the future costs of these nascent technologies, with the starting point for the series taken as the first
26 commercially viable power plant in the world. As such, solar is predicted to reach a lower final capital cost than wind, for example, as it is a newer technology and thus has some way to fall down the learning curve still. This corresponds with various literature predictions. Fossil fuel technologies (including natural gas) are assumed to be mature enough to have a stable capital cost, as is hydropower. Furthermore, due to the elongated nature of the geography, the country spans a great length from South to North, and as such covers many different biomes. Climate change and varying water levels are not taken into account in the model, as seasonal rain
patterns in the north of Chile vary to those in the south. As such, availability factors are assumed to be constant throughout the year, and capacity factors are presumed to not change between night/day. The trend for biomass capital costs was plotted from IRENA’s renewable energy power generation costs, which showed that prices had slightly decreased in the last 10 years [106].
Fuel costs
Fuel costs (the other component of variable costs) were calculated using a combined method. First, the World Bank Pink sheets market outlook from April 2019 provide an outlook until 2030 of major commodity prices such as coal, natural gas and oil [107].
Com m odity U nity 2016 2017 2018 Forecasts
2019 2020 2021 2022 2025 2030
Coal, Aus $/mt 66.1 88.5 107.0 94.0 90.0 86.4 83.0 73.5 60.0 Crude oil, avg $/bbl 42.8 52.8 68.3 65.0 65.5 66.0 66.0 67.5 70.0 Natural Gas, Euro $/mmbtu 4.6 5.7 7.7 6.0 6.0 6.1 6.2 6.5 7.0 Natural Gas, U.S. $/mmbtu 2.5 3.0 3.2 2.8 2.9 3.0 3.1 3.4 4.0 Natural Gas, Japan $/mmbtu 7.4 8.6 10.7 7.4 7.5 7.6 7.7 8.0 8.5 Table 7 Global values for the commodity price forecasts from the World Bank Pinksheets, compared with the World Outlook
2017 [107]. These values are then converted to Chile using a conversion factor based on the 2019 values.
Then these world values were converted to Chile specific prices by looking at the current prices of commodities in the country in the Anuario Estadistico de Energía and applying this ratio through all years [65]. For example, in 2018 coal was
$130.50/mt compared to $107.00 in the World Bank figures. This factor was then applied throughout the modelling period. Finally, the trend for 2018-2030 was extrapolated to 2040.
27 The Cost Report provides a specific consumption in MMBtu/GWh, with which the cost per MMBtu is converted to $/PJ, specific to technology and market conditions Chile.
Technology Specific consum ption U nit
Thermal carbon 0.385 (ton/MWh)
Thermal natural gas (open cycle) 9.000 (MMBtu/MWh) Thermal natural gas (combined
cycle) 6.500 (MMBtu/MWh)
Thermal diesel (dual gas turbine
– utility) 0.250 (m3/MWh)
Thermal diesel (motor
generators) 0.270 (m
3/MWh)
Table 8 Specific consumption of fossil fuel technologies in Chile, as an average [104].
Finding an accurate base cost for wood chips & pellets which feed biomass power plants was more difficult. A 2013 analysis for Danish prices of $1.5M/PJ was used with the assumption that, because the technology is more mature in Denmark, the prices in 2013 would be more similar to that of todays [108]. Furthermore, IEA projections show that biomass prices are likely to remain largely the same lest a food crisis hit.
Residual Capacity
R esidual capacity and planned builds which had already been funded were also taken from the Anuario Estadistisco [65]. Residual capacity is in the report as single numbers for each technology, but in order to put the planned capacity in for each year, the planned constructions were put into Excel with the project name, the capacity and the year of project completion. This was then filtered into year by year, technology by technology tables of installed capacity to be fed into the main
database sheet which was directly transferred to Momani.
Furthermore, whilst OSeMOSYS has a built-in function, plant lifetime, to decommission capacity beyond its technical lifetime, this does not apply to the residual capacity in the model. As a consequence, existing residual capacity is reduced by 2% a year (assuming a 50-year average lifetime for the current technologies of dam hydro, natural gas, diesel, and run of the river hydro). This
![Table 1 Key companies involved in the generation, transmission and distribution of electricity in Chile [63]](https://thumb-eu.123doks.com/thumbv2/5dokorg/4254811.93974/21.892.103.793.582.1042/table-companies-involved-generation-transmission-distribution-electricity-chile.webp)
![Figure 2 Authors own graphic of the generation mix in Chile in 2018 presented in the Anuario Estadístico [65].](https://thumb-eu.123doks.com/thumbv2/5dokorg/4254811.93974/23.892.255.615.100.406/figure-authors-graphic-generation-chile-presented-anuario-estadístico.webp)
![Table 3 Time independent parameters used in the model [99]](https://thumb-eu.123doks.com/thumbv2/5dokorg/4254811.93974/29.892.104.861.700.1013/table-time-independent-parameters-used-model.webp)
![Table 5 Individual technology discount rates from 2013 DECC figures, as reported in 2015 NERA paper [102]](https://thumb-eu.123doks.com/thumbv2/5dokorg/4254811.93974/33.892.176.709.845.1141/table-individual-technology-discount-rates-decc-figures-reported.webp)
![Table 6 Reference investment (capital, fixed costs and non-fuel variable costs as laid out by the Comisón Nacional de Energía (CNE) using 2018 values [104].](https://thumb-eu.123doks.com/thumbv2/5dokorg/4254811.93974/35.892.105.855.295.780/table-reference-investment-capital-variable-comisón-nacional-energía.webp)
![Table 8 Specific consumption of fossil fuel technologies in Chile, as an average [104]](https://thumb-eu.123doks.com/thumbv2/5dokorg/4254811.93974/37.892.114.832.246.486/table-specific-consumption-fossil-fuel-technologies-chile-average.webp)
![Figure 5 The demand, in PJ, as modelled and predicted by the CNE in Chile [127].](https://thumb-eu.123doks.com/thumbv2/5dokorg/4254811.93974/42.892.97.826.494.824/figure-demand-pj-modelled-predicted-cne-chile.webp)
![Figure 6 The annual, demand per capita, in GJ. (source: Author’s estimation from CNE demand projections and World Bank population projections [125,135,138]](https://thumb-eu.123doks.com/thumbv2/5dokorg/4254811.93974/43.892.75.825.756.1099/figure-annual-source-author-estimation-projections-population-projections.webp)
