DISSERTATION
AIR QUALITY IMPLICATIONS FROM OXIDATION OF ANTHROPOGENIC AND BIOGENIC PRECURSORS IN THE TROPOSPHERE
Submitted by Michael F. Link Department of Chemistry
In partial fulfillment of the requirements For the Degree of Doctor of Philosophy
Colorado State University Fort Collins, Colorado
Fall 2019
Doctoral Committee:
Advisor: Delphine Farmer Ellen R. Fisher
James R. Neilson Shantanu H. Jathar
i
Copyright by Michael Frank Link 2019 All Rights Reserved
ii ABSTRACT
AIR QUALITY IMPLICATIONS FROM OXIDATION OF ANTHROPOGENIC AND BIOGENIC PRECURSORS IN THE TROPOSPHERE
Oxidation chemistry in the troposphere drives the formation of air pollutants, harmful to human health and the natural world. Emissions from both anthropogenic and biogenic sources control the ways in which air pollution is formed and thus understanding the chemistry of the oxidation of these emissions enhances our ability to predict how air quality evolves in the future. Experiments simulating tropospheric oxidation chemistry on anthropogenic point sources show that identifying unique chemical processes resulting in air pollution allow for a greater
specificity in how to pursue strategies for pollution mitigation policy with regional and hemispheric implications. This thesis focuses on the implementation of advancements in instrumentation and experimental techniques to understand how tropospheric oxidation of anthropogenic and biogenic precursors can produce air pollution.
First, we subject vehicle exhaust to simulated tropospheric oxidation and quantify the formation of particulate matter and a toxic gas, isocyanic acid. We estimate how important oxidation of vehicle emissions are for these atmospheric pollutants for the South Coast Air Basin of California and the Seoul Metropolitan Region. Second, we investigate the propensity for isoprene to produce formic and acetic acid in laboratory oxidation experiments. We find that isoprene is likely a major source of formic acid in biogenically-influenced environments,
however the exact mechanisms for formation remain unclear. Lastly, we use chemical ionization mass spectrometer measurements to quantify the fraction of oxidized carbon allocated to
gas-iii
phase organic acids from isoprene oxidation in laboratory experiments. Through comparison with field measurements from a forest in Alabama to a forest in Colorado we determine high levels of isoprene in Alabama are responsible for high levels of organic acids compared to Colorado. We also observe that influences of anthropogenic NOx suppress the formation of
gas-phase organic acids suggesting as NOx levels decrease throughout the US in the future organic
iv
ACKNOWLEDGEMENTS
The support of my friends and family has been critical to my success in graduate school. Thanks to the help of Mike Vannoy more than ten years ago I had the privilege of being able to participate in this educational experience. Without his intervention my life would look
dramatically different than it does today. Others along the way including Steve Shertz from NCAR, folks from NOAA, and colleagues from the CSU atmospheric science department and CU Boulder have been instrumental in helping me develop a well-rounded analytical skill set. Friends, colleagues, and mentors I had through the NSR EAPSI program in Korea had an enormous impact on how I understand myself in the world and as a scientist. The Farmer group, through the years, has been a source of inspiration and many good times were had. Last, I could not imagine an advisor more constructive to my professional development than Delphine. Working under her counsel has been a gift.
v
DEDICATION
vi
TABLE OF CONTENTS
ABSTRACT ... ii
ACKNOWLEDGEMENTS ... iii
DEDICATION ... iv
1. CHAPTER 1- TROPOSPHERIC OXIDATION AND REGULATION OF AIR QUALITY ....1
1.1 FORMATION OF AIR POLLUTANTS AND IMPLICATIONS FOR REGULATION OF AIR QUALITY ...1
1.2 UNDERSTANDING TROPOSPHERIC CHEMISTRY THROUGH FIELD AND LABORATORY STUDIES ...3
1.3 THESIS OVERVIEW ...5
REFERENCES ...7
2. CHAPTER 2- PHOTOCHEMICAL PROCESSING OF DIESEL FUEL EMISSIONS FORMS A LARGE SECONDARY SOURCE OF ISOCYANIC ACID (HNCO) ...11
2.1 INTRODUCTION ...11
2.2 MATERIALS AND METHODS ...13
2.2.1 EXPERIMENTAL SETUP ...13
2.2.2 EXHAUST EXPERIMENTS ...14
2.2.3 ACETATE CHEMICAL IONIZATION MASS SPECTROMETER (ACETATE-CIMS) OPERATION AND CALIBRATION ...15
2.2.4 CALCULATION OF FUEL BASED ENHANCED EMISSION FACTORS ...16
2.3 RESULTS AND DISCUSSION ...17
2.3.1 PRIMARY EMISSION OF HNCO ...17
2.3.2 SECONDARY SOURCE OF HNCO ...19
2.3.3 IMPLICATIONS OF DIESEL REDUCTION EMISSION TECHNOLOGY ...20 2.3.4 ATMOSPHERIC RELEVANCE...20 2.4 CONCLUSIONS...23 2.5 CHAPTER 2 FIGURES ...24 2.6 CHAPTER 2 TABLES ...26 REFERENCES ...28
3. CHAPTER 3- ELEVATED PRODUCTION OF NH4NO3 FROM THE PHOTOCHEMICAL PROCESSING OF VEHICLE EXHAUST: IMPLICATIONS FOR AIR QUALITY IN THE SEOUL METROPOLITAN REGION ...33
3.1 INTRODUCTION ...33
3.2 MATERIALS AND METHODS ...36
3.2.1 VEHICLE EXHAUST SAMPLING ...36
3.2.2 EMISSIONS MEASUREMENT INFORMATION ...37
3.2.3 FLOW REACTOR OPERATION ...37
3.2.4 HIGH RESOLUTION TIME-OF-FLIGHT AEROSOL MASS SPECTROMETER (HR-AMS) ...38
vii
3.3 RESULTS AND DISCUSSION ...40
3.3.1 TRACE GAS AND INORGANIC PARTICLE DATA ...40
3.3.2 VEHICLE FUEL TYPES AND IMPLICATIONS FOR AIR QUALITY ...42
3.4 CHAPTER 3 FIGURES ...46
3.5 CHAPTER 3 TABLE ...50
REFERENCES ...51
4. CHAPTER 4- LABORATORY STUDIES OF ISOPRENE OXIDATION CANNOT EXPLAIN AMBIENT OBSERVATIONS OF FORMIC AND ACETIC ACID ...57
4.1 INTRODUCTION ...57
4.2 EXPERIMENTAL METHODS...59
4.2.1 GAS-PHASE OXIDATION EXPERIMENTS ...59
4.2.2 INSTRUMENTATION ...60
4.2.3 CHAMBER BACKGROUND SUBTRATION OF ORGANIC ACIDS ...60
4.3 ORGANIC ACID YIELDS FROM CHAMBER EXPERIMENTS ...62
4.3.1 ORGANIC ACID YIELDS AND EFFECTS OF EXPERIMENTAL CONDITIONS ON PRODUCTION...62
4.3.1.1 OH OXIDATION ...62
4.3.1.1.1 “SLOW” OH OXIDATION ...64
4.3.1.2 O3 OXIDATION ...66
4.3.1.3 NO3 OXIDATION ...68
4.3.1.4 OXIDATION THROUGH PHOTOLYSIS ...68
4.3.1.5 INFLUENCE OF SEED AEROSOL ...70
4.3.2 INVESTIGATING MISSING SOURCES OF ORGANIC ACID PRODUCTION ...71
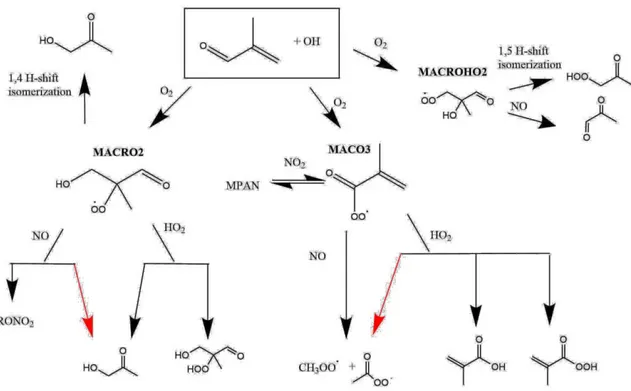
4.3.2.1 MACR + OH ...73
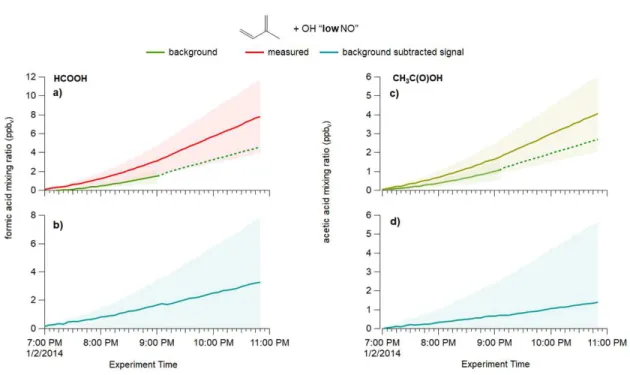
4.3.2.1.1 MACR + OH “LOW NO” ...74
4.3.2.1.2 MACR + OH “HIGH NO” ...74
4.3.2.2 IEPOX + OH “MODERATE NO” ...75
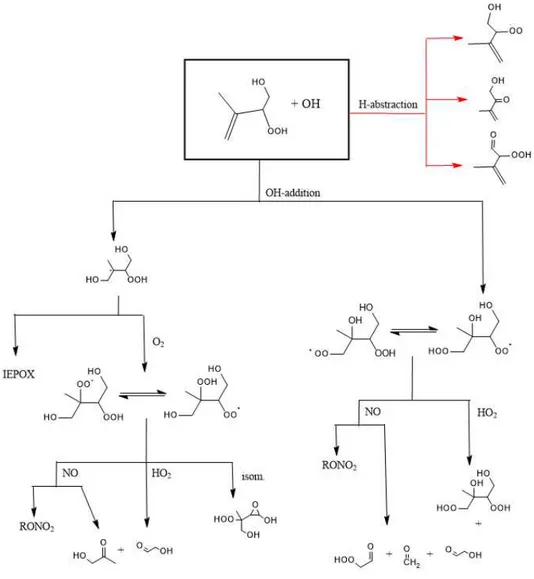
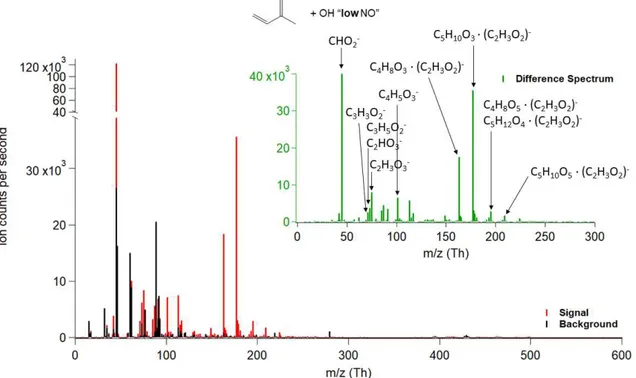
4.3.2.3 ISOPOOH + OH “LOW NO” ...76
4.3.2.4 ISOPRENE + OH ...78
4.3.2.4.1 ISOPRENE + OH “LOW NO” ...78
4.3.2.4.2 ISOPOOH + OH “HIGH NO” ...80
4.3.2.5 EFFECTS OF INCLUDING FORMIC ACID SOURCE FROM HYDROXYACETONE AND GLYCOLALDEHYDE ...82
4.4 MODELING CHEMICAL SOURCE OF FORMIC AND ACETIC ACID MEASURED DURING SOAS ...83
4.5 CONCLUSION ...86
4.6 CHAPTER 4 FIGURES ...89
REFERENCES ...98
5. CHAPTER 5- LABORATORY AND FIELD STUDIES OF ORGANIC ACIDS TO IDENTIFY BIOGENIC PRECURSORS AND ANTHROPOGENIC INFLUENCE...106
5.1 INTRODUCTION ...106
5.2 EXPERIMENTAL METHODS...109
viii
5.2.2 LABORATORY MEASUREMENTS: FOCUSED ISOPRENE EXPERIMENTS AT THE CALIFORNIA INSTITUTE OF
TECHNOLOGY (FIXCIT) ...110
5.2.3 SOUTHEASTERN OXIDANT AND AEROSOL STUDY (SOAS) ...110
5.2.4 SEASONAL PARTICLES IN A FOREST FLUX STUDY (SPIFFY) ...111
5.2.5 QUANTIFICATION OF ORGANIC ACIDS FROM ACETATE CIMS MEASUREMENTS ...111
5.2.6 POSITIVE MATRIX FACTORIZATION (PMF) ANALYSES OF SOAS AND SPIFFY UMR MEASUREMENTS ...114
5.3 RESULTS AND DISCUSSION ...116
5.3.1 ORGANIC ACID PRODUCTION OBSERVED FROM THE FIXCIT EXPERIMENTS ...116
5.3.1.1 OXIDATION OF ISOPRENE AND α-PINENE OXIDATION PRODUCED COMPOSITIONALLY DIVERSE ORGANIC ACIDS DURING FIXCIT ...116
5.3.1.2 ORGANIC ACID CARBON-EQUIVALENT (Ceq) YIELDS ...117
5.3.2 AMBIENT OBSERVATIONS OF ORGANIC ACIDS FROM SOAS AND SPIFFY ...120
5.3.2.1 Ceq MIXING RATIOS OF ORGANIC ACIDS MEASURED DURING SOAS AND SPIFFY ...120
5.3.2.2 DIEL VARIATION OF ORGANIC ACIDS BY CARBON NUMBER AND FUNCTIONALITY...121
5.3.3 PMF ANALYSES OF AMBIENT GAS-PHASE ORGANIC ACIDS ...122
5.3.3.1 SOAS PMF FACTORS SHOW INFLUENCE OF NO AND HO2 REACTIONS WITH ISOPRENE-DERIVED RO2 ...122
5.3.3.2 SPIFFY PMF FACTORS SHOW DISTINCT DAYTIME AND NIGHTTIME FEATURES ...126
5.4 IMPLICATIONS FOR GAS-PHASE ORGANIC ACIDS IN BIOGENICALLY-INFLUENCED ENVIRONMENTS ...129
5.5 CHAPTER 5 FIGURES ...130
REFERENCES ...142
6. CHAPTER 6- CONCLUSIONS ...151
6.1 SCIENTIFIC OUTCOMES AND AIR QUALITY IMPLICATIONS ...151
6.2 ANALYTICAL TRIUMPHS AND CHALLENGES FOR ATMOSPHERIC CHEMISTRY ...153
6.3 EMBRACING THE “UNKNOWN UNKNOWNS” ...155
7. APPENDIX 1- CHAPTER 2 SUPPLEMENTAL INFORMATION (A1) ...157
8. APPENDIX 2- CHAPTER 3 SUPPLEMENTAL INFORMATION (A2) ...170
9. APPENDIX 3- CHAPTER 4 SUPPLEMENTAL INFORMATION (A3) ...180
1 CHAPTER 1
INTRODUCTION TO TROPOSPHERIC OXIDATION AND REGULATION OF AIR QUALITY
1.1 Formation of Air Pollutants and Implications for Regulation of Air Quality
One of the most vital resources on Earth is air. The quality of air is defined by how much gases or particles, harmful to biological life or the natural world, are present in it. The lowest layer of the atmosphere is the troposphere extending approximately 12 km from the Earth’s surface. In the troposphere gases and particles emitted from natural and human-derived sources undergo chemical reactions that ultimately influence air quality. Since the start of the industrial age humans have had a pronounced influence on air quality at times severely impacting human health and contributing to the deterioration of ecosystems.1 In this modern age we study
chemical reactions that occur in the troposphere to learn from mistakes of the past and inform future generations how to ensure an atmosphere optimal for sustaining biological life.
From a regulatory standpoint, air quality is characterized by the presence of criteria air pollutants. In the United States criteria air pollutants, as defined by the Environmental Protection Agency, include ozone (O3), particulate matter (PM2.5/10), sulfur oxides (SOx), nitrogen oxides
(NOx = NO + NO2), lead, and carbon monoxide (CO).2 Most of these pollutants are emitted
directly from human-derived, or anthropogenic, sources such as automobiles, manufacturing facilities, or through energy production. Regulation of SO2 and NOx from power plants has
proven to be effective at decreasing harmful acid rain in the northeastern US and Canada.3,4
Ozone and particulate matter, on the other hand, represent unique regulatory challenges because they are produced from oxidation chemistry in the troposphere and may not decrease in response to changes in emissions of criteria pollutants.
2
Oxidation of volatile organic compounds (VOCs) in the troposphere controls production of ozone and particulate matter. VOC oxidation mostly occurs through reaction with hydroxyl radical (OH) and when the products of VOC oxidation react with NOx this can produce ozone or
compounds that produce a subset of particulate matter, organic aerosol.5,6 This complicates the
issue of controlling air pollution because (1) VOC sources are diverse, (2) different VOCs produce air pollutants more efficiently than others, and (3) the production of air pollution from VOCs can be non-linear (i.e. decreases in emissions may not result in decreases in pollutant formation).7
Addressing the sources of air pollution effectively requires a detailed knowledge of VOC oxidation chemistry. VOCs emitted from forests are very reactive towards OH and can be very efficient sources of O3 in the presence of low levels of NOx.8,9 Conversely, VOCs emitted from
oil and natural gas operations are far less reactive towards OH than biogenic VOCs, but if emitted in high enough amounts, and accompanied by the appropriate levels of NOx, can be
important sources of O3.10–12 The complexity of pollutant source attribution is echoed when
considering organic aerosol.13,14 When VOCs react with OH they form oxidized organic gases
that can condense to form organic aerosol and different types of VOCs produce organic aerosol with different efficiencies. For instance, recent work has shown that oxidation of volatile consumer products emitted to the outdoors from indoor environments is a larger source of organic aerosol to Los Angeles than automobile emissions.15 Similar to O
3, organic aerosol
production is highly dependent upon VOC type and NOx levels.16 Understanding this oxidation
chemistry is critical for targeting the most important NOx and VOC emission sources with
3
The importance of understanding the effects of oxidation chemistry on pollutant formation does not exclusively have regional implications, but also extends to how intra and trans-continental air quality policy is formed.17 One example of this is shown by David and
Ravishankara18 (2019) who demonstrated that VOC precursors transported from central parts of
the Indian subcontinent were responsible for ~30% of the boundary layer O3 produced in Eastern
India. They concluded reductions of VOC emissions in central India could decrease O3
production in Eastern India. In slight contrast to the findings of the previous study, a paradigm shift in understanding air pollution sources has occurred in South Korea recently as the result of an extensive air sampling campaign.19 Persistent challenges with aerosol pollution and severe
haze events in Seoul, South Korea have often been attributed to transport of pollution from the east coast of China.20 Recent measurements have demonstrated that most of the organic aerosol
pollution observed in Seoul is produced from oxidation of locally emitted VOCs.21 The study did
find, however, that transport from China was still a major source of pollution to rural South Korea necessitating coordinated action from both China and South Korea to address the peninsula’s air quality problem.
1.2 Understanding Tropospheric Chemistry Through Field and Laboratory Studies Major advances in instrumentation over the past 20 years have enabled in situ investigations of tropospheric chemical processes on rapid timescales.22 These advancements, complimented by
numerous collaborative efforts between independent research groups, have allowed for holistic analyses of atmospheric chemical processes as observed over the ocean, in plumes from wildfire smoke, and in arctic expeditions, to name a few.23–25 The level of detail provided by these studies has allowed for very specific identification of VOCs as sources of pollution in ambient
4
environments. For example, one study coupled ensemble VOC measurements, acquired from a remote oil and natural gas basin in Utah, to a detailed chemical model to identify carbonyl VOC photolysis as the major source of oxidants resulting in high O3 production in the wintertime.26
Another study coupled aircraft measurements and chemical modeling to identify toluene as a major precursor for organic aerosol on the Korean peninsula during the summer of 2016.21
Extensive measurements of tropospheric chemistry in field environments have extended our ability to interpret ambient processes resulting in pollution beyond what could have been realized in laboratory settings.
Though field studies provide a holistic picture of tropospheric chemistry, the challenge of interpreting the complex results is often complimented with laboratory-based environmental chamber studies.27 Environmental chambers are generally configured to simulate tropospheric
oxidation of VOCs or inorganic gases for the purpose of measuring oxidation products of interest or aerosol.28 Targeted studies of VOC oxidation in chambers, such as has been done with
isoprene, have helped to elucidate explicit mechanisms of oxidation for VOCs of principle importance to O3 and aerosol formation.29 Chambers also have been used to measure ensemble
organic aerosol production from oxidation of VOC mixtures like vehicle exhaust or biomass burning.30,31 More recently chambers have ventured from laboratory settings and have performed
oxidation of ambient air in forests, from aircraft, and from urban environments.21,32,33 These
field-based chamber studies have identified gaps in knowledge concerning our current
understanding of sources of organic aerosol formation.32 Expanding experimental capabilities
that simulate tropospheric oxidation and measure oxidation products is a promising method to increase specificity when forming ideas on how to regulate air quality.34
5 1.3 Thesis Overview
This thesis presents measurements of tropospheric oxidation products from targeted laboratory studies and in the ambient environment.
Chapter 2 describes the measurement of a toxic gas-phase compound, isocyanic acid, from the OH oxidation of exhaust from an off-road diesel engine. We find oxidation enhances the magnitude of isocyanic acid produced from this source by factors of 2-3 over the course of an equivalent day of atmospheric oxidation. We conclude photochemical processing of off-road diesel exhaust could be an important source of isocyanic acid to urban areas such as the California South Coast Air Basin.
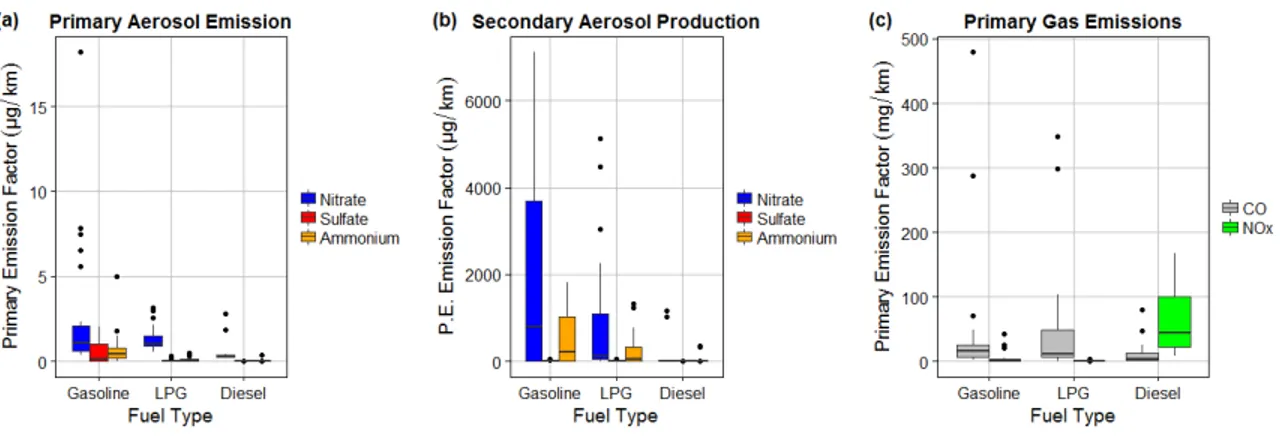
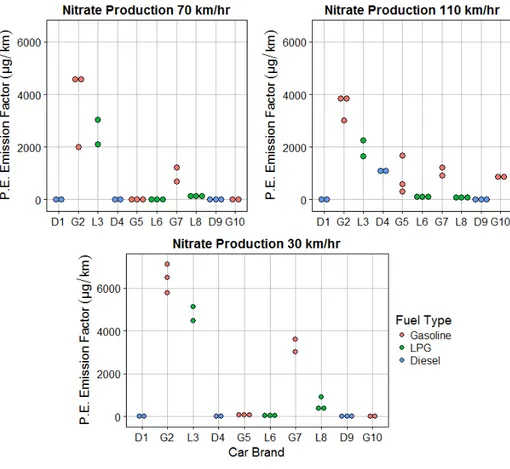
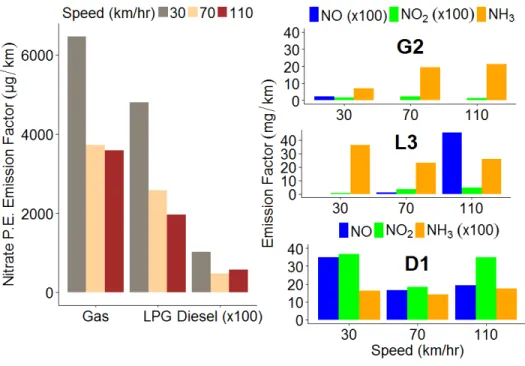
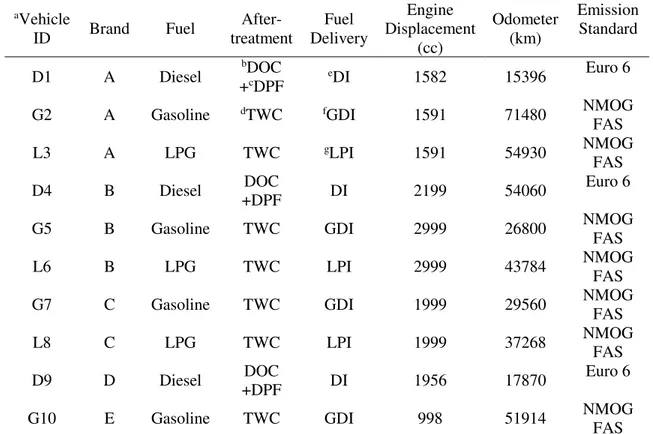
In Chapter 3 we measure ammonium nitrate aerosol primary emission and secondary production, from simulated OH oxidation in an environmental chamber, of exhaust from a
passenger vehicle fleet representative for the Seoul Metropolitan Region. We find that though the levels of NOx emitted from diesel vehicles far exceeded that of other vehicle types, the amount
of ammonium nitrate formed, in response to OH oxidation, was higher in liquid petroleum gas and gasoline vehicles. These findings are consistent with high levels of ammonia emitted from LPG and gasoline vehicles coincident with low levels of NOx that form ammonium nitrate
aerosol. We find that vehicles may contribute significantly to localized secondary inorganic aerosol production in the Seoul Metropolitan Region.
In Chapter 4 we measure yields of formic and acetic acid from the oxidation of isoprene under a variety of experimental conditions. We use experimental evidence combined with detailed chemical modeling to identify missing sources of formic and acetic acid production in current isoprene oxidation mechanisms. Simple calculations, based on our results, suggest
6
isoprene oxidation is likely responsible for major discrepancies between model predictions and observational constraints of global formic acid production.
Chapter 5 presents measurements of total gas-phase organic acid yields from biogenic precursors and compares them to measurements from two forested field sites dominated by different biogenic VOC emissions. From the laboratory studies isoprene is identified as a major source of gas-phase organic acids whereas α-pinene oxidation produces much less. NO is observed to decrease the yield of organic acids from isoprene oxidation and we attribute this effect to isoprene-derived RO2 + NO reactions as an inefficient source of gas-phase organic
acids. Isoprene photochemistry is the dominant source of gas-phase organic acids at the forested site dominated by isoprene emissions. Patterns of organic acid abundance at the field site
dominated by emissions of monoterpenes are distinctly different from the other forested site, but the sources of organic acids are not clear. Isoprene oxidation is likely a major source of organic acids in areas influenced by isoprene emissions globally.
7
REFERENCES
(1) Monks, P. S.; Granier, C.; Fuzzi, S.; Stohl, A.; Williams, M. L.; Akimoto, H.; Amann, M.; Baklanov, A.; Baltensperger, U.; Bey, I.; et al. Atmospheric Composition Change – Global and Regional Air Quality. Atmos. Environ. 2009, 43 (33), 5268–5350.
https://doi.org/10.1016/j.atmosenv.2009.08.021.
(2) Schmalensee, R.; Stavins, R. N. Policy Evolution under the Clean Air Act; National Bureau of Economic Research, 2018.
(3) Lehmann, C. M.; Bowersox, V. C.; Larson, R. S.; Larson, S. M. Monitoring Long-Term Trends in Sulfate and Ammonium in US Precipitation: Results from the National Atmospheric Deposition Program/National Trends Network. In Acid Rain-Deposition to Recovery; Springer, 2007; pp 59–66.
(4) Sullivan, T. J.; Driscoll, C. T.; Beier, C. M.; Burtraw, D.; Fernandez, I. J.; Galloway, J. N.; Gay, D. A.; Goodale, C. L.; Likens, G. E.; Lovett, G. M.; et al. Air Pollution Success Stories in the United States: The Value of Long-Term Observations. Environ. Sci. Policy 2018, 84, 69– 73. https://doi.org/10.1016/j.envsci.2018.02.016.
(5) Monks, P. S.; Archibald, A. T.; Colette, A.; Cooper, O.; Coyle, M.; Derwent, R.; Fowler, D.; Granier, C.; Law, K. S.; Mills, G. E.; et al. Tropospheric Ozone and Its Precursors from the Urban to the Global Scale from Air Quality to Short-Lived Climate Forcer. Atmospheric Chem.
Phys. 2015, 15 (15), 8889–8973. https://doi.org/10.5194/acp-15-8889-2015.
(6) Volkamer, R.; Jimenez, J. L.; Martini, F. S.; Dzepina, K.; Zhang, Q.; Salcedo, D.; Molina, L. T.; Worsnop, D. R.; Molina, M. J. Secondary Organic Aerosol Formation from Anthropogenic Air Pollution: Rapid and Higher than Expected. Geophys. Res. Lett. 2006, 33 (17). https://doi.org/10.1029/2006GL026899.
(7) von Schneidemesser, E.; Monks, P. S.; Allan, J. D.; Bruhwiler, L.; Forster, P.; Fowler, D.; Lauer, A.; Morgan, W. T.; Paasonen, P.; Righi, M.; et al. Chemistry and the Linkages between Air Quality and Climate Change. Chem. Rev. 2015, 115 (10), 3856–3897. https://doi.org/10.1021/acs.chemrev.5b00089.
(8) Travis, K. R.; Jacob, D. J.; Fisher, J. A.; Kim, P. S.; Marais, E. A.; Zhu, L.; Yu, K.; Miller, C. C.; Yantosca, R. M.; Sulprizio, M. P.; et al. Why Do Models Overestimate Surface Ozone in the Southeast United States? Atmospheric Chem. Phys. 2016, 16 (21), 13561–13577. https://doi.org/https://doi.org/10.5194/acp-16-13561-2016.
8
(9) Sanderson, M. G.; Jones, C. D.; Collins, W. J.; Johnson, C. E.; Derwent, R. G. Effect of Climate Change on Isoprene Emissions and Surface Ozone Levels. Geophys. Res. Lett. 2003, 30 (18). https://doi.org/10.1029/2003GL017642.
(10) McDuffie, E. E.; Edwards, P. M.; Gilman, J. B.; Lerner, B. M.; Dubé, W. P.; Trainer, M.; Wolfe, D. E.; Angevine, W. M.; deGouw, J.; Williams, E. J.; et al. Influence of Oil and Gas Emissions on Summertime Ozone in the Colorado Northern Front Range. J. Geophys. Res.
Atmospheres 2016, 121 (14), 8712–8729. https://doi.org/10.1002/2016JD025265.
(11) Gilman, J. B.; Lerner, B. M.; Kuster, W. C.; de Gouw, J. A. Source Signature of Volatile Organic Compounds from Oil and Natural Gas Operations in Northeastern Colorado. Environ.
Sci. Technol. 2013, 47 (3), 1297–1305. https://doi.org/10.1021/es304119a.
(12) Abeleira, A.; Pollack, I. B.; Sive, B.; Zhou, Y.; Fischer, E. V.; Farmer, D. K. Source Characterization of Volatile Organic Compounds in the Colorado Northern Front Range Metropolitan Area during Spring and Summer 2015. J. Geophys. Res. Atmospheres 2017, 2016JD026227. https://doi.org/10.1002/2016JD026227.
(13) Carlton, A. G.; Pinder, R. W.; Bhave, P. V.; Pouliot, G. A. To What Extent Can Biogenic SOA Be Controlled? Environ. Sci. Technol. 2010, 44 (9), 3376–3380.
https://doi.org/10.1021/es903506b.
(14) Carlton, A. M. G.; Pye, H. O. T.; Baker, K. R.; Hennigan, C. J. Additional Benefits of Federal Air Quality Rules: Model Estimates of Controllable Biogenic Secondary Organic Aerosol. Environ. Sci. Technol. 2018. https://doi.org/10.1021/acs.est.8b01869.
(15) McDonald, B. C.; Gouw, J. A. de; Gilman, J. B.; Jathar, S. H.; Akherati, A.; Cappa, C. D.; Jimenez, J. L.; Lee-Taylor, J.; Hayes, P. L.; McKeen, S. A.; et al. Volatile Chemical Products Emerging as Largest Petrochemical Source of Urban Organic Emissions. Science 2018, 359 (6377), 760–764. https://doi.org/10.1126/science.aaq0524.
(16) Xu, L.; Guo, H.; Boyd, C. M.; Klein, M.; Bougiatioti, A.; Cerully, K. M.; Hite, J. R.; Isaacman-VanWertz, G.; Kreisberg, N. M.; Knote, C.; et al. Effects of Anthropogenic Emissions on Aerosol Formation from Isoprene and Monoterpenes in the Southeastern United States. Proc.
Natl. Acad. Sci. 2015, 112 (1), 37–42. https://doi.org/10.1073/pnas.1417609112.
(17) Dentener, F.; Keating, T.; Akimoto, H. Hemispheric Transport of Air Pollution 2010: Part A: Ozone and Particulate Matter, Air Pollut. Stud 2011, 17, 305.
(18) David, L. M.; Ravishankara, A. R. Boundary Layer Ozone Across the Indian Subcontinent: Who Influences Whom? Geophys. Res. Lett. 0 (0).
9
(19) Huang, M.; Crawford, J. H.; Diskin, G. S.; Santanello, J. A.; Kumar, S. V.; Pusede, S. E.; Parrington, M.; Carmichael, G. R. Modeling Regional Pollution Transport Events During
KORUS-AQ: Progress and Challenges in Improving Representation of Land-Atmosphere Feedbacks. J. Geophys. Res. Atmospheres 2018, 123 (18), 10,732-10,756.
https://doi.org/10.1029/2018JD028554.
(20) Kim, H. C.; Kim, E.; Bae, C.; Cho, J. H.; Kim, B.-U.; Kim, S. Regional Contributions to Particulate Matter Concentration in the Seoul Metropolitan Area, South Korea: Seasonal
Variation and Sensitivity to Meteorology and Emissions Inventory. Atmos Chem Phys 2017, 17 (17), 10315–10332. https://doi.org/10.5194/acp-17-10315-2017.
(21) Nault, B. A.; Campuzano-Jost, P.; Day, D. A.; Schroder, J. C.; Anderson, B.; Beyersdorf, A. J.; Blake, D. R.; Brune, W. H.; Choi, Y.; Corr, C. A.; et al. Secondary Organic Aerosol Production from Local Emissions Dominates the Organic Aerosol Budget over Seoul, South Korea, during KORUS-AQ. Atmospheric Chem. Phys. 2018, 18 (24), 17769–17800.
https://doi.org/https://doi.org/10.5194/acp-18-17769-2018.
(22) Farmer, D. K.; Jimenez, J. L. Real-Time Atmospheric Chemistry Field Instrumentation.
Anal. Chem. 2010, 82 (19), 7879–7884. https://doi.org/10.1021/ac1010603.
(23) Carlton, A. G.; de Gouw, J.; Jimenez, J. L.; Ambrose, J. L.; Attwood, A. R.; Brown, S.; Baker, K. R.; Brock, C.; Cohen, R. C.; Edgerton, S.; et al. Synthesis of the Southeast
Atmosphere Studies: Investigating Fundamental Atmospheric Chemistry Questions. Bull. Am.
Meteorol. Soc. 2018, 99 (3), 547–567. https://doi.org/10.1175/BAMS-D-16-0048.1.
(24) Sullivan, A. P.; Guo, H.; Schroder, J. C.; Campuzano‐Jost, P.; Jimenez, J. L.; Campos, T.; Shah, V.; Jaeglé, L.; Lee, B. H.; Lopez‐Hilfiker, F. D.; et al. Biomass Burning Markers and Residential Burning in the WINTER Aircraft Campaign. J. Geophys. Res. Atmospheres 2019,
124 (3), 1846–1861. https://doi.org/10.1029/2017JD028153.
(25) Mungall, E. L.; Abbatt, J. P. D.; Wentzell, J. J. B.; Lee, A. K. Y.; Thomas, J. L.; Blais, M.; Gosselin, M.; Miller, L. A.; Papakyriakou, T.; Willis, M. D.; et al. Microlayer Source of Oxygenated Volatile Organic Compounds in the Summertime Marine Arctic Boundary Layer.
Proc. Natl. Acad. Sci. 2017, 114 (24), 6203–6208. https://doi.org/10.1073/pnas.1620571114.
(26) Edwards, P. M.; Brown, S. S.; Roberts, J. M.; Ahmadov, R.; Banta, R. M.; deGouw, J. A.; Dubé, W. P.; Field, R. A.; Flynn, J. H.; Gilman, J. B.; et al. High Winter Ozone Pollution from Carbonyl Photolysis in an Oil and Gas Basin. Nature 2014, 514 (7522), 351–354. https://doi.org/10.1038/nature13767.
(27) Burkholder, J. B.; Abbatt, J. P. D.; Barnes, I.; Roberts, J. M.; Melamed, M. L.; Ammann, M.; Bertram, A. K.; Cappa, C. D.; Carlton, A. G.; Carpenter, L. J.; et al. The Essential Role for
10
Laboratory Studies in Atmospheric Chemistry. Environ. Sci. Technol. 2017, 51 (5), 2519–2528. https://doi.org/10.1021/acs.est.6b04947.
(28) Peng, Z.; Lee-Taylor, J.; Orlando, J. J.; Tyndall, G. S.; Jimenez, J. L. Organic Peroxy Radical Chemistry in Oxidation Flow Reactors and Environmental Chambers and Their Atmospheric Relevance. Atmospheric Chem. Phys. 2019, 19 (2), 813–834.
https://doi.org/https://doi.org/10.5194/acp-19-813-2019.
(29) Wennberg, P. O.; Bates, K. H.; Crounse, J. D.; Dodson, L. G.; McVay, R. C.; Mertens, L. A.; Nguyen, T. B.; Praske, E.; Schwantes, R. H.; Smarte, M. D.; et al. Gas-Phase Reactions of Isoprene and Its Major Oxidation Products. Chem. Rev. 2018.
https://doi.org/10.1021/acs.chemrev.7b00439.
(30) Koss, A. R.; Sekimoto, K.; Gilman, J. B.; Selimovic, V.; Coggon, M. M.; Zarzana, K. J.; Yuan, B.; Lerner, B. M.; Brown, S. S.; Jimenez, J. L.; et al. Non-Methane Organic Gas
Emissions from Biomass Burning: Identification, Quantification, and Emission Factors from PTR-ToF during the FIREX 2016 Laboratory Experiment. Atmos Chem Phys 2018, 18 (5), 3299–3319. https://doi.org/10.5194/acp-18-3299-2018.
(31) Robinson, A. L.; Donahue, N. M.; Shrivastava, M. K.; Weitkamp, E. A.; Sage, A. M.; Grieshop, A. P.; Lane, T. E.; Pierce, J. R.; Pandis, S. N. Rethinking Organic Aerosols:
Semivolatile Emissions and Photochemical Aging. Science 2007, 315 (5816), 1259–1262. https://doi.org/10.1126/science.1133061.
(32) Palm, B. B.; Campuzano-Jost, P.; Ortega, A. M.; Day, D. A.; Kaser, L.; Jud, W.; Karl, T.; Hansel, A.; Hunter, J. F.; Cross, E. S.; et al. In Situ Secondary Organic Aerosol Formation from Ambient Pine Forest Air Using an Oxidation Flow Reactor. Atmos Chem Phys 2016, 16 (5), 2943–2970. https://doi.org/10.5194/acp-16-2943-2016.
(33) Ortega, A. M.; Hayes, P. L.; Peng, Z.; Palm, B. B.; Hu, W.; Day, D. A.; Li, R.; Cubison, M. J.; Brune, W. H.; Graus, M.; et al. Real-Time Measurements of Secondary Organic Aerosol Formation and Aging from Ambient Air in an Oxidation Flow Reactor in the Los Angeles Area.
Atmos Chem Phys 2016, 16 (11), 7411–7433. https://doi.org/10.5194/acp-16-7411-2016.
(34) Glasius, M.; Goldstein, A. H. Recent Discoveries and Future Challenges in Atmospheric Organic Chemistry. Environ. Sci. Technol. 2016, 50 (6), 2754–2764.
11 CHAPTER 2
PHOTOCHEMICAL PROCESSING OF DIESEL FUEL EMISSIONS FORMS A LARGE SECONDARY SOURCE OF ISOCYANIC ACID (HNCO)1
2.1 Introduction
Atmospherically relevant levels of isocyanic acid (HNCO) are expected to be toxic at biological pH.1 Toxic effects of HNCO are associated with cataracts, atherosclerosis,
cardiovascular disease, renal failure and rheumatoid arthritis.2 Roberts et al (2011) estimated
exposure to only 1 ppbv HNCO could produce aqueous isocyanate in the body, which can trigger
harmful protein modifying processes.3–5 Previous studies have recognized the occupational hazard of exposure to isocyanates, including HNCO, and have measured mixing ratios of HNCO near 1 ppbv in different workplace environments underscoring the need to characterize its
sources.6–8 Observations of HNCO have been performed from direct sources such as light duty
gasoline vehicle emissions, light duty diesel vehicle emissions, biomass burning and from secondary sources such as the photochemical oxidation of 2-aminoethanol and the aqueous dissociation of urea.1,5,9–11 Studies in the ambient environment have correlated HNCO with photochemically produced species such as ozone, formic acid and nitric acid, which is consistent with a photochemical source of HNCO.10,12–14 However, direct measurements of the
photochemical production of HNCO have only been made in laboratory studies from isolated precursors such as 2-aminoethanol.11 While modeled HNCO production from 2-aminoethanol
1Link, M.F., Friedman, B., Fulgham, R., Brophy, P., Galang, A., Jathar, S.H., Veres, P., Roberts,
J.M., Farmer, D.K., 2016. Photochemical processing of diesel fuel emissions as a large secondary source of isocyanic acid (HNCO). Geophysical Research Letters, 43(8), pp.4033-4041.
12
oxidation only accounted for 14% of ambient measured HNCO in one study, ambient mixing ratios of formamide, can account for almost all observed HNCO in some rural
environments.12,15,16
Emissions from non-road diesel engines have received less attention than emissions from on-road vehicles. Non-road diesel vehicles contributed 18% and 15% to PM10 and nitrogen oxide (NOx) emissions, respectively, in the United States in 2011. Previous studies have demonstrated that diesel exhaust is also a primary source of HNCO.10,17 The most recent EPA
Tier 4 standards of emissions reduction regulations have focused on the reduction of NOx by requiring all non-road diesel vehicles produced after 2015 to be equipped with selective catalytic reduction systems (SCR) in addition to particle reducing filters and hydrocarbon oxidation catalysts required by previous emission control mandates. The addition of SCR systems to diesel vehicles are known to produce HNCO as an intermediate in the NOx reduction process which has resulted in higher emission factors of HNCO observed than without the addition of the SCR system.17 Wentzell et al (2013) measured HNCO emissions from light duty diesel engine
exhaust, and concluded that diesel engine emissions in the greater Toronto area are smaller HNCO sources than biomass burning throughout Canada. They speculated, however, that HNCO emissions from heavy duty diesel vehicles and non-road use of diesel may be much larger as these sources are dominant contributors to total mobile source pollution.
Here, we investigate secondary production of HNCO by simulating photochemical
oxidation (or aging) of diesel and biodiesel exhaust from a non-road diesel engine, and the extent to which this chemistry enhances the HNCO source from diesel exhaust. Despite regulatory controls in the US, urban air pollution remains a public health concern, particularly for highly sensitive groups.18 Primary diesel particle emissions, and their resulting secondary chemistry,
13
have long been recognized as source of urban air pollution, but here we investigate the role of photochemically enhanced HNCO diesel engine emissions.19
2.2 Materials and Methods 2.2.1 Experimental Setup
The Diesel Exhaust Fuel and Control (DEFCON) experiment took place at the Colorado State University Engines and Energy Conversion Lab during June 3-11, 2015. A 4-cylinder, turbocharged, intercooled, heavy-duty diesel engine (John Deere 4045H), representative of those found in skid-steer loaders, tractors, etc., was run on an engine dynamometer under idle and 50% load operating conditions using both diesel (sulfur content 6-10 ppm) and biodiesel fuels to produce exhaust. No emissions control systems – including diesel oxidation catalyst, diesel particulate filter, nor SCR unit – were included in the experiments described herein. Raw exhaust was transferred through 4 m of heated Silcosteel© stainless steel line to a primary dilution
system.20 The exhaust was mixed with HEPA- and activated charcoal- filtered room air (Figure
A1.1) to achieve dilution ratios of 45-110 (air:exhaust). The diluted exhaust was transferred to a 300 L stainless steel tank and had a residence time in the equilibration tank of 10 minutes before undergoing continuous sampling. Diluted engine exhaust is subsampled to the potential aerosol mass (PAM) reactor where oxidation occurs then this sample air is directed to both particle and gas-phase instruments on different sampling lines (Figure A1.1). Mixing ratios of CO2, CO, total
hydrocarbons (THC), NO, and NO2 were measured by a 5-gas analyzer from the primary engine
exhaust upstream of the dilution chamber (Table A1.1).20
The diluted sample exhaust was introduced into a potential aerosol mass (PAM) reactor to simulate atmospheric oxidation at a flowrate of 7 sLpm (residence time ~100 s).21,22 The PAM
14
(BHK Inc., Model # 82-9304-03) to simulate atmospheric HO2 and OH oxidation chemistry. UV
light is emitted at 185 and 254 nm in the reactor and initiates the production of hydroxyl radicals (OH) from the photolysis of O2 and H2O. The concentration of OH depends on the UV intensity
emitted by the lamps and can simulate atmospheric aging of hours to weeks.21
The high reactivity (~5000 s-1) of the diesel exhaust suppressed OH by a factor of two at
the lowest UV light intensities and 14 at the highest intensities (see Supplemental Information for detailed calculations), comparable to the OH suppression observed during PAM experiments on biomass burning emissions.23 The factor contributing most to variability in the estimated OH
reactivity of the diesel exhaust in the PAM chamber was the dilution of the exhaust sample in the dilution chamber. The OH exposure in the PAM chamber is typically described in terms of equivalent days of OH exposure [Lambe et al., 2011; Li et al., 2015; Peng et al., 2015], which is calculated by dividing the OH exposure (molecules cm-3 s) by an average atmospheric OH
concentration (1.5 x 10⁶ molecules cm-3, [Mao et al., 2008]).22,24–26 The experiments described
herein cover oxidative aging by OH of 0.2-1.5 (± 50%) equivalent days of OH exposure (OHexp)
(Figure A1.2).
2.2.2 Exhaust Experiments
We measured HNCO from engine emissions during six different experiments: two replicates of diesel fuel with engine at idle, two replicates of diesel fuel with engine at 50% load, one experiment with biodiesel fuel and engine at idle, and one experiment with biodiesel fuel and engine at 50% load. Each experiment consisted of six steps of increasing UV light voltage in the PAM chamber; each voltage step was held for 20 minutes. The 0V voltage step in the PAM represents the exhaust exposed to no UV light.
15
2.2.3 Acetate Chemical Ionization Mass Spectrometer (acetate-CIMS) Operation and Calibration
HNCO was detected by a high-resolution time-of-flight acetate-CIMS (Tofwerk AG and Aerodyne Research, Inc.). The ionization chemistry and instrument have been described
extensively in previous literature.9,10,27–29 Sample air for gas phase analytes was pulled through 3 m of PEEK tubing from the PAM chamber to the acetate-CIMS and diluted at the entrance to the instrument by 3.6 sLpm of ultra-high purity N2 to maintain first order reactions of the analytes in
the sample gas with the acetate reagent ion. The acetate-CIMS pulled sample air through a critical orifice (I.D. 0.067 cm) at a flowrate of 1.5 sLpm. Thus the emissions were diluted by a factor of 1200-3500 (air:exhaust) between the engine tailpipe and the instrument. Despite this large dilution, the reagent ion signal was titrated by large signals observed at m/z 45.99 (NO2-)
and m/z 61.99 (NO3-) throughout the experiments, likely due to HONO and HNO3, respectively.
HNCO can be ionized through either a proton transfer or clustering reaction with acetate (Ac-),
Ac- + HNCO → HAc + CNO- (R1a)
HAc(Ac-) + HNCO → HAc(CNO-) + HAc (R1b)
The ion optics in the acetate-CIMS were tuned to minimize clustering in the observed spectra so that HNCO is detected as NCO- at m/z 41.99.29 No interfering species at same nominal mass as
HNCO were observed through peak fitting procedures either during calibration or during the DEFCON experiments.
16
We calibrated the acetate-CIMS for HNCO with a stable source of HNCO that was produced by passing a stream of zero air at 50 sccm over the outlet of a diffusion cell containing heated cyanuric acid (250°C).28 HNCO concentrations were determined with a custom-built
analyzer that converts HNCO to NO on a heated platinum catalyst (750°C) followed by a
molybdenum catalyst (450°C) and detects NO via chemiluminescence.30 The acetate-CIMS had
a sensitivity to HNCO of 47.5 normalized cps/pptv, and a detection limit (S/N = 3) for HNCO of
5 pptv at 1 second acquisition (Supplemental information for additional calibration details).
2.2.4 Calculation of Fuel Based Enhanced Emission Factors (EEFt)
Fuel based emission factors have been recognized as a useful metric for comparing engines operating under different conditions but using similar fuels.9 Emission factors (EF,
mg-HNCO/kg-fuel) were first calculated by:
𝐸𝐹 = [𝐻𝑁𝐶𝑂]
( [𝐶𝑂2]
𝑀𝑊𝐶𝑂2+𝑀𝑊𝐶𝑂[𝐶𝑂] )𝐴𝑊𝑐
𝐶𝑖 (1)
where concentrations are in mg cm-3 (HNCO) or g cm-3 (CO, CO
2); Ci is the carbon mass
fraction of the fuel (850 and 770 gC/kg-fuel for diesel and biodiesel, respectively); and MWCO2,
MWCO, and AWC are the molecular weights of CO2 and CO, and the atomic weight of carbon.31
All concentration values used in the EF calculation were calculated from the dilution ratio in the dilution chamber to produce tailpipe exhaust emission concentrations. We define fuel based enhanced emission factors (EEFt, mg-HNCO/kg-fuel) as the HNCO produced from a given
amount of fuel via atmospheric aging of diesel exhaust. EEFts thus describe the extent of
pollutant production from a given photochemical oxidation of engine exhaust originating from the combustion of a known amount of fuel. The EEFt of a pollutant is a function of
17
photochemical exposure and will vary with time the pollutant spends in the atmosphere. EEFts
were calculated to quantify the contribution of secondary production of HNCO from primary exhaust. EEFts were then calculated via equation (2):
𝐸𝐸𝐹𝑡 = 𝐸𝐹𝑣𝑜𝑙𝑡𝑎𝑔𝑒 𝑠𝑡𝑒𝑝− 𝐸𝐹0𝑉 𝑠𝑡𝑒𝑝 (2)
Where EFvoltage step is the EF for HNCO at a given UV light voltage step and EF0V step is the EF
for HNCO at the UV light voltage step representative of diesel exhaust unperturbed by oxidation. The EEFt is defined as a difference from the EF at the 0V step in order to separate the primary
HNCO emission from the secondary HNCO formation. 2.3 Results and Discussion
2.3.1 Primary Emission of HNCO
EFs were within experimental error of one another for diesel and biodiesel under the same engine operating conditions (Table 2.1). EFs were, however, 3x larger for idle engine conditions (54 mg HNCO/kg diesel fuel) versus 50% load conditions (17 mg HNCO/kg fuel). EFs reported in the study herein are considerably higher than those reported in previous
literature. EFs for HNCO reported by Heeb et al (2011) were similar between engine operating conditions at 4 mg HNCO/kg of diesel fuel for on-road light duty engines. Similarly, Brady et al (2014) measured EFs for HNCO on the order of 1-2 mg HNCO/kg of gasoline fuel for light duty gasoline vehicles. We note that Wentzell et al (2013) observed a difference in primary HNCO emission as a function of engine operating condition, but with higher EFs (4.0 mg HNCO/kg diesel fuel) during active engine operating conditions and lower EFs for idle conditions (0.7 mg HNCO/kg diesel fuel). Our data suggest that non-road diesel engines produce more primary HNCO than either the on-road light duty gasoline or diesel engines described in previous studies. Further, this type of engine produces much wider ranging primary HNCO emissions than
18
reported for other engine types. These comparisons suggest that similar engine operating
conditions may produce different effects on the emissions between non-road diesel engines, such as the one used in this study, and on-road diesel engines like those used in previous studies.
Idle operating conditions generally result in less efficient combustion than more active engine operating conditions such as the 50% load conditions in this study as evidenced by the difference in THC concentration between operating conditions (Table A1.1). Our observations suggest that incomplete combustion can also be accompanied by increased primary HNCO emissions. This suggests that more precursors for HNCO could be available in the incompletely combusted exhaust under idle conditions than 50% load conditions.32 Emissions of CO, NO
x, and
THC measured from the engine in this study agree well with measurements reported from the same engine in another study suggesting the emissions from this engine are reproducible.33 The
CO mixing ratios measured in this study are nearly twice as high as those measured by Wentzell et al (2013) under similar (idle) engine operating conditions, consistent with our observations of higher primary HNCO. The lower bound of the variability of THC measured in this study under idle conditions captures the average THC mixing ratio measured by Wentzell et al (2013). In contrast, Wentzell et al (2013) reports NOx emissions that are larger by a factor of 6-7 than the NOx measured in this study. Indeed, the HNCO/NOx ratios measured in this study (Table A1.2)
are much higher than the ratios reported in Wentzell et al (2013).
Previous studies have shown that steady-state engine cycles, such as those used in this study, can underestimate and misrepresent emissions of particles as well as pollutants such as HNCO.34 For instance, Brady et al (2014) measured the highest emissions of HNCO during
acceleration from gasoline exhaust. By measuring HNCO from steady-state engine conditions, we are providing a lower bound to what can be expected for real-world emissions of HNCO from
19
non-road diesel engines. Unlike on-road vehicles, non-road vehicles typically operate at steady-state, either idle or peak, engine loads. This suggests that the HNCO emissions presented herein are similar to what could be expected from real-world engine performance.
2.3.2 Secondary source of HNCO
We observe a strong secondary source of HNCO from diesel engine exhaust as a result of 0.4 to 1.5 days of photochemical aging for both biodiesel and diesel fuel and under both idle and high load operating conditions. Oxidation of diesel exhaust in the PAM chamber produced HNCO, enhancing observed concentrations by up to a factor of 4 (Figure 2.1, A1.5). All fuel types and engine operating conditions demonstrated similar behavior with photochemical
enhancement of HNCO. Figure 1 shows an example of secondary HNCO production from diesel under idle and 50% load engine operating conditions. HNCO consistently increased with
photochemical exposure.
Idle conditions produced consistently higher HNCO mixing ratios than 50% load operating conditions. EEFts of secondary HNCO from photochemical oxidation of diesel and biodiesel exhaust increase as a function of OH exposure under idle and 50% load conditions (Figure 2.2). EEFts of HNCO were higher under idle engine operating conditions than 50% load conditions for both fuels. Under idle conditions, HNCO emissions were enhanced by a factor of 4 after 1.5 OH equivalent days. This enhancement is the equivalent of 230 mg HNCO per kg of fuel, compared to primary emissions of 54 mg HNCO/kg of fuel (Figure S4.2). In contrast, the HNCO emissions were only enhanced by a factor of 1.5-3 after 1.5 OH equivalent days under 50% load conditions, or an increase of 26 mg HNCO/kg fuel. We hypothesize that HNCO EEFts are higher under idle conditions because there are more precursors for photochemical production available in incompletely combusted diesel exhaust (Figure S4.4).
20
2.3.3 Implications for Diesel Emission Reduction Technologies
Primary emissions of HNCO have been observed to be higher in the exhaust of diesel systems equipped with SCR (or de-NOx) systems. Heeb et al (2011) measured HNCO from diesel exhaust filtered through a de-NOx system and observed an increase in primary HNCO emissions by almost an order of magnitude under engine conditions similar to primary emissions observed in this study (from 3 to 79 mg HNCO/kg fuel). Krocher et al (2005) also reported tailpipe mixing ratios of HNCO much higher than those measured in this study (16-80 ppmv)
with the use of a de-NOx system. The decomposition of urea to HNCO and the subsequent hydrolysis of HNCO are temperature and catalyst dependent often resulting in emission of HNCO from the inefficient operation of the SCR system known as “HNCO slip”.35 Future
studies should investigate the photochemical enhancement of HNCO from diesel exhaust treated with EPA Tier 4 emission abatement technologies such as diesel particle filters, oxidation catalysts, and SCRs.
Changing the composition of diesel fuel to biodiesel has been suggested to reduce emissions from older diesel vehicles that are not equipped with emissions control technologies.36
While changing the composition of diesel fuel has been shown to be useful in reducing particle emissions, we demonstrate here that changing the composition of diesel fuel may not have a significant effect on reducing primary or secondary emissions of other pollutants such as HNCO.37
2.3.4 Atmospheric Relevance
We evaluate the relative contributions of primary vehicle emissions and secondary sources for the California South Coast Air Basin (SoCAB) as well as California statewide wildfire sources to total HNCO emissions in Table 2.2. Contributions of HNCO to this airshed
21
from different mobile sources include on-road light duty gasoline vehicles (using an average HNCO/CO ratio calculated from the work of Brady et al (2014)) and on-road light duty diesel vehicles, as well as contributions from non-road use of diesel (non-road diesel engines are assumed to be representative of the engine used in this study), using an average HNCO/CO measured in this study, were evaluated from emissions reports estimates published in 2013.10,38
Inclusion of on-road light duty gasoline vehicles, non-road use of diesel and on-road light duty diesel accounts for 80% of total CO emissions from mobile sources reported by the California Air Resources Board (CARB) project emissions for 2015 totaling 1,505 tons/day. The largest sources of CO excluded from this calculation are from on-road medium duty trucks and recreational boats which accounts for ~17% of total reported CO emissions. Using HNCO/CO ratios for the respective vehicle types, HNCO is calculated to be emitted in the greatest
abundance by the non-road use of diesel (Table 2.2).
Although light duty gasoline vehicles contribute >55% to the total CO emissions from mobile sources in this estimate, they contribute <2% of the HNCO directly emitted from mobile sources. Total mobile sources of HNCO emissions in SoCAB are less than statewide emissions from wildfires. If the HNCO emissions from mobile sources are assumed to be enhanced by a factor of 3, as measured in this study from 1.5 OH-equivalent days of atmospheric aging, then the secondary photochemical production of HNCO from mobile sources becomes several
tons/day greater than primary contributions from wildfires. Previous modeling has suggested that the most important anthropogenic source of HNCO to the atmosphere is biomass burning, but here we provide evidence to suggest secondary production of HNCO, from anthropogenic sources, may be more important than primary sources in certain regions.39 Further, we speculate
22
global source of HNCO due to the large amount of reduced nitrogen potentially released to the atmosphere during fire events.
The estimates of secondary production of HNCO presented in Table 2.2 may represent an upper bound for HNCO production from these sources because sinks for HNCO are not
considered. The above estimate assumes that all the precursors leading to secondary HNCO production from these sources are oxidized to form HNCO as opposed to being lost through deposition or uptake to aerosol surfaces. Additionally, we assume that exhaust from all the emission sources included in this estimate experience photochemical enhancements of HNCO similar to the exhaust measured in this study. The above estimates, however, may represent a lower bound because our observations of photochemical production are limited to 1.5 days of equivalent OH exposure. Experiments that observe HNCO production within a greater range of OHexp could provide insight into more realistic upper bounds of photochemical production. Other
precursor compounds for photochemically produced HNCO, such as 2-aminoethanol and
formamide, have been suggested to be important for contributing to ambient atmospheric HNCO and were not included in this estimate.11,40 Possible precursors for secondary HNCO production
include formamide and acetamide, which were observed during the diesel, but not biodiesel, experiments. A rough estimate of formamide and acetamide concentrations suggests that they could account for up to ~15% of the observed HNCO in the diesel experiments (A1.4.3 for further discussion of this analysis and uncertainties). Importantly, the nitrogen-containing organic species were observed to have clear secondary photochemical sources, suggesting that HNCO may be the result of multiple generations of oxidation; the precursors for formamide and acetamide in the diesel mixture are not known at this time. Other nitrogen-containing organic compounds must contribute to HNCO photochemical production in the biodiesel experiments,
23
and potentially to the diesel experiments as well. Further investigation into the emissions of such compounds and their chemistry is warranted. Studies focusing on the photochemical production of HNCO from biomass burning emissions as well as different vehicle sources would help clarify the precise contribution of secondary HNCO to the total atmospheric burden.
2.4 Conclusions
We present a direct observation of a photochemical source of HNCO from non-road diesel engine exhaust. This photochemical source is larger than the primary emission source, consistent with previous ambient HNCO observations.12,14 Both primary emissions and
secondary production of HNCO were observed to be higher under idle engine operating conditions compared to active conditions. No difference in primary emissions or secondary production of HNCO was observed through the use of diesel or biodiesel as a fuel source. While localized emissions of HNCO, either from biomass burning or mobile sources, greatly influence mixing ratios observed in ambient air, we suggest that photochemical production of HNCO could be a dominant contributor to regional HNCO budgets, and potentially to the global burden of HNCO.
An understanding of HNCO sources are essential for predicting human health effects, and for identifying controllable sources. This study demonstrates that compounds that are normally thought of as having primary sources from mobile combustion sources can be enhanced through secondary processing in the atmosphere. Inclusion of secondary pollutant sources in emissions regulation may lead to a more accurate portrayal of the potential impact of mobile sources or emissions control procedures on regional air quality.
24 2.5 Chapter 2 Figures
Figure 2.1. HNCO mixing ratio (ppbv) during a typical PAM oxidation experiment under idle
(orange) and 50% load (blue) engine operating conditions with diesel fuel. Increasing UV light voltage increases the OHexp (red).
25
Figure 2.2. EEFts of HNCO plotted against OHexp (assuming average [OH] = 1.5 x 10⁶
molecules cm-3) for biodiesel (green) and diesel (black) fuels under idle (circles) and 50% load
(triangles) engine operating conditions. Vertical error bars represent the errors in measured mixing ratios of HNCO, CO2, and CO propagated throughout the calculations of EFs and EEFts.
Horizontal error bars are the ±1 standard deviation of the output from the OHexp estimation
26 2.6 Chapter 2 Tables
Table 2.1. EFs and EEFs after 1.5 days of photochemical aging (EEF1.5 days) for both fuel types
and under both engine operating conditions. The EF describes primary emission of HNCO from the combustion of the fuel whereas the EEF1.5 days describes how much HNCO is
photochemically produced after 1.5 days of aging. The total emission of HNCO from the combustion of a given fuel source (EF + EEFt) contributed from both primary emission and
secondary formation of HNCO are shown in Figure A1.5.
Idle 50% Load EF (mg HNCO/kg fuel) EEF1.5 days (mg HNCO/kg fuel) EF (mg HNCO/kg fuel) EEF1.5 days (mg HNCO/kg fuel) Diesel 54 ± 3 183 ± 13 17 ± 1 26 ± 2 Biodiesel 54 ± 1 187 ± 17 17 ± 2 10 ± 2
Table 2.2. Comparison of mobile and statewide wildfire HNCO sources calculated from reported CO emissions by the CARB projected for 2015. Photochemically enhanced HNCO emissions describe total emissions of HNCO from mobile sources after ~1.5 equivalent days of
atmospheric aging.
Emission Source CO Emissions (tons/day)
HNCO Emissions (tons/day)
dSecondary HNCO
Emissions (tons/day) On-road light duty
gasoline vehiclesa 881 0.04 0.12
On-road light duty diesel
vehiclesb 5 0.02 0.06
Non-road use of dieselc 619 2.76 8.28
Total Mobile Sources
and non-road sources 1505 2.82 8.46
27
aHNCO emissions are calculated using an average HNCO/CO ratio of 0.028 mmol HNCO mol
CO-1 calculated from the work of Brady et al (2014) measured from light duty gasoline vehicles. bHNCO emissions are calculated using HNCO/CO ratio of 2.3 mmol HNCO mol CO-1 reported
by Wentzell et al (2013) for a light duty diesel engine.
cHNCO emissions are calculated using an average HNCO/CO ratio of 2.9 mmol HNCO mol CO -1 measured in this study from a non-road diesel engine.
dEnhanced HNCO emissions are calculated by multiplying primary mobile source HNCO
emissions by a photochemical enhancement factor of 3 based on our observations for 1.5 OH equivalent days of aging. While this represents a lower bound for oxidative production, as precursor molecules may have lifetimes longer than 1.5 days, we note that this estimate ignores the role of deposition, which may rapidly remove HNCO precursors from the atmosphere.
eHNCO emissions were calculated using an average HNCO/CO ratio of 0.7 mmol HNCO mol
28 REFERENCES
(1) Roberts, J. M.; Veres, P. R.; Cochran, A. K.; Warneke, C.; Burling, I. R.; Yokelson, R. J.; Lerner, B.; Gilman, J. B.; Kuster, W. C.; Fall, R.; et al. Isocyanic Acid in the Atmosphere and Its Possible Link to Smoke-Related Health Effects. Proc. Natl. Acad. Sci. 2011, 108 (22), 8966– 8971. https://doi.org/10.1073/pnas.1103352108.
(2) Jaisson, S.; Pietrement, C.; Gillery, P. Carbamylation-Derived Products: Bioactive
Compounds and Potential Biomarkers in Chronic Renal Failure and Atherosclerosis. Clin. Chem. 2011, 57 (11), 1499–1505. https://doi.org/10.1373/clinchem.2011.163188.
(3) Wang, Z.; Nicholls, S. J.; Rodriguez, E. R.; Kummu, O.; Hörkkö, S.; Barnard, J.; Reynolds, W. F.; Topol, E. J.; DiDonato, J. A.; Hazen, S. L. Protein Carbamylation Links Inflammation, Smoking, Uremia and Atherogenesis. Nat. Med. 2007, 13 (10), 1176–1184. https://doi.org/10.1038/nm1637.
(4) Mydel, P.; Wang, Z.; Brisslert, M.; Hellvard, A.; Dahlberg, L. E.; Hazen, S. L.; Bokarewa, M. Carbamylation-Dependent Activation of T Cells: A Novel Mechanism in the Pathogenesis of Autoimmune Arthritis. J. Immunol. 2010, ji_1000075.
https://doi.org/10.4049/jimmunol.1000075.
(5) Verbrugge, F. H.; Tang, W. H. W.; Hazen, S. L. Protein Carbamylation and
Cardiovascular Disease. Kidney Int. 2015, 88 (3), 474–478. https://doi.org/10.1038/ki.2015.166. (6) Karlsson, D.; Dalene, M.; Skarping, G.; Marand, Å. Determination of Isocyanic Acid in Air. J. Environ. Monit. 2001, 3 (4), 432–436. https://doi.org/10.1039/B103476F.
(7) Sennbro, C. J.; Lindh, C. H.; Östin, A.; Welinder, H.; Jönsson, B. a. G.; Tinnerberg, H. A Survey of Airborne Isocyanate Exposure in 13 Swedish Polyurethane Industries. Ann. Occup.
Hyg. 2004, 48 (5), 405–414. https://doi.org/10.1093/annhyg/meh034.
(8) Westberg, H.; Löfstedt, H.; Seldén, A.; Lilja, B.-G.; Nayström, P. Exposure to Low Molecular Weight Isocyanates and Formaldehyde in Foundries Using Hot Box Core Binders.
Ann. Occup. Hyg. 2005, 49 (8), 719–725. https://doi.org/10.1093/annhyg/mei040.
(9) Brady, J. M.; Crisp, T. A.; Collier, S.; Kuwayama, T.; Forestieri, S. D.; Perraud, V.; Zhang, Q.; Kleeman, M. J.; Cappa, C. D.; Bertram, T. H. Real-Time Emission Factor
Measurements of Isocyanic Acid from Light Duty Gasoline Vehicles. Environ. Sci. Technol. 2014, 48 (19), 11405–11412. https://doi.org/10.1021/es504354p.
(10) Wentzell, J. J. B.; Liggio, J.; Li, S.-M.; Vlasenko, A.; Staebler, R.; Lu, G.; Poitras, M.-J.; Chan, T.; Brook, J. R. Measurements of Gas Phase Acids in Diesel Exhaust: A Relevant Source of HNCO? Environ. Sci. Technol. 2013, 47 (14), 7663–7671. https://doi.org/10.1021/es401127j.
29
(11) Borduas, N.; Abbatt, J. P. D.; Murphy, J. G. Gas Phase Oxidation of Monoethanolamine (MEA) with OH Radical and Ozone: Kinetics, Products, and Particles. Environ. Sci. Technol. 2013, 47 (12), 6377–6383. https://doi.org/10.1021/es401282j.
(12) Roberts, J. M.; Veres, P. R.; VandenBoer, T. C.; Warneke, C.; Graus, M.; Williams, E. J.; Lefer, B.; Brock, C. A.; Bahreini, R.; Öztürk, F. New Insights into Atmospheric Sources and Sinks of Isocyanic Acid, HNCO, from Recent Urban and Regional Observations. J. Geophys.
Res. Atmospheres 2014, 119 (2), 1060–1072.
(13) Woodward-Massey, R.; Taha, Y. M.; Moussa, S. G.; Osthoff, H. D. Comparison of Negative-Ion Proton-Transfer with Iodide Ion Chemical Ionization Mass Spectrometry for Quantification of Isocyanic Acid in Ambient Air. Atmos. Environ. 2014, 98, 693–703. https://doi.org/10.1016/j.atmosenv.2014.09.014.
(14) Zhao, R.; Lee, A. K. Y.; Wentzell, J. J. B.; Mcdonald, A. M.; Toom-Sauntry, D.; Leaitch, W. R.; Modini, R. L.; Corrigan, A. L.; Russell, L. M.; Noone, K. J.; et al. Cloud Partitioning of Isocyanic Acid (HNCO) and Evidence of Secondary Source of HNCO in Ambient Air. Geophys.
Res. Lett. 2014, 41 (19), 6962–6969. https://doi.org/10.1002/2014GL061112.
(15) Karl, M.; Svendby, T.; Walker, S.-E.; Velken, A. S.; Castell, N.; Solberg, S. Modelling Atmospheric Oxidation of 2-Aminoethanol (MEA) Emitted from Post-Combustion Capture Using WRF–Chem. Sci. Total Environ. 2015, 527–528, 185–202.
https://doi.org/10.1016/j.scitotenv.2015.04.108.
(16) Sarkar, C.; Sinha, V.; Kumar, V.; Rupakheti, M.; Panday, A.; Mahata, K. S.; Rupakheti, D.; Kathayat, B.; Lawrence, M. G. Overview of VOC Emissions and Chemistry from PTR-TOF-MS Measurements during the SusKat-ABC Campaign: High Acetaldehyde, Isoprene and
Isocyanic Acid in Wintertime Air of the Kathmandu Valley. Atmospheric Chem. Phys. 2016, 16 (6), 3979–4003. https://doi.org/https://doi.org/10.5194/acp-16-3979-2016.
(17) Heeb, N. V.; Zimmerli, Y.; Czerwinski, J.; Schmid, P.; Zennegg, M.; Haag, R.; Seiler, C.; Wichser, A.; Ulrich, A.; Honegger, P.; et al. Reactive Nitrogen Compounds (RNCs) in Exhaust of Advanced PM–NOx Abatement Technologies for Future Diesel Applications. Atmos. Environ. 2011, 45 (18), 3203–3209. https://doi.org/10.1016/j.atmosenv.2011.02.013.
(18) Correia, A. W.; Pope, C. A.; Dockery, D. W.; Wang, Y.; Ezzati, M.; Dominici, F. The Effect of Air Pollution Control on Life Expectancy in the United States: An Analysis of 545 US Counties for the Period 2000 to 2007. Epidemiol. Camb. Mass 2013, 24 (1), 23–31.
https://doi.org/10.1097/EDE.0b013e3182770237.
(19) Robinson, A. L.; Donahue, N. M.; Shrivastava, M. K.; Weitkamp, E. A.; Sage, A. M.; Grieshop, A. P.; Lane, T. E.; Pierce, J. R.; Pandis, S. N. Rethinking Organic Aerosols:
30
Semivolatile Emissions and Photochemical Aging. Science 2007, 315 (5816), 1259–1262. https://doi.org/10.1126/science.1133061.
(20) Quillen, K.; Bennett, M.; Volckens, J.; Stanglmaier, R. H. Characterization of Particulate Matter Emissions From a Four-Stroke, Lean-Burn, Natural Gas Engine. J. Eng. Gas Turbines
Power 2008, 130 (5), 52807-052807–5. https://doi.org/10.1115/1.2906218.
(21) Kang, E.; Root, M. J.; Toohey, D. W.; Brune, W. H. Introducing the Concept of Potential Aerosol Mass (PAM). Atmos Chem Phys 2007, 7 (22), 5727–5744. https://doi.org/10.5194/acp-7-5727-2007.
(22) Lambe, A. T.; Ahern, A. T.; Williams, L. R.; Slowik, J. G.; Wong, J. P. S.; Abbatt, J. P. D.; Brune, W. H.; Ng, N. L.; Wright, J. P.; Croasdale, D. R.; et al. Characterization of Aerosol Photooxidation Flow Reactors: Heterogeneous Oxidation, Secondary Organic Aerosol Formation and Cloud Condensation Nuclei Activity Measurements. Atmospheric Meas. Tech. 2011, 4 (3), 445–461. https://doi.org/https://doi.org/10.5194/amt-4-445-2011.
(23) Ortega, A. M.; Day, D. A.; Cubison, M. J.; Brune, W. H.; Bon, D.; de Gouw, J. A.; Jimenez, J. L. Secondary Organic Aerosol Formation and Primary Organic Aerosol Oxidation from Biomass-Burning Smoke in a Flow Reactor during FLAME-3. Atmospheric Chem. Phys. 2013, 13 (22), 11551–11571.
(24) Li, R.; Palm, B. B.; Ortega, A. M.; Hlywiak, J.; Hu, W.; Peng, Z.; Day, D. A.; Knote, C.; Brune, W. H.; de Gouw, J. A.; et al. Modeling the Radical Chemistry in an Oxidation Flow Reactor: Radical Formation and Recycling, Sensitivities, and the OH Exposure Estimation Equation. J. Phys. Chem. A 2015, 119 (19), 4418–4432. https://doi.org/10.1021/jp509534k. (25) Peng, Z.; Day, D. A.; Stark, H.; Li, R.; Lee-Taylor, J.; Palm, B. B.; Brune, W. H.; Jimenez, J. L. HOx Radical Chemistry in Oxidation Flow Reactors with Low-Pressure Mercury Lamps Systematically Examined by Modeling. Atmos Meas Tech 2015, 8 (11), 4863–4890. https://doi.org/10.5194/amt-8-4863-2015.
(26) Mao, J.; Ren, X.; Brune, W. H.; Olson, J. R.; Crawford, J. H.; Fried, A.; Huey, L. G.; Cohen, R. C.; Heikes, B.; Singh, H. B.; et al. Airborne Measurement of OH Reactivity during INTEX-B. Atmos Chem Phys 2009, 9 (1), 163–173. https://doi.org/10.5194/acp-9-163-2009. (27) Veres, P.; Roberts, J. M.; Warneke, C.; Welsh-Bon, D.; Zahniser, M.; Herndon, S.; Fall, R.; de Gouw, J. Development of Negative-Ion Proton-Transfer Chemical-Ionization Mass Spectrometry (NI-PT-CIMS) for the Measurement of Gas-Phase Organic Acids in the Atmosphere. Int. J. Mass Spectrom. 2008, 274 (1–3), 48–55.
(28) Roberts, J. M.; Veres, P.; Warneke, C.; Neuman, J. A.; Washenfelder, R. A.; Brown, S. S.; Baasandorj, M.; Burkholder, J. B.; Burling, I. R.; Johnson, T. J.; et al. Measurement of HONO, HNCO, and Other Inorganic Acids by Negative-Ion Proton-Transfer
Chemical-31
Ionization Mass Spectrometry (NI-PT-CIMS): Application to Biomass Burning Emissions.
Atmospheric Meas. Tech. 2010, 3 (4), 981–990. https://doi.org/10.5194/amt-3-981-2010.
(29) Brophy, P.; Farmer, D. K. A Switchable Reagent Ion High Resolution Time-of-Flight Chemical Ionization Mass Spectrometer for Real-Time Measurement of Gas Phase Oxidized Species: Characterization from the 2013 Southern Oxidant and Aerosol Study. Atmos Meas Tech 2015, 8 (7), 2945–2959. https://doi.org/10.5194/amt-8-2945-2015.
(30) Veres, P. R.; Roberts, J. M. Development of a Photochemical Source for the Production and Calibration of Acyl Peroxynitrate Compounds. Atmospheric Meas. Tech. 2015, 8 (5), 2225– 2231. https://doi.org/https://doi.org/10.5194/amt-8-2225-2015.
(31) Gordon, T. D.; Presto, A. A.; Nguyen, N. T.; Robertson, W. H.; Na, K.; Sahay, K. N.; Zhang, M.; Maddox, C.; Rieger, P.; Chattopadhyay, S.; et al. Secondary Organic Aerosol
Production from Diesel Vehicle Exhaust: Impact of Aftertreatment, Fuel Chemistry and Driving Cycle. Atmospheric Chem. Phys. 2014, 14 (9), 4643–4659.
https://doi.org/https://doi.org/10.5194/acp-14-4643-2014.
(32) Chin, J.-Y.; Batterman, S. A.; Northrop, W. F.; Bohac, S. V.; Assanis, D. N. Gaseous and Particulate Emissions from Diesel Engines at Idle and under Load: Comparison of Biodiesel Blend and Ultralow Sulfur Diesel Fuels. Energy Fuels 2012, 26 (11), 6737–6748.
https://doi.org/10.1021/ef300421h.
(33) Drenth, A. C.; Olsen, D. B.; Cabot, P. E.; Johnson, J. J. Compression Ignition Engine Performance and Emission Evaluation of Industrial Oilseed Biofuel Feedstocks Camelina, Carinata, and Pennycress across Three Fuel Pathways. Fuel 2014, 136, 143–155.
https://doi.org/10.1016/j.fuel.2014.07.048.
(34) Karjalainen, P.; Timonen, H.; Saukko, E.; Kuuluvainen, H.; Saarikoski, S.; Aakko-Saksa, P.; Murtonen, T.; Dal Maso, M.; Ahlberg, E.; Svenningsson, B.; et al. Time-Resolved
Characterization of Primary and Secondary Particle Emissions of a Modern Gasoline Passenger Car. Atmos Chem Phys Discuss 2015, 15 (22), 33253–33282. https://doi.org/10.5194/acpd-15-33253-2015.
(35) Kröcher, O.; Elsener, M.; Koebel, M. An Ammonia and Isocyanic Acid Measuring Method for Soot Containing Exhaust Gases. Anal. Chim. Acta 2005, 537 (1), 393–400. https://doi.org/10.1016/j.aca.2004.12.082.
(36) Varatharajan, K.; Cheralathan, M. Influence of Fuel Properties and Composition on NOx Emissions from Biodiesel Powered Diesel Engines: A Review. Renew. Sustain. Energy Rev. 2012, 16 (6), 3702–3710. https://doi.org/10.1016/j.rser.2012.03.056.
32
(37) Lapuerta, M.; Armas, O.; Rodríguez-Fernández, J. Effect of Biodiesel Fuels on Diesel Engine Emissions. Prog. Energy Combust. Sci. 2008, 34 (2), 198–223.
https://doi.org/10.1016/j.pecs.2007.07.001.
(38) California Environmental Protection Agency Air Resources Board. Almanac Emission Projection Data: 2015 Estimated Annual Average Emissions. 2013.
(39) Young, P. J.; Emmons, L. K.; Roberts, J. M.; Lamarque, J.-F.; Wiedinmyer, C.; Veres, P.; VandenBoer, T. C. Isocyanic Acid in a Global Chemistry Transport Model: Tropospheric
Distribution, Budget, and Identification of Regions with Potential Health Impacts. J. Geophys.
Res. Atmospheres 2012, 117 (D10). https://doi.org/10.1029/2011JD017393.
(40) Barnes, I.; Solignac, G.; Mellouki, A.; Becker, K. H. Aspects of the Atmospheric Chemistry of Amides. ChemPhysChem 2010, 11 (18), 3844–3857.