Paper to be presented at the IECER Conference, Regensburg, February 2004
TRACING PATTERNS OF GROWTH – AN ANALYSIS OF
THE „GRÖNA KVISTEN‟ HIGH-GROWTH VENTURES
LEONA ACHTENHAGEN, JENNY HELIN, LEIF MELIN, and LUCIA NALDI
SWEDEN
Introduction
Currently, many countries are facing problems with their unemployment rates and, partly in result, with the financing of their social welfare systems. In consequence, many governments attempt to foster entrepreneurship, with the aim to facilitate job creation by new and growing ventures (e.g. Wiklund, 1998: 1). Due to the high growth potential attributed to them, especially (high) technology-based ventures seem to be in focus (e.g. Keeble & Wilkinson, 2000: 1).
The political and societal importance given to growth is mirrored in many academic studies investigating determinants driving or limiting venture growth. These studies vary in their degree of comprehensiveness – from those testing the impact of just one or several isolated factors on growth to more comprehensive multilevel models of growth, which also take into consideration indirect influences of factors (e.g. Baum et al., 2001). A whole range of internal and external factors are tested for their effects on growth (Barth, 2001). The internal factors studied are mainly personal factors (such as motivation of entrepreneurs or competencies) and organizational factors (such as competitive strategies, resource bases or training). The external factors studied are mainly micro and macro
environmental factors, such as industry, external stakeholder influence, or economic trends. Also, a number of studies focus on the phenomenon that most companies do not grow (Barth, 2001; Henrekson, 2001; Wiklund, Davidsson & Delmar, 2001). Companies might not want to grow, or there might be circumstances hindering growth and these growth hurdles might be too difficult to overcome. These hurdles might derive either from the environment in which the firm operates or attributed to firm-specific internal factors (Barth, 2001; Penrose, 1959; Wiklund et al., 2001).
In her seminal study, Penrose characterizes the phenomenon of growth as follows (1995/1959: 1): “The term „growth‟ is used in ordinary discourse with two different connotations. It sometimes denotes merely increase in amount; for example, when one speaks of „growth‟ in output, export, sales. At other times, however, it is used in its primary meaning implying an increase in size or improvement in quality as a result of a
process of development, akin to natural biological processes in which an
interacting series of internal changes leads to increases in size accompanied by changes in the characteristics of the growing object. Thus the terms „economic growth‟ and „economic development‟ are often used interchangeably where „growth‟ implies not only an increase in the national product but also a progressive changing of the economy. „Growth‟ in this second sense often also has the connotation of „natural‟ or „normal‟ – a process that will occur whenever conditions are favourable because of the nature of the „organism‟; size becomes a more or less incidental result of a continuous on-going or „unfolding‟ process.” She criticizes that in traditional economics growth would only be seen as an adjustment to the size appropriate to given conditions, while neglecting the internal processes leading to growth.
This inherent problem of many of the studies analyzing determinants of growth is largely due to their quantitative nature – for a quantitative study, data has to be assessed at one (or several) specific point of time and operationalized into variables. However, explanatory information for putting flesh on the bone created by this data is largely missing, and thus the emergence of, or the relationships between, the different determinants cannot be established. Yet, a number of the
determinants fostering or hindering growth are not stable over time – attitudes and motivation of founders/CEOs could for example change dramatically due to events in their private lives. Wiklund (1998: 87) discusses the difficulty of assessing growth determinants as follows: “(…) we really do not know how much variables change over the studied time period, and whether or not this is a major problem. Growth, as such, is a change process and it could be that explanatory variables change quite substantially during this process. Until we do know, it must remain an unwise oversimplification to assume that nothing else but size changes.”
While the existing body of largely quantitative studies on growth is undeniably important, we still remain with a very limited understanding of what actually happens in companies during their growth processes. We clearly need a better understanding of the processes and patterns of growth. The aim of our paper therefore is to trace different patterns of growth and to analyze these patterns of growth processes. The remainder of this paper is structured as follows: We will first review the body of literature discussing processes and patterns of growth. Building on our criticism of that literature, we will present our empirical study of 29 companies that have received a prize as fast-growing firms between 1993 and 1996. We will map, categorize and analyze the growth processes of these companies and thus contribute to filling the identified holes in the growth literature.
Processes and Patterns of Growth
Different bodies of literature exist which are concerned with the processes and patterns of growth (cf. discussion in Aldrich, 1999: 196-201). As pointed out by Van de Ven and Poole (1995), much of this growth literature is presented in the form of life-cycle or stage models (e.g. Greiner, 1972; Galbraith, 1982; Churchill & Lewis, 1983; Quinn & Cameron, 1983; Scott & Bruce, 1987; Kazanjian, 1988). Although the idea of sequential phases of growth has been questioned by different authors, these models continue to be predominant in the growth literature. A second body of literature discusses patterns of growth following a
configurational approach (Miller, 1986; Miller & Friesen, 1984; Wiklund 1998: 29). Here, attention is devoted to the emergence of configurations or „gestalts‟ of structures, processes and strategies, which do not necessarily follow a determined pattern during growth. These two bodies of literature will be reviewed below. The review of these bodies of literature allows for a critical discussion of the shortcomings inherent in the existing concepts of processes and patterns of growth and, thus, illustrates the need for the study presented in this paper.
Life-cycle and Stage Models
Many different authors have conceptualized organizational growth processes based on the metaphor of organizational development as a biological life-cycle (Van de Ven & Poole, 1995; Aldrich, 1999). It is assumed that organizational growth would occur in a sequence of stages: just like the body of human beings changes over time in a certain pattern, also organizational activities, systems, structures and leadership would evolve through different stages.
Concepts referring to this metaphor share certain (implicit or explicit) assumptions. First, the growth of firms is imminent, „that is the developing entity has within it an underlining form, logic, program or code […] that moves the entity from a given point of departure towards a subsequent and it is prefigured in the present state‟ (Van de Ven & Poole, 1995: 515). Expressed differently, what is elementary at the embryo stage becomes more and more obvious and realized in the following stages. A clear example of this can be found in Adizes‟ (1988) life-cycle model. Here, the progressive realization of the original business ideas is the imminent logic governing the development of the firm. The author argues, indeed, that all starts with the entrepreneur having an idea. In the initial state the idea is put into work, whereas the next stage comes about as soon as the idea is actually working in practice.
In addition, firms grow following a unidirectional and cumulative
sequence (Van de Ven & Poole, 1995). Growth is unidirectional as the
smaller to a bigger size. With very few exceptions (e.g. Garnsey, 1998), authors do not discuss periods of „ungrowth‟ or reversal of growth as an option for surviving firms. Furthermore, growth is cumulative as the characteristics acquired in previous stages are maintained and built on in later stages. An early model proposed by Greiner (1972), for example, attributes a key role to previous experience. Apparently following Erikson‟s (1963) stage model of human (psychosocial) development, Greiner (1972) argues that the behaviour of organizations (just like the behaviour of individuals) is determined by past events and experiences. In these terms, each stage is the progenitor of the following ones.
A number of models follow through the analogy between organizational development and the „seasons of a man‟s life‟ (Levinson, 1978) from birth to death and, therefore, are often referred to as life-cycle
models. Whetten‟s (1987) work on organizational growth and decline is
an example of this type of research, as well as Adizes‟s (1988) model which distinguishes between the growing and the aging sides of the life-cycle curve. Interestingly, a number of these life-life-cycle models, while discussing growth at the organizational level, implicitly maintain that these changes over the history of an organization would be the manifestation of a similar population-level phenomenon (O‟Rand & Krecker, 1990). Others, explicitly, test life-cycle processes in population-level studies of organizational mortality and/or foundings (Hannan & Freeman, 1987; Carroll & Delacroix, 1982). Here, the occurrence of Stinchcombe‟s (1965) concept of the „liability of newness‟ is often hypothesized. Freeman, Carroll and Hannan (1983), for instance, find empirical support for the assumption that new organizations are more likely to die than old organizations. At the same time, their results show that beside the liability of newness, also the liability of smallness concurs in explaining firms‟ rate of dissolution.
However, in the literature decline and death of organizations have received somewhat less attention than birth and early development (Neumair, 1998). The vast majority of biological models, indeed, focus mainly on the firm‟s development process up to the maturity stage. These have been referred to as stage or developmental models. The number of
stages and sub-stages identified by different scholars varies significantly (O‟Farrell & Hitchens, 1988). All models start with an initial stage which is typically characterized by a simple organizational structure, direct supervision, and particular importance is attributed to the founder or entrepreneur: e.g. Greiner‟s (1972) „creativity stage‟; Churchill and Lewis‟s (1983) „existence stage‟; Quinn and Cameron‟s (1983) „entrepreneurial stage‟; Kazanjian and Drazin‟s (1989) „conception and development stage‟, and Adizes‟s (1988) „infant stage‟. In the following stage, the firm achieves its initial product market success (Miller & Friesen, 1984). Here, a first division of managerial tasks occurs, but control is still achieved through personal supervision (O‟Farrell & Hitchens, 1988). This stage corresponds to Greiner‟s (1972) „direction stage‟, to Churchill and Lewis‟s (1983) „survival‟ and „success‟ stages, to Kazanjian and Drazin‟s (1989) „commercialization‟ stage; to Adizes‟s (1988) „go-go stage‟, and Garnsey‟s (1998) „resource generation‟ stage. The subsequent stages are characterized by an increased bureaucratization of the organizational structure and the separation between management and control: e.g. Churchill and Lewis‟s (1983) „resource maturity‟ and Quinn and Cameron‟s (1983)‟s „formalization and control stage‟.
Though the authors of different concepts try to differentiate their contributions by stressing one or several factors, a number of structural and contextual characteristics are generally included in life-cycle and stage models (cf. Quinn & Cameron, 1983). Common structural dimensions are: structural form, formalization, centralization, number of organizational levels. Age, size and growth rate are instead the contextual dimensions most commonly included (Hanks et al., 1994).
Table 1: Examples of life-cycle and stage models of organizational growth
Author(s) (year)
Stages Concept
category
Based on Transition between stages based on
Characteristics of the model
Greiner (1972) Creativity – Direction – Delegation – Coordination – Collaboration –
Stage model Conceptual Internal crises
(growth of organizations through a series of evolutions and revolutions due to crises of leadership, control and
coordination
- Unidirectional (partly deterministic) sequence - Growth imminent: „grow or fail‟ hypothesis, - But: recognition that growth is not linear and that in periods of crisis firms can „fall short‟
Quinn & Cameron (1983) Entrepreneurial – Collectivity – Formalization and control – Elaboration of structure –
Stage model One empirical case
External pressures, new sets of effective criteria and new dominant coalitions
- Unidirectional (partly deterministic) sequence - Cognitive issues and environmental factors: stage-specific criteria of organizational effectiveness are individuated and related with internal and external dynamics
Churchill & Lewis (1983) Existence – Survival – Success – Resource Maturity –
Stage model Conceptual Change or crisis - Multidirectional growth: a firm can remain indefinitely medium-sized, given that changes in the environment do not destroy its market niche
- Stage-specific strategies considered
Adizes (1983) Courtship – Infant – Go-Go – Adolescence – Prime – Stable – Aristocracy – Early Bureaucracy – Bureaucracy – Death– Life cycle model Conceptual, anecdotal
Up to the Adolescence stage by pursuing opportunities, thereafter by overcoming problems
- Unidirectional and partly deterministic sequence: up to the Stable phase „grow or fail‟ hypothesis.
Miller & Friesen (1984) Birth – Growth – Maturity – Revival – Decline – Configuration/ Life cycle model Empirical: histories of 36 companies reconstructed from published studies (e.g. books, articles) and retrospective interviews
Attempt to align to changes in the context of the company, by changing the structure,
strategy and decision-making styles
- Partly questions unidirectionality of life cycle models: empirical results do not provide conclusive evidence that organizations move through the stages in the same sequence - Results support the hypothesized existence of common configurations of environment, strategies, structure and decision making style within each stage
Smith et al. (1985) Inception – High growth – Maturity –
Stage model Empirical: simulation study and survey of 27 electronic manufacturing firms
No particular trigger for growth is specified; transition from one stage to the next leads to changes in management priorities
- Unidirectional and partly deterministic sequence: all organizations are in specific stages. e.g. “academicians… should
make…prescriptions contingent upon the life-cycle stage the focal companies are in” (p.817) - Focus: top management‟s priorities during each stage Kazanijan & Drazin (1989) Conception and Development – Commercialization– Growth – Stability – Stage model/ Configuration Empirical: longitudinal survey of 71 TBNVs
Each stage characterized by predominant problems
- Partly questions the unidirectionality of stage models: “the stage of growth perspective should not be regarded as a developmental imperative, but rather only as a „central tendency‟” (p. 1499).
- Predominant problems the firm faces in each stage influences the configuration of strategy, structure and leadership adopted
Hanks et al. (1993) Start-up– Expansion – Maturity – Diversification– Configuration/ Stage model Empirical: exploratory cluster analysis of a sample of 126 firms
Attempt to align changes in the context of the company and its structure
- Not necessarily unidirectional: “organizations may go through cycles of stagnation and or decline, they may skip stages or revert back to certain stages” (p. 23)
- Life-cycle stages are characterized in terms of “unique configurations of variables related to organization context and structure” (p. 7)
Gupta & Chin (1994)
Inception and early growth –
Late growth and maturity – Decline –
Configuration/ Life cycle model
Conceptual Managerial and organizational ability to adapt to
environmental changes
- Unidirectional and partly deterministic sequence: “organizations exhibit a unique and predictable set of characteristics in each stage of their organizational life” (p. 285)
- Attempt to combine life cycles with contingency and system theory: culture and norms among the contingency factors considered Garnsey (1998) Access resources – Mobilize resources– Growth reinforcement – Growth reversal – Accumulation – Maturity – Stage model/ Growth trajectories Conceptual (some empirical illustrations based on published studies, e.g. Chandler‟s study on General Motors)
The growth of the firm is related to its “problem-solving capacity, or competence to achieve and leverage in
accessing further resources and markets” (p. 547)
- Multidirectional growth: firms can follow diverse growth patterns
- Possible trajectories are suggested by the author
- Periods of growth reversal, which not necessarily lead to fail, are considered.
Beverland & Lockshin (2001) Pre-birth – Start up – Expansion – Growth –
Stage model Empirical: case studies of 20 New Zealand wineries
No particular trigger for growth is specified, but each stage is characterized by a dominant problem
- Unidirectional and partly deterministic sequences
- Important stage is the pre-birth stage, which is, according to the authors, often ignored in other models
The models can be differentiated regarding the assumed drivers for growth and triggers for transition between stages (see Table 1). Building upon Chandler‟s thesis that certain organizational structures are developed in response to growth or market problems, some authors see the unfolding of stages as following from the resolution of problematic situations or crises (Hacks et al., 1994). For example, Churchill and Lewis (1983) illustrate the passage from one stage to another in terms of different problems and challenges that need to be addressed, while Greiner (1972) sees the transition between stages as the response to internal crises. Other scholars stress the entrepreneurial nature of organizations and argue that stages are driven by the search for new growth opportunities. Eisenhardt et al. (1990), for instance, attribute particular importance to the founding top management team and to their ability to exploit and enhance resources, while McMahon (2001) sees the growth aspiration of SMEs as a key factor in characterizing their pathway. Smith and Miner (1983) even relate the likelihood of a firm to successfully pass through the initial stages of development to the opportunistic orientation of its founder/entrepreneur.
The concepts can also be differentiated along the assumed development path. Some scholars individuate only a one-way path and suggest that firms progress through certain, specific stages in sequential order (e.g. Greiner, 1972). Others consider also multiple paths (Adizes, 1988) or contemplate the case in which a firm does not follow the whole development trajectory but halts somewhere in between. Churchill and Lewis (1983), for instance, argue that a firm can remain indefinitely small or medium sized, given that changes in the environment do not destroy its market niche. McKelvie and Chandler (2002) explain this phenomenon with transaction costs economics.
The shortcomings of models using biological analogies to conceptualize firm growth have been emphasized by many authors. A clear and straightforward critique to these concepts is provided by Edith Penrose already in 1952. The author finds the attempt to associate firms
with biological organisms dangerous as an analogy and useless as a metaphor. The use of biological analogies in explaining firm growth would be „dangerous‟ as it implies a deterministic view on human actions and free will. As Penrose argues, “we have no reason what so ever for thinking that the growth pattern of a biological organism is willed by the organism itself. On the other hand, we have every reason for thinking that growth of a firm is willed by those who make the decisions […] Such decisions, to be sure, are constrained by the environment and by the capability of the men who make them, but we know of no general „laws‟ predetermining men‟s choices…” (Penrose, 1952: 808). She writes: “to abandon their [the firms‟] development to the laws of nature diverts attention from the importance of human decisions and motives, and from problems of ethics, and public policy, and surrounds the whole question of the growth of the firms with an aura of „naturalness‟ and even inevitability” (Penrose, 1952: 808).
While Penrose‟s critique refers mainly to the life-cycle concepts, Tornatzky et al. (1983: 19) question stage models by arguing that the concept of stage “is a distortion of reality”. In the authors‟ view, the assumption of stages is an intellectual tool which might be useful in simplifying the representation of complex processes, but which says very little about the underlying patterns of decisions and actions. For example, when categorizing entire organizations as belonging to a certain stage, research ignores that the reality of organizations is composed of individuals and small groups. “At any given time”, they write, “some parts are likely to be in early stages, other parts in later stages, and some parts may not be involved at all” (Tornatzky et al.; 1983: 25). Other critiques relate to the assumption of imminence of growth, which underlies life-cycle and stage models. O‟Farrell and Hitchens (1988), for instance, argue that there is no empirical evidence that firms either grow and pass through all the stages or else fail. In addition, O‟Farrell and Hitchens (1988) partly question the unidirectionality of the development process. They wonder whether the sequence of stages is unshirkable or whether, under certain conditions, certain stages could be missed out or their order inverted. Following Stubbart (1992), Melin (1992) points at
another problem of stage models, namely their fundamental disregard of individual differences.
Configuration or „Gestalt‟ Models of Firm Growth
As demonstrated with the above critique, the concepts of stages or phases of growth are not universally accepted in the literature. In an attempt to overcome the shortcomings of assuming a simple linear and sequential logic of firm growth, as inherent in life-cycle and stage models, some scholars have developed complex contingency models, also known as gestalt or configuration models of firm growth (Kazanjian & Drazin, 1989). Miller and Friesen (1984) can be considered the precursors of this view. After an extensive review of the literature on life-cycle and stage models, these authors identify five common stages (birth, growth, maturity, revival, and decline), each of which presents integral complementarities among variables of environment, strategy, structure and decision-making modes. Empirically, Miller and Friesen (1984) find support for the prevalence of certain complementarities between these factors within each stage, but not across stages, in a linear sequence. The authors comment that “while the stages of the life cycles are internally coherent and very different one another, they are by no means connected to each other in a deterministic way” (Miller & Friesen, 1984: 1490). Thus, the passage from one configuration to another would not follow any predetermined path. They even suggest that a maturity phase might be followed by decline and then growth again. However, although Miller and Friesen (1984:1177) attempt to emphasize how “the latitude for strategic choice may be considerable” and how there would be innumerable developmental paths, this recommendation has been largely unattended for by scholars following the configuration or gestalt view.
Configuration or gestalt models have developed in two directions. First, by clustering firms according to demographic characteristics such as their age, size or growth figures, researchers have identified different configurations or gestalts, each assumed to represent a different stage of the firm‟s development path (Hanks et al. 1993; McMahon, 2001). Thus, here, organizations are empirically categorized into a number of
configurations or gestalts. In contradiction to Miller and Friesen‟s (1984) recommendation, these configurations are conceptually ranked to, at least partly, conform to the sequence of stages inherent in life-cycle models (McKelvie & Chandler, 2002). For instance, Hanks et al. (1993) use cluster analysis to derive a taxonomy of growth-stage configurations in a sample of high-technology organizations, and McKelvie and Chandler (2002) provide a similar investigation on a sample of Swedish start-ups. Second, the configuration approach suggested by Miller and Friesen (1984) has also resulted in another type of models, which openly depart from the life-cycle analogy. Wiklund (1998), for instance, acknowledges that life-cycle models could be applicable only to the few firms that actually grow significantly. Therefore, instead of trying to force firms into one common developmental path, the author focuses on the combination of individual, organizational and environmental characteristics to better predict future growth. Wiklund (1998) provides a complex multilevel model that follows ventures‟ development at different points in time.
But even configuration or gestalt models are not immune to criticism. Taxonomies of configurations, empirically derived and suggestive of life-cycle stages, still share most of the shortcomings inherent in stage models. For example, they display a deterministic view on firm growth and they lack attention to the variations in venture development. In addition, most of these studies are cross-sectional and thus only presuppose the temporal link between the different configurations or gestalts.
Related to this discussion, we should also mention the practitioner-oriented literature of „how to grow‟ guides. The idea of an organizational life-cycle is taken for granted in most of these publications: “I discovered more and more similarities between the development of firms and human beings. Thus, just like human beings the firm has its own life ladder” (Ek, 1997: 15; see also Ahrens, 1996; Baghai et al., 1999). The contributions clearly are of practical relevance, as they can make management aware of „typical‟ managerial issues and crises. Yet, it can also be considered somewhat dangerous if managers are made believe that specific
managerial actions will provide a secure cure to their problems. For the purpose of this paper, this literature is less relevant as it contributes little to our theoretical understanding of patterns of growth.
The Empirical Study
The empirical basis for our study consists of those companies, which received the prize „Gröna Kvisten‟ (Swedish for „the green twig‟). „Gröna Kvisten‟ was a prestigious prize handed out during a Swedish TV programme by a qualified jury to profitable high-growth SMEs in the years 1993 to 1996. Gröna Kvisten was initiated by Claas Dinkelspiel, a well-reputated Swedish entrepreneur, together with Magnus Briggert, a journalist and host of a TV program called „Stora Pengar‟ (Swedish for „Big Money‟) on channel TV4 in Sweden. Besides TV4, the Gröna Kvisten jury involved Dagens Industri, the most important Swedish daily business newspaper, and a board of directors containing people from business, academia and entrepreneurship.
The purpose of Gröna Kvisten was to stimulate entrepreneurship in Sweden by enhancing the visibility of successful entrepreneurs in media, thereby creating role models. During the time of Gröna Kvisten, 1993 to 1996, a total of 29 companies received the prize. Growth companies were short-listed for the prize based on the following criteria: 1) The company needed to be a Swedish, entrepreneurially-oriented company, and 2) had earned a return on capital employed (ROCE) higher than the capital market rate over the previous three years. In a second step, the jury attributed points to the short-listed companies based on more qualitative criteria, such as their environmental profile, market planning, technological development, as well as management and investment strategies.
Only one of the 29 companies no longer exists, as it has gone bankrupt. Our sample consists of the surviving 28 companies that have received the Gröna Kvisten prize. Thus, all companies in our sample share a number of characteristics: They are all Swedish companies, they have displayed a longer period of high profitability and growth in the
early 1990s, and they were entrepreneurially oriented at least then. These characteristics make the companies well-comparable, even though they represent a range of different industries and ownership structures. As growth is such a societal and political „hot topic‟, this sample also gives us the chance to follow up companies that have displayed high growth some years ago, to help us investigate the phenomenon of continuous growth. This in itself can be graded as an important contribution, as many studies on growth are mainly snapshots of either young companies or based on data from a shorter time period. Studies of companies in different maturity phases and over a longer time period have long been requested (Miller & Friesen, 1984). Unlike many other studies, we are not interested in only young companies, but in entrepreneurially-oriented companies, arguing that entrepreneurship literature might be too restrictive when discussing mainly young companies.
The data for this study has been collected from members of the Gröna Kvisten jury, annual reports, company information such as web pages and publications about the firms, as well as telephone interviews. We have grouped the 28 companies into four categories on the basis of the firms‟ growth figures of the years 1993, 2000, 2001 and 2002. Each category displays a different pattern of growth shared by all companies in that category. It is important to note that the list of these categories is not exhaustive – many other patterns might exist. Yet, this categorization helps us to point out three things. First, given the detailed focus on three subsequent years, it provides a micro perspective on the firms‟ growth patterns. Life-cycle and stage models present a macro and shorthand illustration of firm development, but say very little about the underlying micro patterns of growth which unfold when looking at shorter time spans. As pointed out by Tornatzky et al. (1983: 19) such a macro representation “is a distortion of reality”. Second, unlike suggested by many stage models, this categorization shows that different successful patterns of growth might exist, at least when considering micro patterns. Third, we illustrate that the interpretation of these patterns without further qualitative information about the company might be misleading.
To discriminate between the different categories, we have employed patterns of sales growth for different reasons: Many empirical studies in the field base their definition of growth on the increase in sales (e.g. McMahon, 2001). Wiklund (1998: 69-70) states that “growth is a process in changing size. It is possible to use different indicators for the growth of a firm. A growth process is likely to be driven by an increased demand for the products or services that the firm supplies to the market. (…) It seems unlikely that growth could take place in another dimension without increasing sales”. Hoy et al. (1992) claim that a consensus has been reached among academics that sales or revenue growth would be the best growth measure. We base our study on sales growth, as the use of revenue growth as a growth measure seemed unwise due to changes in the Swedish accounting system during the investigated period. An alternative would have been the increase of number of employees as a growth measure. The increase of number of employees has indeed been used in a number of studies. Yet, the measure of numbers of employees is problematic, as Wiklund states (1998: 70): “In a process of rationalisation, it is possible to replace employees with capital investments. If this is done, a company may increase sales, but decrease employment. In other words, there is to some extent, an inverse relationship between capital investment and employment growth”. As a whole, the Gröna Kvisten companies show an increase in total numbers of employees of over 5600 people over the studied period, which is an interesting evidence of the continuing growth orientation of these SMEs also after they received the prize.
As the categories presented below are formed merely based on sales figures and cover rather short periods of time, they are admittedly reductionistic. However, for the purpose of this paper it seemed important to choose a manner of representing the companies in similar fashion as many articles on organizational growth have done before (e.g. McKelvie/Chandler, 2002). In addition, the more detailed focus on the patterns emerging during three subsequent years allows for a more micro and accurate perspective, which is missing when merely looking at the unfolding of long-term stages. This procedure will help us to illustrate the need for more detailed studies of organizational growth processes, as the
mere representation of each category can mislead the interpretation if not complemented with background information. In the following, we will present the identified patterns of growth. We will illustrate each pattern by one or two selected case vignettes of the Gröna Kvisten companies.
Identified Patterns of Growth
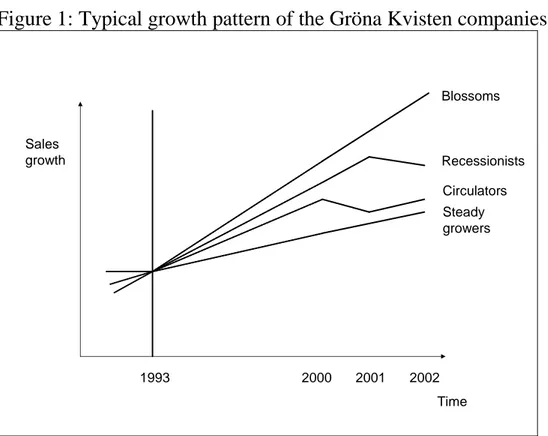
Among the Gröna Kvisten companies, we could identify four typical patterns of growth. We named these the „steady growers‟, the „blossoms‟, as well as the „circulators‟ and „recessionists‟. Figure 1 provides an idealized representation of the four patters: The patterns of „blossoms‟ depicts continuous, rather high growth. „Recessionists‟ have grown continuously until 2001 or 2002, in which their luck turned. Still, since 1993 these companies have mainly shown rather impressive overall growth. The pattern of the „circulators‟ is somewhat more diverse, as these companies display ups and downs in their sales figures. Overall, some of these companies have grown since 1993, while others have reduced in sales. The last pattern is that of the „steady growers‟. These companies have also achieved continuous growth over the studied period, but substantially lower than the „blossoms‟. We will discuss each of these typical patterns in the following. To provide a better understanding of the presented data, we will also present case vignettes of selected companies from the sample.
Figure 1: Typical growth pattern of the Gröna Kvisten companies Sales growth Time 1993 2000 2001 2002 Blossoms Steady growers Recessionists Circulators Source: authors
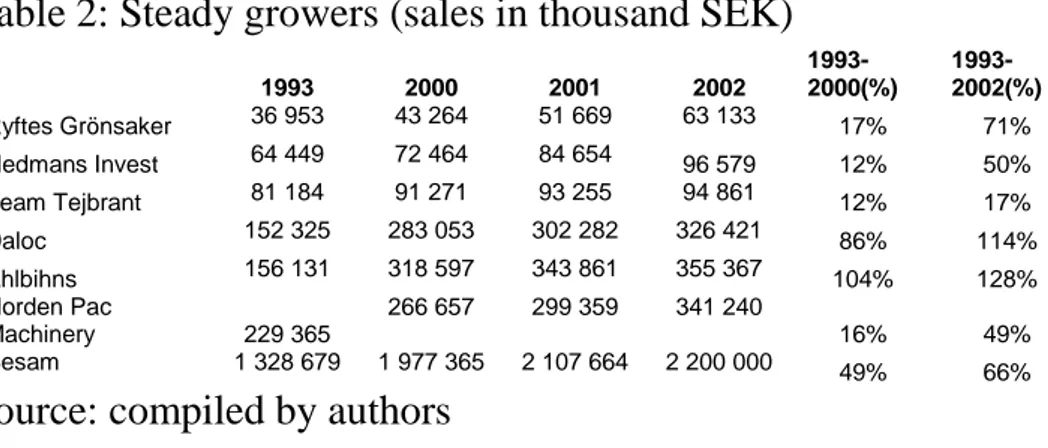
The ‘steady growers’: These companies display a pattern of
continuous growth over the entire period under investigation, that is for 1993, as well as for 2000, 2001, and 2002. In the year 2000, a severe recession hit Sweden. Nevertheless, these companies have continued to grow. This sustained growth suggests that these firms might be very „healthy‟. Seven out of 28 companies fall into this category. They are from very different industries (groceries, packaging machines, doors, consulting, clothing) and have different ownership structures. However, all these companies are focusing on niches. Over the period 1993-2002, these firms have grown in sales between 17% and 128%. The more detailed table in the appendix demonstrates that those companies run by family members are more locally oriented than the ones with different ownership structures. The companies have been founded between 1891 and 1982, and can thus be considered established.
Table 2: Steady growers (sales in thousand SEK) 1993 2000 2001 2002 1993-2000(%) 1993-2002(%) Ryftes Grönsaker 36 953 43 264 51 669 63 133 17% 71% Hedmans Invest 64 449 72 464 84 654 96 579 12% 50% Team Tejbrant 81 184 91 271 93 255 94 861 12% 17% Daloc 152 325 283 053 302 282 326 421 86% 114% Ahlbihns 156 131 318 597 343 861 355 367 104% 128% Norden Pac Machinery 229 365 266 657 299 359 341 240 16% 49% Besam 1 328 679 1 977 365 2 107 664 2 200 000 49% 66%
Source: compiled by authors
Case vignette: Daloc
Daloc is the largest company in the Nordic countries to offer doors in wood and steel. The CEO of the company is Inga-Lisa Johansson. She took over the business from her father (who founded the company in 1942) when she was 25 years old. She and her family are the current owners. When Inga-Lisa took over Daloc in 1970, the company had 10% market share in Sweden. Some important changes have been introduced since that. Previously, they sold to wholesalers, leading to a lack of communication with end-consumers. Thus, they changed the distribution and selling structure. Today, Daloc is communicating directly with more than 7.000 architects and construction workers. Inga-Lisa Johansson explains their focus: “We are satisfying people‟s needs in terms of protection against fire, war and burglary. This is an increasing need, especially when it comes to burglary” (Söderhjelm & Larsson, 1998:113). Daloc focuses on design and security of doors, which apparently is appreciated by the consumers. The company was the first in the market to take in designers to develop their doors. Daloc became the market leader during the recession in Sweden in the early 1990s. According to Inga-Lisa Johansson this can be attributed to the continuous focus on sales: “We had a different strategy than our competitors, and we made sure to take home the orders” (Söderhjelm & Larsson, 1998:114). She views profit maximization as the main goal for the company, as profit is the base for a solid, surviving company that can develop over time. Johansson also finds that profit provides stimulation for work. In 1995, the CEO not only was awarded the Gröna Kvisten prize, but also the Veuve Clicquot award as the female entrepreneur of the year, as well as
the gold medal of the Royal Patriotic Society. In 2002, Johansson was selected Swedish entrepreneur of the year.
‘Blossoms’: The next category is that of the „blossoms‟. This
category is very similar to the „steady growers‟, but displays higher levels of continuous growth. Thus, this category shows growth over all points in time studied, and total growth varies between 264 and 1207% between 1993 and 2002. Seven out of 28 companies were placed in this group. A number of the „blossoms‟ have grown by acquisition, however, others have managed this growth organically (for example Baby Björn). The „blossom‟ companies are somewhat younger than the „steady growers‟, but even here the youngest one was founded in 1981. Thus, their pattern of rather high growth clearly suggests that growth orientation is not limited to young ventures, and that growth orientation can change over time. All of these companies are active on international markets (cf. table in the appendix). Even though some of the firms are listed on the stock exchange or are private companies, a total of six out of seven are run by family members (3 companies) of the founder or by the founder her/himself (3 companies).
Table 3: Blossoms (sales in thousand SEK)
1993 2000 2001 2002 1993-2000(%) 1993-2002(%) Baby-Björn 18 173 180 603 226 272 237 467 894% 1207% Kriss 32 502 109 268 112 743 118 259 236% 264% Rubore 68 415 307 453 356 076 421 773 349% 516% Etac 124 922 411 717 491 870 531 889 230% 326% Polarrenen 175 362 481 749 1 045 402 1 145 688 175% 553% HL Display 181 186 873 921 1 071 934 1 154 407 382% 537% Elekta 506 195 2 160 000 2 738 000 2 781 000 327% 449%
Source: compiled by authors
An interesting case in this category is Etac. The founder of Etac sold the company, which manufactures products for disabled people, and started a similar company as a competitor to Etac. This case suggests the need to study individual entrepreneurs and their activities, and not only the firm-level.
Case vignette: Polarrenen
Polarrenen is a Swedish, family-owned company in the baking industry. The company was formally founded, but has roots that go 100 years back in time. The company started as a producer of traditional Northern-Swedish bread. This focus has been maintained. Today, Polarrenen is the third largest producer of bread in Sweden with 14% market share, baking 29 000 tons of bread (as of 2002). In an otherwise shrinking industry, Polarrenen has managed to increase their sales and profitability. Much of the growth derives from acquisitions of other companies in combination, as well as export. In 1997, they bought “Gene”, at that time the largest competitor in the field. “For the Northern baking culture to be able to compete against the big Swedish and international players, coordination is needed”, says Kjell Jonsson, CEO in the company (TT, August 8th, 1997). In 1999, the company made another important acquisition when they bought 51% of Allbröd, which coordinates the bread sales for 21 independent companies. This acquisition secured the company‟s future distribution and coverage of the whole country. The company started relatively late to export. In 2002, exports increased by 60 percent. Important export markets are Norway, Finland and Spain. The company is still located with both head office and production in the depopulated area of Northern Sweden. All employees hold a minority of shares in the company, and they can use 300 hours per year for their individual development. While Polarrenen‟s growth pattern looks impressive, it should be noted that a large percentage of the increase in sales between 2000 and 2001 is not due to the increase of bread sales. Rather, the company engaged into the trading of financial market papers.
Circulators: These companies have displayed more unstable
patterns of growth (and ungrowth) over time, and might even have decreased in sales since 1993. However, they are still alive and kicking even though a number of authors have claimed that firms which do not grow are doomed to fail. Those firms that achieve an acceptable return and avoid further growth to remain in a relative „comfort zone‟ have been called „lifestyle‟ companies – companies that afford their founders‟ enough revenues without the hazard of further growth. These lifestyle
companies have been argued to put in jeopardy their existence, as the level of resources to buffer instability in supplies or demand could quickly exhaust the company‟s resources (e.g. Garnsey, 1998: 538). In our sample, six companies belong to this category of circulators. The companies in this category vary between a reduction in sales by 85% between 1993 and 2002 and an increase in sales of 458% in the same period.
Table 4: Circulators, sales in thousand SEK
1993 2000 2001 2002 1993-2000(%) 1993-2002(%) Kastman & Co 22 489 9 760 9 932 3 321 -57% -85% Ingelstad Kalkon 28 613 95 171 109 378 104 104 233% 264% Innovativ Vision 33 846 31 330 42 680 25 618 -7% -24% Hästens Sängar 59 969 313 861 291 336 334 426 423% 458% Berte Qvarn 78 076 56 649 64 534 68 828 -27% -12% Hudson RCI 160 079 124 930 207 763 254 623 -22% 59%
Source: compiled by authors
The company Kastman & Co is run by the wife of the former CEO, who has retired. As she is now also retiring, she runs the business of importing clothes only on a part-time basis. Below, we present two case vignettes. Berte Qvarn is a company that does not look very successful when considering sales data. However, the family members managing the company created a number of other companies, which now form the Bertegruppen. Thus, just regarding this one company might distort the evaluation of a successful family business. Hästens Sängar is the second case presented. Hästens displayed a continuous growth pattern except for one year, namely 2001. Interestingly, this was the year in which the company recruited a growth manager to focus on expansion. As in the category above, these companies illustrate that a long company history does not necessarily mean slow growth or even decline. These companies also show very clearly that growth often does not happen in a unidirectional manner. Rather, years of lower growth must be considered normal; and companies displaying „ungrowth‟ in one year or period of time might very well begin to grow again at a later point.
Case vignette: Berte Qvarn
Berte Qvarn is the oldest, still operating Swedish company, rooting back to 1569. Today, it is a family-owned business, and the current management is in the business in the 13th generation. The family owns Berte Qvarn through their holding company Bertegruppen. Bertegruppen also includes a farming business, a seed company and Sia Glass. Sia Glass is the only larger Swedish ice-cream producer, which is competing against companies such as Unilever. Berte Qvarn is a mill, and the company sells flour to grocery shops all over Sweden. The company has managed to remain an independent mill and to grow during a time when the stagnating agriculture industry is focusing on rationalization and large-scale production. The company builds on a strong environmentally-friendly orientation and image, and has been a major driving force in the establishment of the eco-label KRAV. They have developed their niche as one of the largest producers of ecological flour, which enables them to be one of only eight remaining mills in Sweden. Since the 1950s, 2.400 mills have been closed or acquired in Sweden.
Case vignette: Hästens
Pehr Adolf Janson started the company as a one-man business in the saddler industry in 1852. The saddler did everything for and from the horse, including horse-hair mattresses. After 1910, the car industry took off and soon the managing family realized that there was no future in the saddler business. Instead, they started the industrial production of beds and mattresses. At this time, they launched the logotype of a running horse, which still is used as the company logo today. As the company grew, new locations were needed and the company was relocated to Köping in 1925. The current CEO, Jan Ryde, took over the management of the company in 1989, as the fifth generation. Since then Hästens has showed an impressing growth rate during the 1990s. Today, the company has no loans, and the rate of return on capital employed was over 50% in 1995 and 1996. In 1997, Sweden was still the most important market, while 25% was exported to nearby countries. In 2003, the export was close to 50% of total sales. Over time, Hästens has focused its offerings more and more. From selling plumes and beds in the 1950s they began focusing only on beds in the 1960s. From the late 1980s onwards the
focus became high-quality handmade beds. In a time when the industry paid much attention to mass production and low prices, Hästens did the reverse. Even though the beds are hand-made, delivery times are kept short. The aim is to send for delivery the same day the order is placed. The company pays a lot of attention to its internal processes and its employees. Once a month, a company meeting for all employees takes place. It is important for the management that everybody takes responsibility and feels „at home‟ in the organization. All employees are encouraged to bring up their questions during these meetings to clarify different issues and to learn from each other. To succeed with maintaining a high growth rate, the company is always changing. In internal communication, the CEO focuses on using the term „renewal‟ instead of „change‟, as people, according to him, by nature do not like changes. To strengthen the feeling of ownership among employees, 10% of profits go back to them, calculated on a daily basis.
Recessionists: Another pattern of growth identified in our sample is
that of companies that displayed continuous growth until recently. While the sales of these companies might have gone down considerably over the past years, their sales levels are still much higher than in 1993. Eight companies in our sample belong to this category. A number of these companies are in industries which are rather cyclical. Many quantitative studies on organizational growth would exclude these companies due to their lack of a unidirectional growth process. However, it would do these companies injustice not to consider them as growth companies, as they i.a. offer 3453 jobs more than in 1993. As of 2002, these companies have grown between 10 and 1539% since 1993. Thus, our quest for a more comprehensive view of growth processes is clearly illustrated. The sales in this category are more internationally oriented than the other categories, and none of the companies are only active on the Swedish market. In 1993, four companies of our sample were listed on the stock exchange. In 2002, this number had increased to nine; and five of these firms are placed in this category.
Table 5: Recessionists (sales in thousand SEK) 1993 2000 2001 2002 1993-2000(%) 1993-2002(%) Micronic Laser Systems 30 268 704 300 699 348 496 050 2227% 1539% Bertil Bergbom &
Söner 32 639 73 987 63 448 57 160 127% 75% Unipet 52 184 146 262 143 814 121 431 180% 133% Programma Electric 74 334 148 954 165 177 142 943 100% 92% Peak Performance 83 427 189 772 196 801 195 236 127% 134% Freds La Mote 193 385 273 177 273 633 213 049 41% 10% Vitamex 243 821 248 775 487 507 475 562 2% 95% Intentia 462 081 3 245 500 4 013 000 3 649 000 602% 690%
Source: compiled by authors
Case vignette: Intentia
In 1984, Intentia was founded as a consultancy firm by four engineering students from University of Linköping (Sweden). The founders explicitly decided on a growth strategy from the very beginning. Already in 1985, they acquired a software company, which enabled them to round up their offerings to include software, consulting and educational services. In 1987, Intentia became a pure software company. The company began to focus on business systems, and on linking the software to their knowledge about business processes. The company focuses on making the clients‟ business processes more efficient, combining their knowledge about processes with a software solution: “The technicians that develop systems often have no contact with the people working with business processes. They are even afraid of each other. We make a bridge between these two disciplines and connect them to each other”, says Björn Alqkvist, CEO and founder (Ahrens, 1999:193).
Business systems require high development costs, and thus an international client-basis for amortization. This demand made it important for Intentia to grow and become an international player. During the 1980s, Sweden was Intentia‟s target market. During the early 1990s, Intentia focused on expansion into Europe, and since 1995 on a world-wide presence. The company‟s growth, and internationalization, have taken place both organically and through acquisitions. Intentia grew impressively the first fifteen years. Then, the IT crisis had a major impact
on the business systems market. In result, the company has shown losses since 1999 until today. Intentia is listed on Stockholm Stock Exchange.
Case vignette: Peak Performance
In 1986, Peak Performance was founded as a company focusing on lifestyle, sports, and nature. Initially the company sold mostly ski clothes. In 1989, they broadened the collection to include sports clothes for the summer season as well as a collection of jeans, to avoid becoming a brand of only sport clothes. The company regards the year 1990 as their breakthrough year. In that year, they began to export to Finland, Denmark and Switzerland. Between 1990 and 1995 the company became one of the largest Scandinavian companies within the field of fashion and sports clothes. In 1996, Peak Performance was ranked as one of the fastest growing Swedish companies and also got listed on the stock exchange the same year. Peak Performance was acquired by the Danish company Carli Gry in 1998. According to financial analysts, the brand image of Peak Performance has always been one of their biggest assets. This consumer-product company has focused on marketing since the company was founded. They consider brand building as important in every process. This focus led to the decision to quit working with importers and to instead launch the company themselves in different countries: “It did not feel well to work with others. We are not only selling a product, it is an image and lifestyle which makes it important for us to have control over the total value chain” (Svenska Dagbladet, August 16th
1994). Peak Performance has a reputation for never doing market research even though they are operating in consumer markets with a high level of competition. They argue that this is not needed as they are living the propagated lifestyle themselves and as they produce the products they want to wear themselves. Their marketing activities mainly focus on events and sponsoring of sport events attended by the key target groups.
Discussion
Above, we have presented the different typical patterns of sales growth found in our sample. Even though this representation is admittedly reductionistic, it is more telling than a cluster analysis of the
same sample, as has been conducted in studies of comparable sample sizes. A cluster analysis of our sample (based on sales only, as well as based on combining sales, employees and profits) only leads to the identification of two clusters (plus one outlier), which did not display identifiable patterns of growth.
A number of issues are striking when analyzing our sample. First, hardly any service firms are represented. Only one firm (namely the consulting firm Ahlbihns) is a pure service firm; one other company develops software. Most of the other companies are from very traditional industries, in which they successfully occupy niche markets. This also means that only few of the companies are based on high technology; quite a number of the companies are not at all technologically-oriented. The overall degree of internationalization has clearly increased between 1993 and 2002. In 1993, only five companies sold globally; in 2002, this number had increased to twelve.
Theoretically, at this stage the major contribution of our study can be seen in the illustration of the limitations of current life-cycle and stage models and the need for more detailed studies of organizational growth processes. The different patterns of growth shown by the Gröna Kvisten firms provide the basis for questioning the usefulness of life-cycle and stage models for understanding firm development. In 1993 (-1996), when awarded as Swedish high-growth firms, all the companies in the study had successfully passed what in the language of life-cycle or stage models would be regarded as the initial stage, and entered or experienced the period of growth. Thus, they would be supposed to present certain similar structural and contextual features (Quinn and Cameron, 1983). However, the variations in age and ownership structures, as well as in background and previous development of the Gröna Kvisten‟s firms do not support these assumptions and call for a more micro and process perspective on the actual growth patterns unfolding in those companies.
The patterns identified are not consistent with the single developmental route often considered in the literature. Many of the stage models, indeed, suggest unidirectionality of growth (cf. Van de
Ven/Poole, 1995). We illustrated that companies in two of our categories did not display such unidirectionality and still grew substantially. Ample learning seems to take place during the development (cf. Greiner, 1972); for example, Intentia would leave their education and consultancy business on the side and become a pure software company after having learned that customers would benefit more from a combination of Intentia‟s knowledge about business processes and software solutions. The companies showed very different patterns and development paths, and therefore likely did not pass through any sequential order of stages (cf. Greiner, 1982). Churchill and Lewis (1983) had proposed that firms could also stay small in size within a certain niche. Interestingly, we found that none of the companies remained at the same size (though a few companies had very low growth rates). And even shrinking firms showed a long period of survival. Kazanjian and Drazin (1990) argue that over the course of their existence all firms would be confronted with similar problems and argue that it was possible to relate dominant problems with development phases. Yet, dominant problems in the Gröna Kvisten firms do not seem to be the prevalent indicators of new trends. Entrepreneurially-minded individuals, such as Daloc‟s CEO Inga-Lisa Johansson, are often the driving forces behind such decisions. We can thus share Penrose‟s (1952) criticism of the analogy of the organizational life cycle as too deterministic.
The development of the Gröna Kvisten firms does not provide empirical support for the imminent nature of firm growth, which is often assumed by stage and life-cycle models. For the investigated period we could not identify an underlying growth logic that would govern the development of our case companies. On the contrary, the different growth patterns identified provide the basis for illustrating a variegate set of logics and forms of development, which unfold in an unpredictable way.
Many of the stage models, but also other entrepreneurship literature, suggest that different development stages require different management and leadership styles and that therefore the founder would have to be replaced by a different CEO when the firm grew. A number of the companies in our sample illustrated that this does not have to be the
case. Rather, many cases displayed continuous growth over a long period of time, while the founder was still the CEO. Our findings also underline the importance of considering the possibility of stability, temporal decline and slow growth into models of organizational growth. Many growing companies do not display unidirectional patterns of growth; yet, it would be incorrect not to call them growth companies. Equally, our case studies have shown that – if we assume a stage-model perspective – the transition between stages is not necessarily triggered by crises or other negative situations, as suggested by a number of the models. Rather, a range of different issues can contribute to such a transition, and these do not have to be negative. One of many issues to study in our further analyses of this database is the role of ownership structures for the growth orientation, where for example many of the companies are family-owned.
Implications
In our paper we argue for the need of more detailed studies of processes and patterns of organizational growth. Unlike suggested by many model of organizational growth, even continuously growing firms often do not display unidirectional development paths. In our empirical study of 28 growth firms we could demonstrate how more detailed knowledge about the companies can change the evaluation of their growth path. We also showed that the discussion of organizational growth should be more differentiated. Even if companies are not growing from year to year, they might be very stable over a long period over time; thus contributing to economic welfare and providing job positions. An important implication of this finding is to rethink the focus on growth as the best option, and especially rapid growth. In total, the companies in this study offered 5648 jobs more in 2002 than in 1993.
By analyzing the composition of our categories, interesting implications for policy makers can be drawn. First, the companies that showed higher and stable growth (i.e. the „blossoms‟ and „steady growers‟) are mainly manufacturing firms. This evidence is in sharp contrast with the common assumption that firms with higher growth potentials would be technology-based ventures (e.g. Keeble & Wilkinson,
2000). Second, the companies that were most influenced by the economic climate (i.e. the „recessionists‟) were younger. This finding suggests that the general assumption that young successful firms would grow more might be somewhat simplistic.
References
Adizes, I. (1979), „Organizational passages: diagnosing and treating life cycle problems in organizations‟, Organizational Dynamics, 8, 1, pp. 3-25.
Adizes, I. (1989), „Corporate Lifecycles; How and Why Corporations
Grow and Die and What to Do About It, Prentice-Hall, Englewood Cliffs,
New Jersey.
Ahrens, T. (1996), Driving the Tiger, Falun: Scandbook
Ahrens, T. (1998), High Growth Companies: Driving the Tiger, 2nd ed, Aldershot: Gower
Aldrich, H. (1999), Organizations Evolving. London/Thousand Oaks: Sage.
Baghai, M./Coley, S./White, D. (1999), The Alchemy of Growth:
Kickstarting and Sustaining Growth in Your Company, London: Orion
Business.
Barth, H. (2001), Tillväxthinder i mindre företag, included in; Davidsson, P, (2001), Tillväxtföretagen i Sverige, Stockholm: SNS Förlag, pp. 234-249.
Baum, J.R./Locke, E.A./Smith, K.G. (2001), A Multidimensional Model of Venture Growth, Academy of Management Journal, 44, 2, pp.292-303.
Beverland, M./Lockshin, L.S. (2001), Organizational life cycles in Small New Zealand Wineries, Journal of Small Business Management, 39, 4, pp. 354-362.
Carroll, G.R./Delacroix, J. (1982), Organizational mortality in the
newspaper industries of Argentina and Ireland: An ecological approach,
Administrative Science Quarterly, 27, pp. 169-98.
Churchill, N.C./Lewis, V.L. (1983), The Five Stages of Small Business Growth. Harvard Business Review, 61, 3, pp. 30-50.
Covin, J.G./Slevin, D.P. (1997), High growth transitions: Theoretical perspectives and suggested directions. In: D.L. Sexton/R.W. Smilor (eds.): Entrepreneurship 2000, Chicago: Upstart Publishing, pp. 99-126.
Davidsson, P./Delmar, F./Wiklund, J. (2001), Forskning om tillväxt i småföretag, included in: Davidsson, P. (2001), Tillväxtföretagen i
Sverige, Stockholm: SNS Förlag, pp. 9-35.
Ek, T. (1997), Våga, växa, vinna, Stockholm: Ekerlid. [To dare, to grow, to win]
Erikson, E.H. (1963), Childhood and Society, New York: Macmillan & Free Press.
Eisenhardt, K.M./Bird Schoonhoven, C. (1990), Organizational growth: linking founding team, strategy, environment, and growth among US semiconductor ventures, 1978-1988, Administrative Science Quarterly, 35, 3, pp. 504-529.
Freeman, J./Carroll, G.R./Hannan, M.T. (1983), The liability of newness: age dependence in organizational death rates, American Sociological
Review, 48, pp. 692-710.
Galbraith, J. (1982), The Stages of Growth, Journal of Business Strategy, 3, 1, pp. 70-79.
Garnsey, E. (1998), A Theory of the Early Growth of the Firm, in:
Industrial and Corporate Change, 7, 3, pp.523-556.
Greiner, L. E. (1972), „Evolution and Revolution as Organizations Grow‟
Harvard Business Review, 76, 3, pp.37-46.
Gupta, Y.P./Chin D.C.W. (1994), Organizational life cycle: a review and proposed directions for research, The Mid-Atlantic Journal of Business, 30, 3, pp. 269-294
Hanks, S.H., Watson, CJ., Jansen, E. & Chandler, G.N. (1993), Tightening the Life-Cycle Construct: A Taxonomic Study of Growth Stage Configurations in High-Technology Organizations,
Entrepreneurship Theory and Practice, 18, 2, pp. 5-29.
Hannan, M.T./Freeman, J. (1987), The ecology of organizational founding: American labor unions, 1836-1985, American Journal of Sociology, 92, 9, pp. 910-943
Hoy, F., McDougall, P.P., & Dsouza, D.E. (1992), Stategies and environments of high growth firms, in D. L. Sexton & J. D. Kasarda (eds.), The State of the Art of Entrepreneurship (pp. 341-357). Boston: PWS-Kent Publishing.
Kazanjian, R.K. (1988), Relation of dominant problems to stages of growth in technology-based new ventures, Academy of Management
Journal, 31, 2, pp. 257-279.
Kazanjian, R.K. & Drazin, R. (1989), An empirical test of stage of
growth progression model, Management Science, 35, 12, pp. 1489-1503.
Kazanjian, R.K. & Drazin, R. (1990), A stage-contingent model of design and growth for technology based ventures, in Journal of Business
Venturing, 5, 3, pp. 137-150.
Keeble, D. & Wilkinson, F. (2000), High-Technology SMEs, Regional Clustering and Collective Learning: An Overview. In: Keeble, D. & Wilkinson, F. (eds.), High-Technology Clusters, Networking and
Collective Learning in Europe, Aldershot et al.: Ashgate, pp. 1-20.
Levinson, D. (1978), Seasons of a Man’s life, New York: Knopf.
McKelvie, A. & Chandler, G.N. (2002), Patterns of new venture development, in: Bygrave, W.D. et al. (ed.): Frontiers of
Entrepreneurship Research, Babson College, pp. 309-320.
McMahon, R.G.P. (2001), Business Growth and Performance and the Financial Reporting Practices of Australian Manufacturing SMEs,
Journal of Small Business Management, 39, 2, 152-164.
Melin, L. (1992), Internationalization as a Strategy Process, Strategic
Miller, D. (1986), Configurations of Strategy and Structures: Towards a Synthesis, in Strategic Management Journal, 7, pp. 233-249
Miller, D./Friesen, P.H. (1984), A longitudinal study of the corporate life-cycle, Management Science, 30, 10, pp. 1161-1183.
Neumair, U. (1998), A General Model of Corporate Failure and
Survival: A Complexity Theory Approach, Unpublished doctoral
dissertation, University of St. Gallen.
O‟Farrell, P.N./Hitchens, D.M.W.N. (1988), Alternative theories of
small-firm growth: a critical review, in: Environment and Planning A, 20, 2, pp. 1365-1383.
O‟Rand, A.M./Krecker, M.L. (1990), Concepts of the life-cycle: Their History, Meanings, and Uses in the Social Sciences, Annual Review of
Sociology, 16,1, pp. 241-262.
Penrose, E.T (1952), Biological analogies in the Theory of the Firm, The
American Economic Review, 42, 5, pp. 804-819.
Penrose, E.T.(1995/1959), The Theory of the Growth of the Firm, 3rd ed., Oxford: Oxford University Press.
Quinn, R.E./Cameron, K.S. (1983), Organizational Life Cycles and Shifting Criteria of Effectiveness: Some Preliminary Evidence,
Management Science, 29, 1, pp. 33-51.
Scott, M./Bruce, R. (1987), Five Stages of Growth in Small Business,
Long Range Planning, 20, 3, 45-52.
Smith, N.R./Miner, J.B. (1983), Type of Entrepreneur, Type of Firm, and Managerial Motivation: Implications for Organizational Life Cycle
Theory, Strategic Management Journal, 4, pp. 325-340.
Smith, K.G., Mitchell, T.R. & Summer, C.E. (1985), Top Level Management Priorities in Different Stages of the Organizational Life Cycle, Academy of Management Journal, 28, 4, pp. 799-820.
Söderhjelm, T./Larsson, Å. (1998), att våga: 23 berättelser om svenska
framgångsrika entreprenörer, Stockholm: IVA [To dare: 23 stories about