of Ficus obtusifolia
By Rania Abubakar Mohamed
Research Project in Pharmacognosy, 30 hp, fall semester.
2020
Supervisor: Luke Robertson Examiner: Ulf Göransson
Research Group Pharmacognosy Department of Medicinal Chemistry Faculty of Pharmacy
Abstract
Plants are classified as stationary organisms and for their ability to survive in the existing environment a well-developed system is required. This system is important for protection and competition with other organisms. Plants achieve this by secretion of various chemical substances which is developed generation by generation to assure plants spread. Mutualism motivates also the secretion of unique substances. For humanity, plants became one of many utilized sources in drug discovery and this was the motivation for the project.
Ficus includes 800 species grown in different climates and countries. Due to the diversity of
this species many studies were performed to profile its chemical constituents. However, this project is the first to study the chemical constituents of F. obtusifolia collected from Barro Colorado island in Central America. Although the mutualism between the figs and the wasp is well known, no studies have been performed to provide knowledge about the effect of mutualism on the figs regarding its chemical diversity.
This project managed to trace a compound with a molecular weight of 369 only in the figs and also managed to statistically confirm that this compound changes in concentration across pollination stages. The 369-mw compound was not traceable in the leaf and the bark. In addition to this a total of eight compounds have been isolated from the figs of F. obtusifolia. The structure of these compounds was determined by 1D and 2D NMR after a purification by MPLC and HPLC. A bioassay was performed to test antifungal activity of chlorogenic acid (23) and methyl chlorogenate (24 and 25), but no activity was exhibited.
Table of Contents
1. Introduction ... 5
1.1 Background ... 5
1.2 Ficus in traditional herbal medicine ... 7
1.3 Isolated compounds from Ficus species ... 7
1.4 Figs-wasp mutualism ... 9
1.5 Barro Colorado island ... 10
1.6 Method overview ... 11
2. Aim……….. 12
3. Materials and Methods ... 13
3.1 Instrument ... 13
3.1.1 Chemicals ... 14
3.2 Small-scale analyses ... 15
3.2.1 Sample extraction ... 15
3.2.2 Profiling the 369-mw compound by LC-MS ... 16
3.2.3 Extraction and profilling the 369-mw compound in time-series samples ... 17
3.2.4 Statistical analyses ... 18
3.2.5 GNPS ... 18
3.3 Large-scale analyses ... 18
3.3.1 Figs extraction from F. obtusifolia ... 18
3.3.2 Leaf extraction from F. obtusifolia ... .19
3.3.3 The purification of figs and leaf extracts from F. obtusifolia by MPLC ... 21
3.3.4 Sample preparation for NMR analyses ... 21
3.3.5 Further purification of H2O extract from F. obtusifolia by HPLC ... 23
3.4 Analytical test runs for samples from F. obtusifolia ... 25
3.4.1 Sample preperation ... 25
3.4.2 Analytical HPLC analyses ... 25
3.4.3 Preperative HPLC analyses ... 26
3.5 Extraction and purification of figs extract from F. insipida……… .. 29
3.6 Bioassay ... 31
4. Results ... 32
4.2.1 Statistical analyses ... 38
4.3 GNPS ... 40
4.4 Large-scale analyses of F. obtusifolia (figs extract) ... 44
4.4.1 NMR analyses ... 44
4.4.2 Structure elucidation ... 47
4.5 NMR spectra for pure 369-mw compound ... 69
4.6 Bioassay ... 70 5. Diskussion ... 71 5.1 Small-scale ... 71 5.2 Large-scale ... 72 5.3 Future perspective ... 76 6. Conclusion ... 77 7. Acknowledgment ... 78 8. References ... 79 9. Appendix ... 83 9.1 Appendix A ... 83 9.2 Appendix B ... 87 9.3 Appendix C ... 102
1. Introduction
1.1 BackgroundTraditional herbal medicines have been used for centuries and managed to treat different human diseases because they contain active compounds. One important source of information about traditional herbal medicines is a document called Ebers Papyrus from Egypt which was bought in 1874 by Georg Ebers. This document includes many herbal prescriptions for treatment of 842 human diseases and injuries (Ali and Finlayson, 2013; Wagner, 2019).
One important example of traditional herbal medicine is artemisinin (1) (Figure 1) which was isolated from Artemisia Annua. This novel drug was discovered by searching for recipes in traditional Chinese medicine for treatment of fever and it has a low IC!" value (7.67 nM) in
vitro (Su and Miller, 2015; Basco and Le Bras, 1993). The resistance of the malaria parasite Plasmodium berghei increased and therefore the need for developing new antimalaria drugs
also increased. Two examples of derivatives drugs from artemisinin that has been used in the clinic are artemether (IC!" = 3.71 nM) and artesunate (IC!" = 11 nM) (Basco and Le Bras, 1993; Janse et al., 1994). The oral absorption of artemisinin and its derivatives are rapid and changes between individuals. The maximum concentration of the drug in the plasma reaches in one to two hours and the elimination half time is short. For slower absorption and longer elimination half time the drug is administered rectally or intramuscularly (Balint, 2001).
Morphine (2) (Figure 1) an alkaloid, is also a drug with natural origin which was isolated from
quantity of morphine salt was swallowed by Sertürner due to toothache which resulted in pain relief.
Another example of alkaloid is quinine (3) (Figure 1) which is an old antimalarial drug isolated from the bark of Cinchona. Quinine was used as antimalarial treatment in the 17th century, and
it was discovered accidentally according to a legend suggesting that a person with a high fever dived into a pool contaminated by Cinchona trees which resulted in reduced fever. Thereafter the Cinchona bark was used as an extract for treatment of fever (Achan et al., 2011).
Since different drugs are of natural origin for instance, from plants such as morphine, artemisinin, and quinine or from microorganisms such as penicillin (4) (Figure 1) or from marine animals such as halichondrin B (5) (Figure 1) became nature recently utilized in drug discovery (Malviya and Malviya, 2017).
Figure 1. Isolated drugs from nature, artemisinin (1), morphine (2), quinine (3), penicillin (4) and halichondrin B (5).
HO HO O H N O O O O O OH O N N 1 2 3 N S O N H O O HO O O O O O O O O O O O O O O HO OH OH O O 4 5 H H H H H H H H H H H H H H H H H
1.2 Ficus in traditional herbal medicine
The figs from Ficus species have wide uses in traditional herbal medicines and was utilized as anti-inflammatory herb, some examples are shown in Table 1 (Lansky et al., 2008). Ficus (genus) is a member of a family known as Moraceae which is a mulberry family that includes 40 genera, and it grows in different countries. Ficus includes approximately 800 species all from vines, trees, and shrubs (Lansky et al., 2008; Hossain, 2018). Some studies were performed to isolate the active compound in Ficus species collected from different countries and to study the chemical constituents of Ficus species.
Table 1. Traditional uses of Ficus species in herbal medicines ( Lansky et al., 2008).
Ficus species Plant part Collected place Uses
F. racemosa Fruit India Gastralgia
F. religiosa Dried fruit Bangladesh Hemorrhoids
F. carica Dried fruit Tunisia Hemorrhoids
F. pyrifolia Dried leaves Madagascar Malaria
F. insipida Dried leaves and stem Honduras Menstrual pain
1.3 Isolated compounds from Ficus species
Several Ficus species are not studied since they are many, but those that have been studied are prolific with chemical constituents. Different classes of compounds have been isolated from
Ficus known as bioactive metabolites such as alkaloids, tannins (6), flavanones (7), glycosides
of the isolated compounds from Ficus were used as potential anti-inflammatory, anticancer and antimicrobial agents (Deepa et al., 2018; Lansky et al., 2008; Almahyl and Sukari, 2002).
Figure 2. Isolated compounds from Ficus species. Tannins (6), flavanones (7), glycosides (8), fatty acid (9),
coumarins (10), sterols (11), arctigenin (12), matairesinol (13) and terpenoids (14, 15 and 16).
A study managed to isolate terpenoids (14, 15 and 16) from the stem of F. aurantiaca (Figure 2) collected from Malaysia, these compounds showed an anti-inflammatory effect in vitro (Mawa et al., 2016). Lignans such as arctigenin (13) and matairesinol (14) (Figure 2) were isolated from the leaves of F. citrifolia collected from Brazil, which exhibited cytotoxic effect
OH HO HO O O O O O OH OH OH OH O O OH OH HO HO O O HO O O OH OH OH HO HO OH O O HO 6 7 8 OH HO H O OH OH O O O O O OH O O O O OH 13 14 15 OH HO HO OH HO HOOC CH2OH OH O 9 10 11 12 16
in vitro (Baetas et al., 2018). A previous study profiled the chemical constituents of F. triangularis from the stems collected from Bureau and has managed to isolate flavanones, fatty
acid esters as well as a sterol. However, no reported studies have investigated the activity of these compounds (Ragasa et al., 2014; Tsai et al., 2014). Flavanones have also been isolated from the bark of F. nymphaefolia collected from Guadaloupe (Darbour et al., 2007).
1.4 Figs-wasp mutualism
The mutualism between the wasp and Ficus fruit (figs) is known for a long time, it is an obligate relationship for both to survive. The wasp female flies into figs syconium to lay eggs as shown in Figure 3 to pollinate the flowers and then dies. Wasp larvae develop inside a syconium, then a wingless male wasp emigrates from seed galls and searches for another seed gall containing female wasp, making a hole in a syconium to help the female wasp for emigration from seed galls. The mated female wasp collects the released pollen from flowers and is not ready to fly out from the figs until a wasp male sacrifices by making a hole leading outside from the fig and then dies. A female wasp pollinates another host, and the cycle starts again. The figs tree is dependent on the wasp to fertilize its seeds and to transfer flower pollen to another figs tree and in return, the wasp offspring develop inside the galls seeds (Al-Beidh., 2010; Xiao et al., 2013).
Figure 3. Figs-wasp mutualism lifecycle (Al-Beidh., 2010).
Due to the interplay between the figs and the wasp, it became important to study the chemical constituents of the figs from Ficus species. One compound with a molecular weight of 369 has already been identified in F. citrifolia and it is believed that it is important to the mutualism ecologically. Therefore this project investigates if the 369-mw compound occurs in other Ficus species and if it occurs in the leaf and the bark by LC-MS. This project also studies if the concentration of the 369-mw compound varies at different pollination stages. This study is also performed to provide knowledge about the chemical constituents of Ficus by determining the structure of the isolated compounds with NMR.
1.5 Barro Colorado island
All plant material used in the project was collected from Barro Colorado Island (BCI) on Panama Canal Zone in Central America which is the largest tropical forested island in Gatun Lake. BCI is known for its diversity with different organisms and was since 1916 attracted place for many researchers including 40 species of terrestrial mammals’ provenance, which have been
understood since 1980. Currently many studies are performed by Smithsonian tropical research institute to study animals and plants diversity in BCI, but still there are no reported studies about the chemical constituents of the figs from different species in BCI (Smithsonian Tropical Research Institute, 2016; Leigh, 1999; Croat, 1978).
1.6 Method overview
2. Aim
The aim of this project is to trace the 369-mw compound across pollination stages and plant parts i.e., figs, bark and leaf in a small-scale by LC-MS. The nine studied Ficus species include
F. obtusifolia, F. citrifolia, F. bullenei, F. triangularis, F. nymphaefolia, F. popenoi, F. insipida, F. maxima and F. trigonata collected from Panama in Central America.
Furthermore, in a large scale to isolate the 369-mw compound and new interesting chemistry from F. obtusifolia. The aim of this project is also to purify the 369-mw compound and to determine the structure of the isolated compounds by 1D and 2D NMR. In addition to this, a bioassay will be performed to test some of the isolated compounds for antifungal activity.
3. Materials and Methods
3.1 Instruments
Instruments used in the lab were: analytical balance scale (Sartorius ME235S, Germany) and (Sartorius 1702, Germany) for weighing all samples; Ultrasonic cleaner to fragment plants membrane, cells and macromolecules (VWR, USA); Biofuge Fresco centrifuge (Heraeus, Germany); rotary evaporator (BUCHI, Switzerland) and Heidolph Hei-vap (Fisher Scientific, USA); electric grinder (Retsch GmbH, Germany); a freeze drier (Biosurplus, San Diego); Genevac HT-4 & HT-4X series rotatory evaporator (Genevac Technologies, England) and Speed vac plus SC110 A (Savant, New York). LC-MS analyses were performed with a positive
ESI mode using the Thermo FinniganLTQ system to collect MS and MS/MS data (Thermo
Fisher Scientific, USA). The column used in the analyses was C18, 2.6 µm, 100 Å, 100 x 3 mm
and C18, 2.5 µm, 100 Å, 50 x 2.1 mm (Kinetex, USA).
The instrument used for preparative analyses was ÄKTA FPLC model with UV-detector, monitor UPC-900 and pump P-920 (Amersham Pharmacia Biotech, Sweden). The column used was C#$, 12 g, 100 Å, 30 µm (Biotage Sfär, Sweden). Another preparative instrument used was the Shimadzu HPLC system which consists of Shimadzu DGU-14A degassing unit, Shimadzu SCL-10A system controller, Shimadzu LC-10 AD pump, Shimadzu SIL-10 AXL autoinjector, Shimadzu FRC-10C fraction collector, Shimadzu SPD-M10A diode array detector and Pharmacia LKB-FRAC 100 fraction collector (Shimadzu, Japan). The column used was C18, 5
system used was Varian 9050 with variable wavelength UV-VIS detector, sample collector (LKB Bromma), XB-C18, 5 µm, 100 Å, 250 x 21.2 mm and a precolumn (Kinetex, USA).
The instrument used for analytical analyses was the Shimadzu HPLC system which consists of DGU- degassing unit, LC-20 AD pump, CBM-20 A Communication module, SIL-20AC HT auto sampler, SPD-M20A UV/vis detector, and CTO-20AC column oven (Shimadzu, Japan). The column used was XB-C18, 5 µm, 100 Å, 150 x 21.2 mm (Kinetex, USA).
For NMR analyses a 600 MHz spectrometer was used with w/cryoprobe (Bruker Avance Neo, USA).
3.1.1 Chemicals
Chemicals used in the lab were: methanol (MeOH, HPLC-grade ≥ 99.9%) and formic acid (HPLC-grade ~ 96%) manufactured by Honeywell (Fluka, England); acetonitrile (CH3CN,
HPLC grade ≥ 99.9) manufactured by VWR chemicals (Radnor, USA); milli Q H2O from
Merch Millipore and trifluoroacetic acid (TCA) manufactured by Sigma Aldrich (HPLC-grade ≥ 99.0%).
On a large-scale separation a C18, 50 µm, 65 Å was used to obtain a powder of the extracted
material which facilitates scraping the extract from a round flask (Sepra™ Phenomenex, USA).
For NMR analyses two solvents were used, dimethyl sulfoxide-d6 >99.8 atom% D and
3.2 Small-scale analyses
3.2.1 Sample extraction
A total of 149 samples from each Ficus species and different plant parts (i.e., bark, leaf, and figs) were weighed between 83-110 mg in a 1.5 ml Eppendorf tube. Each sample was labeled with a certain code to be able to identify which plant part each Eppendorf tube contained, from which Ficus species, if the sample was freeze-dried or oven-dried and the weight in mg. An excel sheet was created to record the above-mentioned information (Figure A1 in appendix).
A 250 mL extraction solution containing 70% MeOH, 30% H2O, and 0.1% formic acid was
prepared for maceration. Maceration is a simple method where a coarse or a powder of the plant material soaks in a container with a solvent at room temperature which allows extraction of thermolabile compounds (Zhang et al., 2018).
All samples that contained figs from each species were extracted first by adding 1 mL of the extraction solution if the sample weighted 100 mg, or 900 µL if the sample weighted 90 mg, or 800 µL if the sample weighted 80 mg, and so on. The samples were sonicated for 30 minutes at room temperature and centrifuged at 13,000 rpm for 10 minutes at 15 °C. The supernatant was filtered with 0.45 µm filter, placed in vials and analyzed with LC-MS. Furthermore, two specimens fromF. trigonata, F. obtusifolia, F. bullenei, F. triangularis, F. citrifolia, F. popenoi
freeze-dried leaf. The same selection was performed to choose the bark part, namely one sample containing oven-dried bark and the other sample containing freeze-dried bark.
3.2.2 Profiling the 369-mw compound by LC-MS
Two solutions were pumped into the system: solution A contained 5% CH3CN, 95% H2O, 0.1%
formic acid and solution B contained 95% CH3CN, 5% H2O, 0.1% formic acid with a flow rate
set to 0.3 mL/min. The first run was performed according to De Vos’ paper in 30 minutes with a programmed gradient as shown in Table 2 (De Vos et al., 2007).
Table 2. Programmed gradient in LC-MS system.
TIME (MIN) %A %B 0 100 0.0 20 22.0 78.0 25 22.0 78.0 26 100.0 0.0 30 100.0 0.0
The runtime was adjusted from 30 min to 37 min as shown in Table 3, because the peak for the 369-mw compound was obscured by another compound. Also, the gradient was optimized by adding 3 min of isocratic flow at 0% A at the beginning because the 369-mw compound showed variable elution times using the method in Table 2. This compound is very water-soluble but still requires a small proportion of organic solvent to elute. The 369-mw compound is sensitive to a slightly different proportion of the organic solvent pumped into the system and is therefore extremely sensitive to even minute changes in organic solvent composition.
Table 3. Adjusted gradient in LC-MS system TIME (MIN) %A %B 0 100.0 0.0 3 100.0 0.0 23 22.0 78.0 28 22.0 78.0 29 100.0 0.0 37 100.0 0.0
3.2.3 Extraction and profiling the 369-mw compound in time-series samples
Time-series one and two contained figs from F. citrifolia collected from different trees and time-series three contained figs from F. obtusifolia. Each time-series contained figs from different pollination stages labeled from A to E.
Firstly, a total of 30 samples from the time-series were weighed to decide the amount for sample preparation (Figure A2 in appendix). Secondly, from each time-series, 50 mg were weighed from five different figs in a 1.5 mL Eppendorf tube resulting in 69 samples (Figure A3 in appendix). Unpollinated figs (labeled as A) from time-series one and two were small and therefore only two replicates were prepared.
The extraction procedure for the time-series samples was the same as previous. It started by adding 1 mL of a new prepared extraction solution in time-series one, then two and lastly three. These three time-series samples were extracted and analyzed by LC-MS on different days. However, all samples from each time-series were sonicated and centrifuged at the same time as
described above. These samples were filtered into a vial and 200 µL from each sample were transferred into a new vial and were analyzed randomly in LC-MS and sorted in the fridge.
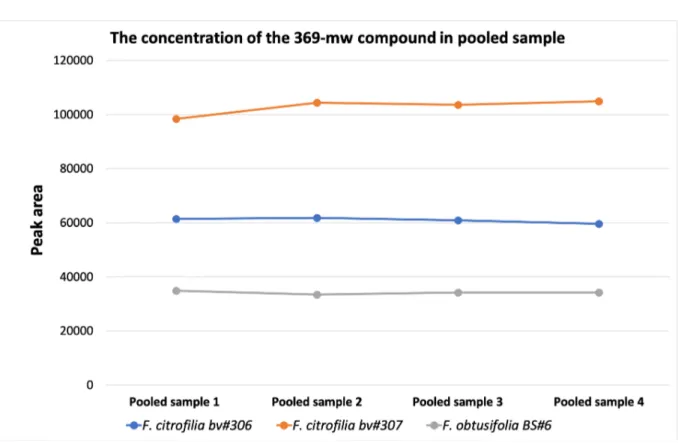
A pooled sample for each time-series was prepared by transferring 20 µL from every sample into a new vial. This sample was injected in LC-MS between every fourth sample to ensure that the detected signal of the 369-mw compound was stable.
3.2.4 Statistical analyses
Time-series samples were analyzed in replicates to confirm if each time-series contain different concentration of the 369-mw compound. This hypothesis can be rejected or accepted by performing statistical analyses using ANOVA test in SPSS. This test requires a randomly selected samples for analyses and a normal distributed data. This was fulfilled by analyzing time-series samples randomly in LC-MS and Shapiro-Wilk test was used to ensure if the data was normally distributed.
3.2.5 GNPS
GNPS (Global Natural Product Social molecular networking) was used to match MS/MS spectra for a few prepared figs samples from F. triangularis, F. citrifolia, F. nymphaefolia, F.
trigonata, F. obtusifolia and F. insipida. After a successful run in GNPS, different hits
3.3 Large-scale analyses
3.3.1 Figs extraction from F. obtusifolia
Flowchart 1 shows a sketch of the extraction part, where 500 g of dried figs material from F.
obtusifolia was extracted in 500 mL solution of 50% MeOH/50% DCM, then in 100% MeOH
and finally in 50% MeOH/50% H2O. These three extracts were combined, evaporated and
freeze-dried to obtain a powder weighed 20 g. This powder was firstly soaked in 500 mL H2O
to obtain H2O layer weighed 5 g, which was then decanted. Then 500 mL MeOH was added to
obtain MeOH layer weighed 5 g. Both extracts weighed 1.6 g and were saved for MPLC.
3.3.2 Leaf extraction from F. obtusifolia
Another extract from F. obtusifolia was prepared by using 600 g of grounded leaf material and the powder was extracted firstly in 700 mL DCM/MeOH in 80:20 ratio. Then the extraction was performed in 700 mL with 100% MeOH and was repeated three times. Both extracts were combined and partitioned in a separation funnel between hexane (500 mL) and MeOH:H2O
(90:10) (500 mL). The MeOH layer was dried and partitioned eight times between DCM/H2O
to obtain organic extract and aqueous extract. Thereafter, 1.54 g of the aqueous extract was saved for MPLC.
Flowchart 1. Description for the extraction of the figs and the leaf parts from F. obtusifolia. F. obtusifolia Figs (500 g) Leaf (600 g) Extraction in 500 mL of 1) 50% MeOH/50% H2O 2) 100% MeOH 3) 50% MeOH/50% H2O Combined, evaporated, freeze-dried and a powder obtained (20 g)
Powder soaked in 500 mL H2O, then decanted
from solution (5 g)
Powder soaked in 500 mL MeOH. MeOH layer (5 g) 1.6 g purified in MPLC Extraction in 700 ml of 1) DCM/MeOH (80:20) 2) 100% MeOH (× 3) Extracts combined, then LLE with 500 ml hexane and 500 ml
MeOH (90:10) H2O layer freeze-dried
(1.54 g) and purified in MPLC
MeOH layer dried and LLE again with DCM/H2O (× 8)
3.3.3 The purification of figs and leaf extracts from F. obtusifolia by MPLC
Flowchart 2 shows a sketch for the purification procedure which was performed by MPLC with a C18 column and a mobile phase consisting of solutions A and B. Solution A consisting of
100% H2O, 0.1% TFA and solution B consisting of 100% CH3CN, 0.1% TFA. The
concentration of CH3CN in the analysis was 0% in 5 mins, then increased to 100% in 55 mins
and it remained the same for the last 5 mins. The flow rate in the system was 10 ml/min.
After running H2O layer and MeOH layer extracts in MPLC, 60 fractions were collected. These
extracts were purified twice in MPLC which resulted in further 60 fractions. These fractions were evaporated and then analyzed by NMR.
The same procedure was used for purification of the leaf material in MPLC and 60 fractions were collected.
3.3.4 Sample preparation for NMR analyses
Every second vials from each fraction were prepared by adding 220 ml of dimethyl
sulfoxide-d6 >99.8 atom% D or methanol-!! >99.5 atom% D. The dissolved samples were then
transferred into NMR tubes. 1H-NMR was collected to decide which fraction possibly contained
Flowchart 2. Description for the purification of the figs and the leaf extracts from F. obtusifolia. F. obtusifolia Figs extract H2O layer extract Leaf extract 60 fractions collected (LR.01.25) 60 fractions collected
(LR.01.26) 60 fractions collected (RA.01) 60 fractions collected (RA.02) MPLC Biotage Sfär C18, 12 g, 100 Å, 30 µm 0-5 mins: 100% A, 5-55 mins: 100% B, 55-60 mins: 100% B NMR on every second fraction MPLC Biotage Sfär C18, 12 g, 100 Å, 30 µm 0-5 min: 100% A, 5-55 min: 100% B, 55-60 min: 100% B 60 fractions collected (RA.06) NMR on every second fraction MeOH layer extract
3.3.5 Further purification of H2O extract from F. obtusifolia by HPLC
Fractions 13-25 and fractions 10-12 of H2O extract from F. obtusifolia were combined and
purified in HPLC. The procedure is simplified in flow chart 3.
Two solutions were pumped into the system: solution A consisting of 100% H2O and solution
B consisting of 100% CH3CN. At the beginning 5% of CH3CN was pumped into the system
which then increased to 45% until 55 mins. The gradient remained the same in 10 mins resulting in 65 mins runtime and the flowrate was set to 9 ml/min and 60 fractions were collected. NMR analyses was performed on every second fraction and COSY, HSQC, HMBC spectra were collected for some fractions that contained highest abundance of unknown compounds for structure elucidation.
Combined fractions of 10-12 were purified by HPLC but with different gradient because these fractions contained the 369-mw compound which is a very polar compound. The run started with 100% H2O in 10 mins, then CH3CN was pumped into the system gradually to 13% in 65
mins. CH3CN solution was then increased to 95% after 65 mins to 70 mins. The flowrate was
set to 9 ml/min and 75 fractions were collected. NMR analyses was performed on every second fraction and COSY, HSQC, HMBC spectra were collected for some fractions.
Flowchart 3. Overview for purification of selected fractions by HPLC. H2O layer figs extract LR.01.25 and LR.01.26 Combined fractions 13-25 (0.431 g) Combined fractions 10-12 (0.3 g) 1H-NMR 60 fractions collected (RA.04) 75 fractions collected (RA.05) HPLC C18, 5 µm, 100 Å, 150 x 21.2 mm 0-55 mins: 5-45% B, 55-65 mins: 45% B COSY, HSQC, HMBC
RA.04.10 RA.05.26 RA.05.34
uridine (17)
trigonelline (18) abscisic acid (19)
RA.05.18 phaseic acid (20) Compound (22) dihydro-phaseic acid (21) HPLC C18, 5 µm, 100 Å, 150 x 21.2 mm 0-10 mins: 100% A, 10-65 mins: 0-13% B, 10-65-70 mins: 95% B
3.4 Analytical test runs for samples from F. obtusifolia
3.4.1 Sample preparation
NMR analyses provided information about two interesting compounds in RA.05.16 and the goal was to purify them. Because these compounds are available in small amount it was important to perform analytical test runs to find a suitable gradient before large scale purification by HPLC. This sample was redissolved in MeOH and 10 µL was transferred into a new vial diluted with 90 µL H2O. Also, a suitable gradient was required for purification of the
369-mw compound on a large scale from fractions RA.04.30 and RA.04.29.
3.4.2 Analytical HPLC analyses
Two solutions were pumped into the system: solution A consisting of 100 % H2O, 0.045% TFA
and solution B consisting of 100% MeOH, 0.045% TFA. MeOH was used to improve the separation and because CH3CN is a stronger eluting solvent of the 369-mw compound at low
percentage compared to MeOH. The programmed and selected gradient are shown in Table 5 and 6 which was adjusted based on eluting peaks for each sample.
Table 5. Programmed gradient in HPLC system.
TIME (MIN) %A %B 3 Varies Varies 22 Varies Varies 23 5 95 24 5 95 25 95 5
Table 6. Selected gradient in HPLC system
Sample Tested methods % B (3-22 min) Selected gradient RA.05.16 3 5-35 15-50 20-50 15-50 RA.04.30 5 5-50 5-20 5-10 5-12 5-10 5-35 3.4.3 Preparative HPLC analyses
A purification step on a large scale was performed for separation of two compounds from fraction RA.05.16. The procedure is simplified in Flowchart 4.
This fraction was redissolved in MeOH and bond into a cotton which was then dried with nitrogen gas. Two solutions were pumped into the system: solution A consisting of 100% H2O,
0.045% TFA and solution B consisting of 100% MeOH, 0.045% TFA. The flowrate was set to 9 mL/min.
The concentration of MeOH was 5% from 0-5 mins which was then increased to 20% from 5-6 mins and then increased to 50% from 5-6-55 mins. At 55 min95% of MeOH was pumped into
the system and it remained the same until 65 mins. A total of 60 fractions were collected and labeled.
Fractions RA.04.30 and RA.04.29 were purified separately to isolate the 369-mw compound. The first purified fraction was RA.04.30, the used column was shipped with 50% CH3CN
therefore it was washed with 50-90% CH3CN in 10 mins. The column was then washed and
conditioned with MeOH.
The used gradient for the run was 2% of solution B which increased to 10% in 90 mins. Then 90 fractions were collected and labeled. On another day fraction RA.04.29 was purified and the collected 90 fractions were also labeled.
LC-MS analyses were performed to decide which fractions contained the pure compounds which were further analyzed in NMR.
Flowchart 4. Description of purification by analytical and preparative HPLC of selected fractions. H2O layer figs extract Fractions: RA.04.29 and RA.04.30 Fraction: RA.05.16 HPLC XB-C18, 5 µm, 100 Å, 250 x 21.2 mm 0-90 mins: 2-10% B, 95-100 mins: 95% B HPLC XB-C18, 5 µm, 100 Å, 150 x 21.2 mm 0-5 mins: 5% B, 5-6 mins: 5-20% B, 6-55 mins: 50%, 55-65 mins: 95% B 90 fractions were collected (RA.10 and RA.11) 60 fractions were collected (RA.09) LC-MS C18, 2.5 µm, 100 Å, 100 x 3 mm 0-3 mins: 100% B, 3-7 mins: 100% A 1H-NMR Fractions: RA.10.45-49 and RA.11.45-49 LC-MS C18, 2.6 µm, 100 Å, 100 x 3 mm 0-3 mins: 100% A, 3-15 mins: 100% B, 15-28 mins: 100% A The 369-mw compound 1H-NMR Fractions: RA.09.15-35 COSY, HSQC, HMBC RA.09.17 RA.09.29
Trans and cis methyl
chlorogenate (24 and 25) Trans chlorogenic acid (23)
m/z 370
m/z 355 and 369
3.5 Extraction and purification of figs extract from F. insipida
Flowchart 5 shows a sketch for the extraction procedure where 600 g of figs material from F.
insipida was grounded and then transferred into a 1000 ml bottle. The extraction was performed
with DCM/MeOH (50:50) and sonicated for 30 min. The solvent containing the crude extract was filtered and evaporated. MeOH was added to the extracted figs material in 500 mL, sonicated in 30 min, filtered and evaporated again. The procedure of adding MeOH and sonicating was repeated three times which yielded 7.73 g of the extract.
A total of 1.2 g of the extract was transferred into a new round flask and was then evaporated. This extract was partly insoluble in MeOH, therefore only MeOH layer was transferred into a new round flask and then evaporated which yielded 1.12 g and was saved for MPLC.
After NMR analyses the remaining F. insipida extract (6.61 g) was partitioned in a separation funnel between 250 mL DCM and 250 mL H2O. The obtained H2O layer yielded 2.5 g and was
freeze-dried overnight and purified by MPLC.
The prepared material was then divided into two parts (1.14 g each) and purified by MPLC. The run gradient was 100% A in 5 mins, then 30% B in 15 mins. In this step elutes
compounds of interest which were revealed by 1H-NMR. Then at 20-25 mins solvent B was
gradually increased from 30% to 100% for washing step. Then remains solvent B the same from 25-30 mins for equilibration. A total of 30 fractions from each purification step were collected and every second fraction were further analyzed in NMR.
Flowchart 5. Description of the extraction and purification protocols of the figs extract from F. insipida.
F. insipida Figs extract
(600 g)
Extraction in 1) 1000 mL of
DCM/MeOH (50:50) 2) 500 mL of MeOH (× 3)
Extracts combined and evaporated (7.73 g) 1.12 g purified by MPLC Biotage Sfär C18, 12 g, 100 Å, 30 µm 0-5 min: 100% A, 5-55 min: 100% B, 55-60 min: 100% B 6.61 g extraction with LLE 250
mL DCM and 250 mL H2O H2O layer freeze-dried (2.5 g) 1H-NMR 60 fractions collected (RA.03) 1.14 g purified twice by MPLC Biotage Sfär C18, 12 g, 100 Å, 30 µm 0-5 mins: 100% A, 5-15 mins: 30% B, 20-25 mins: 30-100% B, 25-30 mins: 100% B
30 fractions collected each (RA.06 and RA.07)
3.6 Bioassay
Agar plates were prepared by suspending 19.5 g of potato glucose agar in 500 ml bottle with 500 mL H2O. This bottle was autoclaved at 121 °C for 15 mins and was added in agar plates.
A small amount of Candida albicans was streaked onto the agar plate which was then incubated at 37 °C for 24 hours. Thereafter, approximately six distinct colonies were transferred from the agar plate into a sterilized falcon tube containing 3 mL phosphate buffered saline (PBS).
From this solution 1.5 mL was transferred into a cuvette and diluted with PBS until the absorbance measurement in 600 nm was 0.597. From this medium 1 mL was transferred from a cuvette into a new falcon tube and diluted with 11.21 mL of PBS to reach a concentration of 1,000,000 CFU/mL. To create a solution consists of both growth medium and yeast medium a 1:20 dilution was performed twice resulting to a concentration of 2500 CFU/mL.
Only in the first column (well A to H) 90 µl of the growth medium was added and then 50 µl of the same growth medium was added to the rest. Furthermore, 10 µl of chlorogenic acid (23) was added to well A and B in a concentration of 1280 µg/ml. The same volume and concentration of methyl chlorogenate (24 and 25) was added to well C and D. In well E and F 10 µl of amphotericin B was added in a concentration of 1280 µg/ml and lastly 10 µl of 50% DMSO was added to well G and H. Thereafter, a serial dilution was performed by transferring 50 µl from each well. Finally, 50 µl of growth media containing yeast was added to all wells and the plate was incubated at 37 °C for 24 hours.
4. Results
4.1 Small-scale analyses
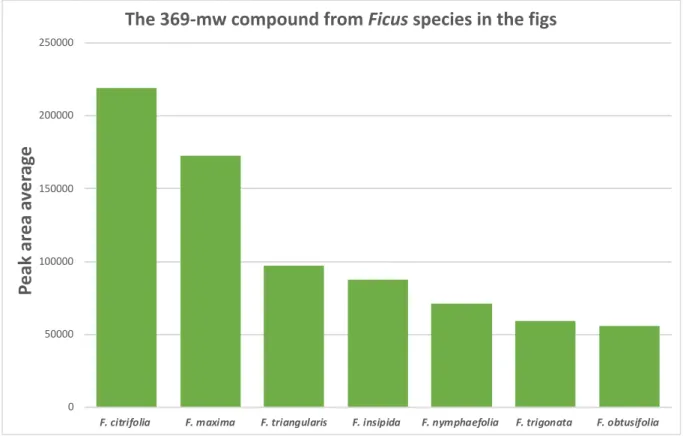
Figure 4 presents the peak area average for the 369-mw compound in the figs from different
Ficus species including F. citrifolia (n = 8), F. obtusifolia (n = 6), F. insipida (n = 6), F. triangularis (n = 4), F. maxima (n = 3), F. nymphaefolia (n = 3) and F. trigonata (n = 1).
Figure 4. The peak area average of the 369-mw compound in the figs from Ficus species.
The peak area average of the 369-mw compound in the figs from F. citrifolia (collected from different trees) across pollination stages (A to E) is presented in Figure 5 and 6. Figure 7 presents the peak area average of the 369-mw compound in the figs from F. obtusifolia. These analyses were preliminary for detecting the 369-mw compound across pollination stages. The found pattern needed to be further studied to be ensured.
0 50000 100000 150000 200000 250000
F. citrifolia F. maxima F. triangularis F. insipida F. nymphaefolia F. trigonata F. obtusifolia
Pe ak a re a a ve ra ge
Figs in time-series A) are pre-receptive, in time-series B) figs are receptive but not pollinated, in time-series C) figs are a few days after pollination, in time-series D) figs are approximately ten days after pollination and in time-series E) figs are approximately three weeks after pollination.
Figure 5. The peak area of the 369-mw compound in F. citrifolia collected from bv#306, at different collection
Figure 6. The peak area of the 369-mw compound in F. citrifolia collected from bv#307, at different collection
days (0, 7, 12, 17 and 28).
Figure 7. The peak area of the 369-mw compound in F. obtusifoliaat different collection days (0, 4, 9, 16 and 33).
4.2 Time-series analyses
More accurate analyses were required to ensure the found pattern in time-series samples for the detection of the 369-mw compound across pollination stages. The analyses were performed with two replicates from time-series A for F. citrifolia and five replicates from time-series B-C. Histograms in Figure 8 and 9 presents the peak area average for the 369-mw compound at different collection days.
Figure 8. The peak area average of the 369-mw compound in F. citrifolia collected from bv#306 at different
Figure 9. The peak area average of the 369-mw compound in F. citrifolia collected from bv#307 at different
collection days across different pollination stages.
Figure 10 presents the peak area averages for five replicates from F. obtusifolia in each time-series after LC-MS analyses. Standard error is also plotted in each graph as error bars to ensure the reliability of the mean value which provides information about how representative the data is for a population mean.
Figure 10. The peak area average of the 369-mw compound in F. obtusifolia at different collection days across
different pollination stages.
The peak area average of the 369-mw compound from the pooled sample in F. citrifolia collected from different trees and F. obtusifolia is presented in Figure 11.
Figure 11. The peak area average of the 369-compound based on the pooled sample in different species.
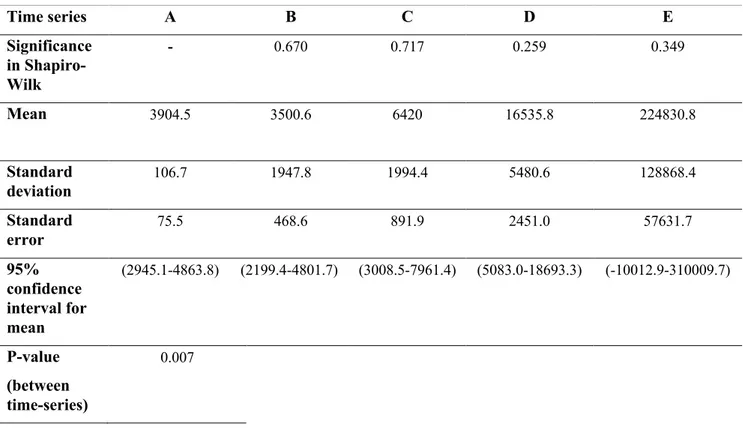
4.2.1 Statistical analyses
Shapiro-Wilk test for each data set is presented in Tables 7, 8 and 9. The null hypothesis assumes that the data is normally distributed. If the obtained significance value from Shapiro-Wilk is higher than 0.05 which is the chosen significance value, then the null hypothesis is accepted. In this case for each data set the value is higher than 0.05 and therefore the data is normally distributed.
The null hypothesis for ANOVA test assumes that the concentration of the 369-mw compound is the same across pollination stages and the alternative hypothesis assumes that the
concentration of the 369-mw compound varies across pollination stages. The p-value for different species is presented in Table 7, 8 and 9.
Table 7. Normality test and statistic test result for F. citrifolia bv#306.
Time series A B C D E Significance in Shapiro-Wilk - 0.670 0.717 0.259 0.349 Mean 3904.5 3500.6 6420 16535.8 224830.8 Standard deviation 106.7 1947.8 1994.4 5480.6 128868.4 Standard error 75.5 468.6 891.9 2451.0 57631.7 95% confidence interval for mean (2945.1-4863.8) (2199.4-4801.7) (3008.5-7961.4) (5083.0-18693.3) (-10012.9-310009.7) P-value (between time-series) 0.007
Table 8. Normality test and statistic test result for F. citrifolia bv#307.
Time series A B C D E Significance in Shapiro-Wilk - 0.767 0.156 0.643 0.452 Mean 2296 7219.6 13799.8 123545 270628.4 Standard deviation 700.0 1316.3 1308.3 28583.3 78263.8 Standard error 495.0 588.6 585.1 12782.8 35000.6 95% (-3993.5 -8585.5) (5585.1-8854.0) (12175.2-15424) (88054.1-159035.8) (173451.0-367805.7)
interval for mean P-value (between time-series) <0.001
Table 9. Normality test and statistic test result for F. obtusifolia.
Timeseries A B C D E Significance in Shapiro-Wilk 0.078 0.903 0.616 0.028 0.472 Mean 6696.2 4704.2 8615.6 25472.6 100834.8 Standard deviation 2087.4 867.3 2945.6 8179.9 45045.4 Standard error 933.5 387.8 1317.3 3658.2 20144.9 95% confidence interval for mean (4104.3-9288.0) (3627.2-5781.1) (4958.1-12273.0) (15315.7-35629.4) (44903.4-156777.1) P-value (between time-series) <0.001
4.3 GNPS
In the GNPS library, 16 hits were similar to the MS/MS data from different Ficus species (figs extract). The most common class of compounds in Ficus is flavonoid which is expected due to the chemistry of Ficus (Lansky et al., 2008). GNPS found seven matches of flavonoid compounds as bioactive metabolite, other common compounds are fatty acid and chlorogenic acid. Terpenoid, nucleosides and alkaloids also exist in a few Ficus species according to GNPS.
Table 10. GNPS summarized results.
Ficus species Hits (class) Structure
F. citrifolia F. nymphaefolia F. obtusifolia F. triangularis F. insipida (-)-Epicatechin (Flavonoid) F. citrifolia F. nymphaefolia F. obtusifolia Biochanin_A (Isoflavonoid)
F. citrifolia (+)-Catechin (Flavonoid)
F. obtusifolia F. trigonata Cinnamtannin A3 (Flavonoid) OH HO O HO OH OH O O OH OH O OH HO O OH OH HO O O O OH HO O OH HO O OH HO HO OH OH HO OH OH HO OH OH HO OH HO OH OH HO OH HO OH OH
F. trigonata Taxifolin (Flavonoids)
F. insipida Rutin (Flavonoids)
F. insipida Phlorizin (Flavonoid)
F. citrifolia F. trigonata F. nymphaefolia F. insipida -[5-[[4-[5- [acetyl(hydroxy)amino]pentylamino]- 4-oxobutanoyl]- hydroxyamino]pentylamino]-4-oxobutanoic acid (Fatty acid)
O O HO OH OH OH OH O O O O O O OH OH HO OH HO HO OH HO OH OH O O O OH OH HO HO HO OH OH O N N H O O N HN O O OH OH OH
F. insipida Jasmonic Acid (Fatty acid) F. citrifolia 2,4-dihydroxy-6-(hydroxymethyl)-3- [(2E,6E)-3,7,11-trimethyldodeca-2,6,10-trienyl]benzaldehyde (Phenol lipid) F. obtusifolia F. trigonata F. nymphaefolia F. insipida F. triangularis
Chlorogenic acid (Organooxygen
Compounds)
F. nymphaefolia
F. insipida
Lamalbid (Terpenoid)
F. insipida Methylthioadenosine (Nucleoside)
O O OH OH O OH HO O OH OH O HO HO HO OH O OH OH O O HO HO HO OH O O HO O S O N N N N H2N HO OH
F. triangularis Pheophorbide A (Alkaloid)
F. triangularis Sorbitol 6-phosphate
(Monosaccharide phosphate)
4.4 Large-scale analyses
4.4.1 NMR analyses
1H NMR spectra for MeOH layer from F. obtusifolia showed many peaks indicating that these
fractions are not pure because the separation was only performed by MPLC. The spectra confirmed the expected chemistry in Ficus species, for example in fraction 33 many signals were detected at !H = 6-9 indicating that this fraction contains aromatic compounds. Protons at
!H = 12.0 (Figure 12) indicates a proton in flavonoids which is near to two oxygen atoms and
because of the intra-molecular hydrogen bonding this proton is deshielded in the spectra. There are also signals in aliphatic region at !H = 0.9-1.5 and the signal at !H = 3.3-4.5 indicates proton
bound to an electronegative atom such as oxygen which is likely because glycosylated compounds are common in Ficus. Solvent peak showed at !H = 2.5 for dimethyl sulfoxide-d6
>99.8 atom% D which have a hygroscopic property and the absorbed water detects at !H = 3.45
(broad signal). N N HN O OH N O O OH O P O OH OH OH OH OH OH HO
A similar spectrum as for fraction 33 obtained from other fractions from MeOH layer and because these fractions contained only flavonoids no further analyses were performed.
Figure 12. 1H NMRspectra for fraction 33 from F. obtusifolia figs extract (MeOH layer).
However, 1H NMR revealed interesting results from H
!O layer extract from F. obtusifolia. Fractions 10, 11 and 12 showed similar spectra (Figure 13), these fractions contain the 369-mw compound. This compound is characterized by so called anomeric protons at !H = 5.19 which
is bounded to a glucose molecule near to two oxygen atoms and is therefore deshielded. The signal for glucose protons detects at !H = 3.5 . Fractions 10, 11 and 12 were combined for
Figure 13. 1H NMRfor fraction 11 from F. obtusifolia (H
!O layer).
1H NMR for fractions 13-25 from F. obtusifolia (H
!O layer) showed also many unknown peaks (Figure 14), these fractions were combined to purify the unknown compounds in HPLC and to identify their chemical structure.
Figure 14. 1H NMRfor fraction 13 from F. obtusifolia figs extract (H
4.4.2 Structure elucidation
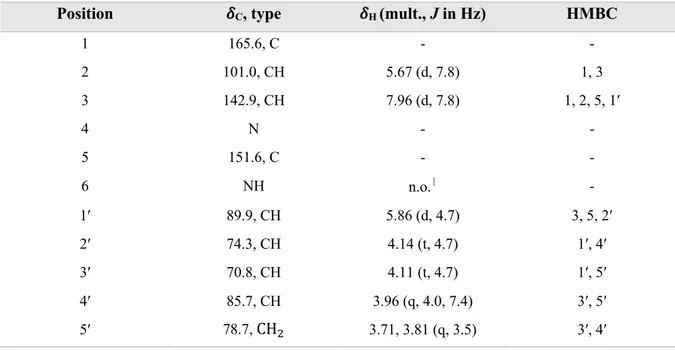
Fraction RA.04.10 contained a mixture of two compounds, uridine (17) and trigonelline (18) as shown in Figure 15. Uridine is a nucleoside that consists of a 5-membered sugar unit and an uracil unit. The sugar unit consists of one CH! group (methylene), three CHO groups, one anomeric proton and three hydroxy groups. The uracil unit consists of two CH groups (methine), one tertiary amine and one imide group.
Figure 16 presents 1H NMR for (17), protons from sugar unit are shown in Table 12 as H-1′,
H-2′, H-3′, H-4′ and H-5′. Protons from uracil unit are shown as H-2 and H-3. Imide proton H-6 was not observed because of so called proton-deuterium exchange effect which is possible to occur in methanol-d4 >99.5 atom% D.
Figure 15. Uridine (17) and trigonelline (18) structures.
HO HO HO O N O NH O 6 5 4 3 2 1 1′ 2′ 3′ 5′ 4′ 17 18 N+ O -O 1 2 3 4 5 6 1′ 2′
Figure 16. 1H NMR for uridine (17).
Table 12. NMR spectroscopic data for uridine (17) in methanol-d4 >99.5 atom% D.
Position !C, type !H (mult., J in Hz) HMBC
1 165.6, C - - 2 101.0, CH 5.67 (d, 7.8) 1, 3 3 142.9, CH 7.96 (d, 7.8) 1, 2, 5, 1′ 4 N - - 5 151.6, C - - 6 NH n.o.1 - 1′ 89.9, CH 5.86 (d, 4.7) 3, 5, 2′ 2′ 74.3, CH 4.14 (t, 4.7) 1′, 4′ 3′ 70.8, CH 4.11 (t, 4.7) 1′, 5′ 4′ 85.7, CH 3.96 (q, 4.0, 7.4) 3′, 5′ 5′ 78.7, CH! 3.71, 3.81 (q, 3.5) 3′, 4′ 1 Not observed
The anomeric proton is presented as H-1′, this proton is more deshielded than a regular anomeric proton because it is near to one oxygen and one nitrogen atom. C-1′ is also deshielded as shown in HSQC spectra (Figure B1 in appendix). The splitting of H-4′ and H-5′ was a clue to confirm their position in the molecule.
Carbons C-2 and C-3 at !" = 101.0 and 142.9 are deshielded which indicates the presence of double bound in a different ring system. This was confirmed because H-2 and H-3 showed a strong cis coupling to each other (J = 7.8 Hz).
COSY showed a coupling between H-2 and H-3 meaning that they are near to each other in the uracil unit and it showed also a coupling between H-1′ and H-2′ (Figure B2 in appendix).
HMBC spectra provides information about two-three bond correlation between proton and carbon atoms as shown in Figure B3 in appendix. The same data is summarized in Figure 17 showing several arrows in uridine, for example red arrows show a correlation from H-2, green show a correlation from H-3, dark blue show a correlation from H-1′, pink show a correlation from H-2′, light blue show a correlation from H-3′, orange show a correlation from H-4′ and brown show a correlation from H-5′.
HO HO HO O N O NH O 6 5 4 3 2 1 1′ 2′ 3′ 5′ 4′
Uridine derivatives were isolated from the seeds of Lepidium apetalum (Brassicaceae). The NMR data was compared to confirm the isolation of uridine from F. obtusifolia (Li et al., 2018).
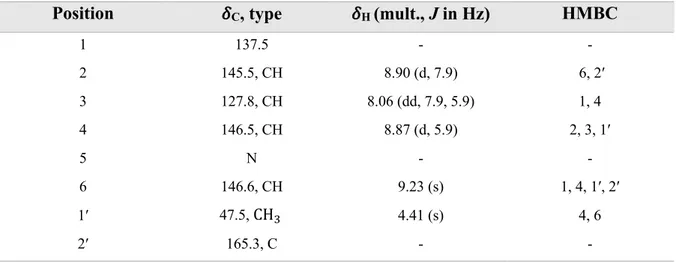
Trigonelline (18) is an alkaloid characterized by a pyridine ring with four aromatic protons and one ester group (Figure 15). H-2, H-3, H-4 and H-6 were detected in aromatic region but are more deshielded compared to protons in a normal benzene ring because the existence of a nitrogen atom in the ring.
H-2 showed ortho coupling at (J = 7.9 Hz), H-3 showed ortho and meta couplings at (J = 5.9 and 7.9 Hz) and H-4 showed meta coupling (J = 5.9 Hz). A singlet peak for H-6 indicates that this proton is not near to other protons in the molecule.
Table 13. NMR spectroscopic data for trigonelline (18) in methanol-d4 >99.5 atom% D.
Position !C, type !H (mult., J in Hz) HMBC
1 137.5 - - 2 145.5, CH 8.90 (d, 7.9) 6, 2′ 3 127.8, CH 8.06 (dd, 7.9, 5.9) 1, 4 4 146.5, CH 8.87 (d, 5.9) 2, 3, 1′ 5 N - - 6 146.6, CH 9.23 (s) 1, 4, 1′, 2′ 1′ 47.5, CH" 4.41 (s) 4, 6 2′ 165.3, C - -
The coupling constant for protons was helpful to identify 18 by providing information about their position in the pyridine ring and the existence of a positively charged nitrogen atom.
Signal from H-1′ indicated a methyl group bounded to a nitrogen and also HMBC confirmed this by correlation of H-1′ to C-4 and C-6.
Because trigonelline consists of a positively charged nitrogen atom, it is also likely for this molecule to consist a negatively charged atom for a total neutral charge. In this case the negatively charged atom is an oxygen atom in the carboxylate group which was identified as
C-2′at !" = 165.5 from HMBC spectra.
COSY spectra revealed that H-3 is near to H-2 and H-4 which also matches the data from 1H
Figure 19. HMBC in trigonelline (18).
The structure of 18 was supported by a previous study; this compound was isolated from a fruit extract of Balanites aegyptica (Zygophyllaceae) (Farag et al., 2015).
Fraction RA.05.34 contained 70-80 % pure form of abscisic acid (19) (Figure 20), it belongs to a specific class of compound known as sesquiterpene that consists of three double bonds, four methine groups, four methyl groups, one methylene group, one ketone group, one hydroxy group and one carboxylic acid group.
Figure 20. Structure of abscisic acid (19).
N+ O -O 1 2 3 4 5 6 1′ 2′ O OH OH O 1 2 3 5 6 7 8 9 10 12 13 14 15 4 11 19
Figure 21. 1H NMR spectra for abscisic acid (19).
Table 14. NMR spectroscopic data for abscisic acid (19) in dimethyl sulfoxide-d6 >99.8 atom% D.
Position !C, type !H (mult., J in Hz) HMBC
1 78.4, C - - 2 41.2, C - - 3 49.3, CH! 2.11/2.52 (d, 12.0) 2, 4, 12, 13 4 197.1, C - - 5 125.8, CH 5.81 (s) 1, 2, 14 6 163.1, C - - 7 137.2, CH 6.24 (d, 15.9) 1, 6, 8, 9 8 127.1, CH 7.71 (d, 15.9) 1, 7, 9, 10, 15 9 149.2, C - - 10 118.2, CH 5.67 (s) 8, 11, 15 11 166.9, C - - 12 23.07/23.88, CH" 0.92/0.96 (s) 1, 2, 3, 13 13 23.07/23.88, CH" 0.92/0.96 (s) 1, 2, 3, 4, 12 14 19.0, CH" 1.82 (s) 1, 5, 6 15 20.7, CH" 1.97 (s) 8, 9, 10
H-7 and H-8 showed a strong trans coupling (J = 15.9 Hz) and the chemical shift for these protons and carbons from HSQC indicates for an alkene. Signals from H-5 and H-10 indicates for double bond which was supported by 1H NMRdata and HSQC. Positions for H-5 and H-10
were determined by HMBC.
H-12, H-13, H-14 and H-15 presents methyl groups in the molecule and the peak integration showed three protons. In addition, this was supported by 1H NMR which showed typical
chemical shift for aliphatic methyl group.
H-3 showed a signal in aliphatic region but deshielded compared to a methyl group which is typical for methylene group. These protons detect at !H = 2.11 and 2.52 and are bonded to the
same carbon atom due to the same carbon shift in the HSQC spectra.
The coupling constant indicates also for methylene group which showed geminal coupling (J = 12.0 Hz). This coupling is typical for protons in methylene group if they existed in different chemical environment. In this case these two protons bind to a carbon in a ring system which provides different chemical environment for these protons. Therefore, two signals for these protons were detected in 1H NMR.
COSY identified which protons are coupled for example there are coupling between H-7 and H-8, between H-10 and H-15 and finally between H-5 and H-14 (Figure B8). HMBC data for
Figure 22. HMBC for abscisic acid (19).
A similar sesquiterpene was isolated from the roots of Codonopsis pilosula (Campanulaceae) called as compound 1 in the literature, its spectroscopic data was compared to abscisic acid (Jiang et al., 2016).
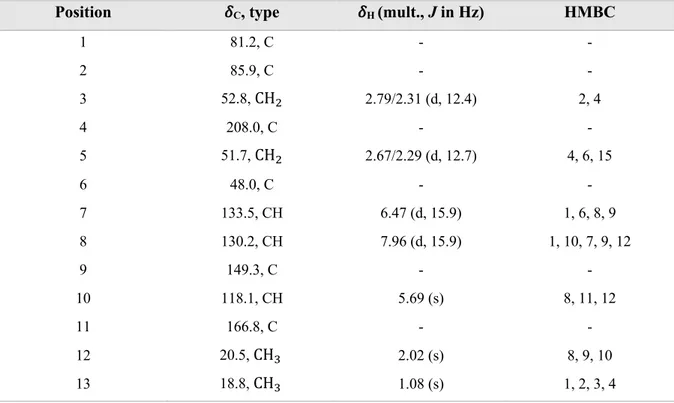
Fraction RA.05.26 contained 70-80% pure form of phaseic acid (20) and it is also a sesquiterpene as shown in Figure 23. Phaseic acid consists of two double bonds, three methine groups, three methylene groups, three methyl groups, one ketone group, one ether group, one hydroxy group and one carboxylic acid group.
Figure 23. Structure of phaseic acid (20).
Signal from H-7 and H-8 in 1H NMR indicates for an alkene; this is also confirmed by their
O OH OH O 1 2 3 5 6 8 9 10 12 13 14 15 4 11 7 OH O OH O O 4 3 2 1 7 8 9 10 11 5 6 12 13 14 15 20
H-10 indicated for double bond due to the carbon chemical shift and COSY showed a coupling between H-10 and H-12 (Figure B11).
Figure 24. 1H NMR spectra for phaseic acid (20).
Table 15. NMR spectroscopic data for phaseic acid (20) in methanol-d4 >99.5 atom% D.
Position !C, type !H (mult., J in Hz) HMBC
1 81.2, C - - 2 85.9, C - - 3 52.8, CH! 2.79/2.31 (d, 12.4) 2, 4 4 208.0, C - - 5 51.7, CH! 2.67/2.29 (d, 12.7) 4, 6, 15 6 48.0, C - - 7 133.5, CH 6.47 (d, 15.9) 1, 6, 8, 9 8 130.2, CH 7.96 (d, 15.9) 1, 10, 7, 9, 12 9 149.3, C - - 10 118.1, CH 5.69 (s) 8, 11, 12 11 166.8, C - - 12 20.5, CH" 2.02 (s) 8, 9, 10 13 18.8, CH" 1.08 (s) 1, 2, 3, 4
14 15.2, CH" 0.88 (s) 1, 5, 6, 15
15 76.3, CH! 3.77/3.53 (dd, 12.0) 1, 2, 5, 6, 14
Protons H-3 at !H = 2.79 and 2.31 bind to the same carbon atom, which was indicated by HSQC
and these protons showed a geminal coupling (J = 12.4 Hz). This applies also for protons H-5 at !H= 2.67/2.29 and H-15 !H = 3.77/3.53 methylene protons had the same carbon shift
indicating that they bond to the same carbon and the coupling constant from 1H NMR indicates
for a geminal coupling. COSY showed a cross coupling between H-5 and H-15 which is possible in a ring system.
Figure 25. HMBC for phaseic acid (20).
The structure for 20 was confirmed by the literature which also was isolated from the seeds of
Robinia pseudoacacia (Fabaceae) (Hirai et al., 2003).
Fraction RA.05.18 contained a mixture of two compounds, dihydro-phaseic acid (21) and 2-[4-(3-hydroxypropyl)-2-methoxyphenoxy]-1,3-propanediol (22) (Figure 26).
Several protons chemical shifts in 1H NMR spectra for 21 were similar to phaseic acid such as
H-7, H-8, H-10, H-12, H-13, H-14 and H-15 due to the similarity in the structure.
OH
O
OH
O
O
4 3 2 1 7 8 9 10 11 5 6 12 13 14 15
Figure 26. Structure of dihydro-phaseic acid (21) and
2-[4-(3-hydroxypropyl)-2-methoxyphenoxy]-1,3-propanediol (22).
Figure 27.1H NMRspectra for dihydro-phaseic acid (21).
Table 16. NMR spectroscopic data fordihydro-phaseic acid (21)in methanol-d4 >99.5 atom% D. Position !C, type !H (mult., J in Hz) HMBC
1 82.4, C - - 2 86.9, C - - 3 45.1, CH! 2.00/1.70 (dd, 13.8, 2.7) 1, 2, 4, 5 4 65.1, CH 4.08 (m) - 5 43.7, CH! 1.62 (ddd, 12.0, 9.2, 1.9) 4, 15 6 48.0, C - - 7 134.3, CH 6.47 (d, 15.9) 1, 8, 9 OH O OH O HO 4 3 2 1 7 8 9 10 11 5 6 12 13 15 O O OH OH HO 1 2 3 1′ 2′ 3′ 4′ 5′ 6′ 1′′ 2′′ 3′′ 4′′ 21 22 14
8 131.0, CH 7.94 (d, 15.9) 1, 7, 9, 11, 12 9 150.7, C - - 10 118.2, CH 5.73 (s) 8, 11, 12 11 168.7, C - - 12 20.3, CH" 2.05 (s) 8, 9, 10 13 18.8, CH" 1.11 (s) 1, 2, 3, 4, 14 15.4, CH" 0.89 (s) 1, 4, 5, 6, 15 15 76.4, CH! 3.77/3.68 (dd, 9.1, 5.7) 1, 2, 5, 6, 14
Differences in 21 occurs in C-4 which is bonded to a hydroxy group and a hydrogen atom while in 20 C-4 have a ketone group. In 21, H-3 and H-5 are shielded compared to H-3 and H-5 in 20 and this is because a ketone group is more deshielded compared to a hydroxy group which affect the chemical shift for protons and carbons in 21 and results in a deshielded H-3, H-5, C-3 and C-5. HSQC revealed that C-4 bind a hydroxy group because !"= 65.1 (Figure B13).
H-5 showed a geminal coupling (J = 12.0 Hz) which is typical for protons in methylene group. It also showed a coupling with H-4 (J = 9.0 Hz) indicating that H-5 is near to methine group. H-5 showed also so-called W-coupling (J = 1.9 Hz) indicating that H-5 is near to H-15. COSY confirmed also that H-4 is coupled to proton at H-3 (Figure B14).
Figure 28. HMBC for dihydro-phaseic acid (21)
OH O OH O HO 4 3 2 1 7 8 9 10 11 5 6 12 13 14 15
This compound was also isolated from the leaves of Ficus. consociate (Moraceae) therefore, the structure was supported by comparing NMR data (Dat et al., 2019).
The same fraction contained also a symmetric 1,4,5-disubstituted aromatic compound (22). This compound consists of three aromatic protons, one methoxy group, one CHO group, three hydroxy and five aliphatic methylene groups.
H-2′, H-3′ and H-6′ represent aromatic protons. Signal from H-4′ is sharp which is typical for methoxy group and peak integration showed that this signal is presented by three protons.
Three aliphatic methylene groups were near to each other and this was supported by COSY which showed that H-2 and H-3 are coupled, and H-1 and H-2 are coupled to each other (Figure B16).
Two aliphatic methylene groups were in the same chemical environment as shown in 1H NMR the integration of the peak at !H= 3.71 represents four protons in each methylene group. HSQC confirmed also that these protons are of methylene type (Figure B17).
Figure 29. 1H NMRspectra for 2-[4-(3-Hydroxypropyl)-2-methoxyphenoxy]-1,3-propanediol (22).
Table 16. NMR spectroscopic data for (22) in methanol-d4 >99.5 atom% D.
Position !C, type !H (mult., J in Hz) HMBC
1 31.8, CH! 2.59 (t) 2, 3, 1′, 6′, 2′ 2 34.6, CH! 1.78 (m) 1, 3, 1′ 3 61.3, CH! 3.52 (t) 1, 2 1′ 137.4, C - - 2′ 121.0, CH 6.69 (dd, 8.3, 1.4) 4′, 6′ 3′ 118.5, CH 6.94 (d, 8.3) 1′, 4′, 5′ 4′ 146.0, C - - 5′ 151.1, C - - 6′ 113.2, CH 6.81 (d, 2.0) 2′, 4′ 1′′ 82.3, CH 4.12 (m) 2′′, 4′ 2′′ 61.1, CH! 3.71 (t) 1′′, 3′′ 3′′ 61.1, CH! 3.71 (t) 1′′, 2′′ 4′′ 55.2, CH" 3.80 (s) 5′
H-2′ and H-3′ showed a strong ortho coupling (J = 8.3 Hz), H-2′ showed also a meta coupling with H-6′ (J = 1.4 Hz).
It was not clear if H-2′′ and H-3′′ were near a hydroxy group or carboxylic acid because of clear correlation in HMBC with carboxylic acid. To clarify this, LC-MS analysis was performed to obtain the molecular ion for this molecule which was 257.
A similar compound to 22 was isolated from the seeds of Onopordum acanthium (Asteraceae) (Tyumkina et al., 2009).
Figure 30. HMBC for 2-[4-(3-Hydroxypropyl)-2-methoxyphenoxy]-1,3-propanediol (22).
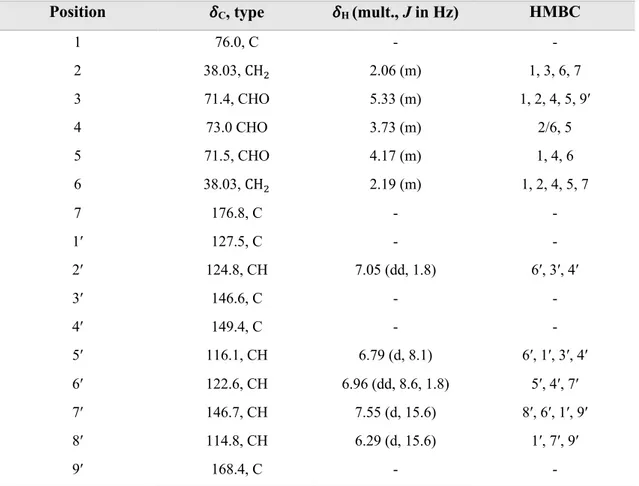
Fraction RA.09.17 contained a mixture of trans chlorogenic acid (23) and cis chlorogenic acid in 1 to 0.7 ratio (Figure 31). This compound consists of 1,3,4-disubstituted aromatic ring with three aromatic protons, five hydroxy groups, two methine groups, three CHO groups, two methylene groups, one ester group and one carboxylic acid group.
O
O
OH
OH
HO
1 2 3 1′ 2′ 3′ 4′ 5′ 6′ 1′′ 2′′ 3′′ 4′′ 20 OH OH O O HO HO OH O OH 1 2 3 4 5 6 7 1′ 2′ 3′ 4′ 5′ 6′ 7′ 8′ 9′Figure 32. 1H NMR spectra for trans chlorogenic acid (23).
Table 17. NMR spectroscopic data for trans-chlorogenic acid (23) in methanol-d4 >99.5 atom% D. Position !C, type !H (mult., J in Hz) HMBC
1 76.0, C - - 2 38.03, CH! 2.06 (m) 1, 3, 6, 7 3 71.4, CHO 5.33 (m) 1, 2, 4, 5, 9′ 4 73.0 CHO 3.73 (m) 2/6, 5 5 71.5, CHO 4.17 (m) 1, 4, 6 6 38.03, CH! 2.19 (m) 1, 2, 4, 5, 7 7 176.8, C - - 1′ 127.5, C - - 2′ 124.8, CH 7.05 (dd, 1.8) 6′, 3′, 4′ 3′ 146.6, C - - 4′ 149.4, C - - 5′ 116.1, CH 6.79 (d, 8.1) 6′, 1′, 3′, 4′ 6′ 122.6, CH 6.96 (dd, 8.6, 1.8) 5′, 4′, 7′ 7′ 146.7, CH 7.55 (d, 15.6) 8′, 6′, 1′, 9′ 8′ 114.8, CH 6.29 (d, 15.6) 1′, 7′, 9′ 9′ 168.4, C - -
1H NMRspectra shows typical signals for compound 23, H-7′ and H-8′ showed a strong trans
coupling (J = 15.6 Hz) and were also coupled in COSY (Figure B19).
Aromatic protons such as H-2′ showed meta coupling (J = 1.8 Hz), H-5′ showed ortho coupling (J = 8.1 Hz) and H-6′ showed both meta and ortho coupling (J = 8.6 and 1.8 Hz).
COSY showed a coupling between H-3, H-2 and H-3, H-4. Carbon chemical shift for H-4 and H-5 from HSQC indicated the presence of oxygen atom and LC-MS analyses revealed the molecular ion for this compound which was 355. Chlorogenic acid has been isolated from stem barks of Euonymus alatus (Celastraceae) and from the leaves of Phyllostachys edulis (Poaceae) (Jin et al., 2005; Kweon et al., 2001).
Figure 33. HMBC for trans chlorogenic acid (23).
It is believed that the minor product in this fraction is the cis isomer of chlorogenic acid because
1H NMRshowed similar signals as for the major product except for a coupling constant which
showed a strong cis coupling (J = 12.0 Hz). Also, LC-MS analyses did not show molecular ion for another compound.
OH OH O O HO HO OH O OH 1 2 3 4 5 6 7 1′ 2′ 3′ 4′ 5′ 6′ 7′ 8′ 9′
Fraction RA.09.29 contains a 50:50 mixture of methyl chlorogenate both trans (24) and cis (25) isomers (Figure 34). This compound consists of 1,3,4 disubstituted aromatic ring with three aromatic protons, five hydroxy groups, two methine groups, three CHO groups, two methylene groups, two esters groups one with methoxy group.
Figure 34. Structure of trans methyl chlorogenate (24) and cis methyl chlorogenate (25).
Figure 35.1H NMR spectra for trans methyl chlorogenate (24). OH OH O O HO HO O O OH 1 2 3 4 5 6 1′ 2′ 3′ 4′ 5′ 6′ 7′ 8′ 9′ 24 25 O O HO HO O O OH 1 2 3 4 5 6 8′ 9′ OH OH 7′ 1′ 2′ 3′ 4′ 5′ 6′ 7 8 7 8
Table 18. NMR spectroscopic data for trans methyl chlorogenate (24) in methanol-d4 >99.5 atom% D. Position !C, type !H (mult., J in Hz) HMBC
1 75.5, C - - 2 37.6, CH! 2.03 (m) 6, 4,1,7 3 71.4, CHO 5.27 (m) 4, 1, 9′ 4 72.0 CHO 3.74 (m) 2/6 5 69.8, CHO 4.13 (m) 4 6 37.6, CH! 2.20 (m) 2,1,4,7 7 175.2, C - - 8 52.4, CH3 3.70 (s) 7 1′ 127.5, C - - 2′ 114.8, CH 7.07 (dd, 1.9) 7′,4′,3′ 3′ 145.2, C - - 4′ 149.5, C - - 5′ 116.2, CH 6.79 (d, 8.0) 6′,1′,4′,3′ 6′ 122.6, CH 6.96 (dd, 8.0, 1.9) 2′,7′,4′ 7′ 146.9, CH 7.53 (d, 15.6) 2′,6′,1′,9′ 8′ 115.3, CH 6.23 (d, 15.6) 1′,9′ 9′ 167.9, C - -
Signals from H-2′, H-5′ and H-6′ represents aromatic protons. H-2′ showed a meta coupling (J = 1.9 Hz), H-5′ showed ortho coupling (J = 8.0 Hz) and H-6′ showed both ortho and meta couplings (J = 8.0 and 1.9 Hz).
Signals from hydroxy groups are not observed due to proton-deuterium exchange effect which occurs in methanol-d4 >99.5 atom% D.
H-7′ and H-8′ showed a strong trans coupling (J = 15.6 Hz), also these protons are coupled in COSY (Figure B22).
H-3 showed a correlation to C-9′ in HMBC (Figure 23Ba and b) and COSY showed a correlation from H-3 to H-4 and from H-2 to H-5. The chemical shift for C-4 and C-5 indicates for a hydroxy group bonded to the carbon atom.
!# = 3.70 and !$= 52.4 indicates for a methoxy group which was also confirmed by HMBC because methoxy protons only showed one correlation to C-7. The chemical shift for H-2 and H-6 revealed that these protons represent methylene groups.
This compound has been isolated from the bark of Ficus microcarpa (Moraceae) and the NMR data was similar to the obtained data (Ao et al., 2010; Deyama et al., 1987; Ibekwe et al., 2018).
Figure 36. HMBC for trans methyl chlorogenate (24).
The same fraction contained cis methyl chlorogenate (25) with similar signals in NMR spectra. Integration of each signal was helpful to distinguish between the cis and trans isomer of this compound. OH O O HO HO O O OH 1 2 3 4 5 6 1′ 2′ 3′ 4′ 5′ 6′ 7′ 8′ 9′ 7 8 OH
1H NMRis similar to 24 representing three aromatic protons which are H-2′, H-5′ and H-6′ with typical coupling constant as presented in Table 19. The only difference is the cis coupling between H-7′ and H-8′ (J = 12.2-12.5 Hz) and these protons were coupled also in COSY (Figure B25). Other signals were as described for trans isomer.
Figure 37. 1H NMR spectra for cis methyl chlorogenate (25).
Table 19. NMR spectroscopic data for cis methyl chlorogenate (25) in methanol-d4 >99.5 atom% D. Position !C, type !H (mult., J in Hz) HMBC
1 75.9, C - - 2 37.6, CH22 2.10 (m) 1, 4, 7 3 71.4, CHO 5.27 (m) 2, 9′ 4 72.3 CHO 3.68 (m) 2/6, 3 5 70.1, CHO 4.07 (m) 6 37.6, CH2 2.03 (m) 2, 4, 5, 7 7 175.2, C - - 8 52.4, CH3 3.70 (s) 7