Department of Anatomy, Physiology and Biochemistry
The Mechanisms of TK1 Secretion in
Cancer Cells
Tabassom Moahjer Shojai
Independent project • 30 credits
Animal Science SLU 2019
The Mechanisms of TK1 Secretion in Cancer Cells
Tabassom Moahjer Shojai
Supervisor: Liya Wang, Swedish University of Agricultural Sciences, Department of Anat-omy, Physiology and Biochemistry
Assistant supervisor: Jun Mei (Vicky) Hu Frisk, Swedish University of Agricultural Sciences, De-partment of Anatomy, Physiology and Biochemistry
Examiner: Staffan Eriksson, Swedish University of Agricultural Sciences, Department of Anatomy, Physiology and Biochemistry
Credits: 30 credits
Level: Second cycle, A2E
Course title: Independent project in Animal Science
Course code: EX0870
Programme/education: Animal Science
Course coordinating department: Department of Anatomy, Physiology and Biochemistry
Place of publication: SLU
Year of publication: 2019
Online publication: https://stud.epsilon.slu.se
Keywords: Thymidine kinase 1 excretion, [3H]-dThd phosphorylation assay, exosome isolation, dot-blot chemiluminescence assay, cancer cell line
Swedish University of Agricultural Sciences Faculty of Veterinary Medicine and Animal Science Department of Anatomy, Physiology and Biochemistry
A seventy five percent increase in cancer incidence within 10 years is one of the major human health issues based on the World Health Organization (WHO) evaluation. Prevention of cancer through health screening was sug-gested by the WHO as a means of early detection of cancer. Thymidine kinase 1 (TK1) is one of the key enzymes for DNA replication and cell division, which could have a role in tumor formation and progression. Exosomes are extracellular vesicles which were recently shown to act as messengers of tu-mor cells to communicate with cells in the body. The aim of this study was to evaluate if TK1 was excreted via exosomes in a BJ tumor (BJ-T) cell line as well as BJ normal (BJ-N) cell line. Exosomes were isolated from media supernatants of BJ-T and BJ-N cells using ultracentrifugation and the final exosome preparations were resuspended in phosphate buffered saline. TK1 activity and concentration in the supernatants before and after ultracentrifu-gation as well as exosome samples were evaluated by [3H]-dThd phosphory-lation assay and dot-blot chemiluminescence assay, respectively. Specific ac-tivity of BJ-T exosome-derived TK1 was 16.9 times more than BJ-N exo-some-derived TK1, where there was also two times more TK1 concentration in BJ-T exosomes compared to BJ-N exosomes. In conclusion, TK1 excretion was via exosomes and exosome-derived TK1 could be a tumor biomarker for BJ-T cells. Furthermore in vitro and in vivo investigations are needed in order to evaluate whether TK1 could be a useful biomarker for tumor tissue and/or in clinical level.
Keywords: Thymidine kinase 1 excretion, [3H]-dThd phosphorylation assay,
exo-some isolation, dot-blot chemiluminescence assay, cancer cell line
Abstract
“If you have your health, if you have people in your life
to love, you are blessed. Slow down and enjoy the
sim-ple things in life.”
Joel Osteen
To my best family ever
To my devoted husband
To my beloved “Bah”
List of tables 9 List of figures 10 Abbreviations 12 1 Introduction 13 1.1 Cancer 13 1.2 Cell communication 13
1.3 Protein secretion approches 13
1.4 Exosomes and their role in cell communication 14 1.5 BJ-Tumor cells, BJ-Normal cells and cancer-associated fibroblasts (CAF) 15
1.6 Thymidine kinase 1 (TK1); Molecular structure and enzyme activity 15
2 Literature Review 16
2.1 TK1 and related disease 16
2.2 TK1 in normal and cancer cells 17
2.3 TK1 as a biomarker in cancers 17
2.4 Extracellular vesicle trafficking 18
2.5 Exosomes in normal cells and cancer cells 19
2.6 Exosomes and TK1 relation in cancer 19
3 Aim of Study 21
4 Materials and Methods 22
4.1 Cell lines and cell culture 22
4.2 Exosome isolation 22
4.3 Protein quantification 23
4.4 TK1 enzyme activity 24
4.5 TK1 presence proved by western blotting 25
4.6 TK1 presence proved by dot chemiluminescence assay 25
4.7 Statistical analysis 26 5 Results 27 5.1 Exosome isolation 27 5.2 Protein quantification 28 5.3 TK1 enzyme activity 29
Table of contents
5.4 Western blotting 33
5.5 Dot blot chemoiluminescence assay 34
6 Discussion and conclusion 40
References 45
Table 1. Centrifugation and ultracentrifugation optimizing setttings for exosome
isolation. 23
Table 2. Reaction mix contents for enzyme activity assay. 24 Table 3. Concentration factors in different BJ-N and BJ-T cells samples 27 Table 4. Protein quantification of BJ-T cells exosomes in different optimizing
settings. 28
Table 5. Protein quantification results of BJ-N and BJ-T exosome samples. 28 Table 6. TK1 activity and specific TK1 activity of samples in different optimizing
settings. 30
Table 7. TK1 activity and specific TK1 activity in BJ-N and BJ-T cell supernatant media
and exosome samples. 31
Table 8. ImageJ TK1 quantification results for three optimizing settings. 35 Table 9. TK1 concentration in BJ-N and BJ-T cells supernatant media before and after
ultracentrifugation and exosome samples based on dot blot results and
ImageJ analysis. 37
Figure 1. Some of known proteins and protein markers in the exosome. 14 Figure 2. Thymidine kinase 1 role in dTTP synthesis. 15 Figure 3. Exosome pellet appearance after ultracentrifugation (107,000 x g, 6 hours). 27 Figure 4. Specific exosome-derived TK1 activity of samples in different optimizing
settings. Comparison of exosome-derived TK1 activity in 1 ml of tumor cell supernatant media (A). Comparison of specific TK1 activity in 1 mg of total
tumor cell exosome protein(B) 30
Figure 5. Comparison of TK1 activity of BJ-N cell supernatant before and after ultracentrifugation and exosome samples in 1 ml of supernatant media(A). Comparison of TK1 activity of BJ-N and BJ-T cells exosome samples in 1 ml of supernatant media(B). Comparison of specific TK1 activity of BJ-N and BJ-T exosomes in 1 mg of total exosome protein (C). 32 Figure 6. Comparison of exosomic TK1 and non-exosomic TK1 in BJ-N cells(A) and
BJ-T cells (B) based on TK1 activity in supernatant (p mol/min/ml). 33 Figure 7. Western blot results of the optimizing steps with different centrifugation and
ultracen-trifugation settings. 34
Figure 8. Dot blot results of different optimizing settings. The first row is for the samples of the first optimizing setting, the second row represents the samples of the second optimizing setting and the third row shows the samples of third optimizing setting. TK1 recombinant protein was loaded in dilution series in the fourth row. Cytosolic BJ-T cells extract and PBS were loaded on the last row as a positive and negative control respectively. 35 Figure 9. TK1 concentration comparison between BJ-T cells supernatant media
before and after ultracentrifugation and exosome samples in three different
optimizing settings 36
Figure 10. Dot blot results of one set of samples. every samples run twice (the first row is the first repeat and the second row is the second repeat). Each repeat has 6 samples including (from left to right) BJ-N cell supernatant media before ultracentrifugation (NBU), BJ-N cell supernatant media after ultracentrifugation (NAU), BJ-N exosome (NEX), BJ-T cell supernatant media before ultracentrif-ugation (TBU), BJ-T cell supernatant media after
List of figures
ultracentrifugation (TAU) and BJ-T exosome (TEX). TK1 recombinant protein was loaded in dilution series in the third row. Cytosolic BJ-T cells extract and PBS were loaded on the last row as a positive and negative
control respectively. 37
Figure 11. TK1 concentration comparison in BJ-T and BJ-N supernatant media before and after ultracentrifugation and exosome samples. 38 Figure 12. TK1 concentration comparison in BJ-T and BJ-N exosome samples. 38 Figure 13. Comparison of the proportional concentration of exosome-derived TK1to non-exosome-derived TK1 in BJ-N and BJ-T cells. 39
Here is the meaning of used abbreviations and technical terms in this study.
Abbreviation Stands for/meaning
CAF CPM
Cancer associated fibroblast Count per minute
DC Dendritic cells
DMEM Dulbecco’s Modified Eagle’s Medium
DT Doubling time
FBS Fetal Bovine Serum
GAPDH Glyceraldehyde 3-phosphate dehydrogenase
MMP6 Matrix metallopeptidase 6
MVBs Multivesicular bodies
NC Nitrocellulose
NSCLC non-small-cell lung carcinoma
NT Nucleoside transport
PCNA Proliferating cell nuclear antigen
PVDF Polyvinylidene difluoride
SDS-PAGE Sodium dodecyl sulfate–polyacrylamide gel electrophoresis
STK1 Serum thymidine kinase 1
TBS tris-buffered saline
TBST Tween 20 + tris-buffered saline
TDP Thymidine diphosphate
TK1 Thymidine kinase 1
TMP Thymidine monophosphate
TMPK Thymidine monophosphate kinase
TTP Thymidine triphosphate
WHO World Health Organization
1.1 Cancer
Cancer is the second leading cause of human death worldwide, approximately 9.6 million deaths in 2018 based on the World Health Organization (WHO). The etiol-ogy of cancer is not well understood, and factors like poor diet, infections, risky behavioral etc, can increase the cancer risk. The WHO reports show increasing num-bers of death due to cancer compared to previous years (1). Today, different cancer treatments are available depending on various factors such as the cancer type and cancer stage. The treatment can be one step or multiple steps (combined therapy) (2). Lots of scientific centers, laboratories and universities work and collaborate to research cancer biology, including prospective cancer drugs and the treatment routes. Biologically at the molecular level, alterations in genetic and epigenetic char-acteristics of the cells are the leading causes of cancer. Although cells can repair themselves in different ways, some errors still remain and cause uncontrolled pro-liferation, apoptosis inhibition, cell migration and invasion (3).
1.2
Cell communication
Cells need to communicate with each other to be alive. Cell communication is needed to sustain individual cells as well as to work with other cells as a group, a tissue, an organ and the organism. Cell signaling as the method of communication can be between closely related neighboring cells and/or more distant cells. Extracel-lular signals transduce via internal/external receptors and different sets of intracel-lular signaling proteins and cells respond in different ways, which could be a short term response such as changing in metabolism, contraction or secretion, or a long term response such as gene expression, growth and death (4,5).
1.3
Protein secretion approaches
Exporting extra cellular components is one way to communicate. Cells can com-municate not only by cell-cell connections but also by secreted messengers (6).
There are two major cellular secretion routes: classical secretion and non-classical secretion. The classical route is started from ribosomes which make the primary proteins and the newly synthesized proteins pass through the endoplasmic reticulum and Golgi apparatus for modification and packaging into secretory vesicles, and fi-nally the proteins are excreted via exocytosis (7). The non-classical secretion con-sists of four routes: 1) direct translocation of proteins across membranes 2) blebbing 3) lysosomal secretion and 4) secretion by exosomes derived from multivesicular bodies (MVBs). Multivesicular bodies are one of the subsets of endosomes which are used not only for degradation of cytoplasmic protein by fusion to lysosomes but they can also fuse to the cytoplasmic membrane and release the exosome into the extracellular space (8).
1.4
Exosomes and their role in cell communication
The extracellular vesicles can be classified into three major groups based on their struc-ture: apoptotic bodies, microvesicles and ex-osomes. Extravesicular vesicles size can be in the range of 40-2,000 nm. Exosomes are bilayer vesicles derived from endolysosomal pathway, which can be 40-120 nm in size and are secreted by various cells (9). Alt-hough exosomes can be isolated from serum, body fluid and tissue culture media, most
ap-proaches to isolate them in research is done via isolation from supernatants of cul-tured serum-free cell media (6,10). All cells in multicellular organisms need to com-municate via the microenvironment and also comcom-municate with distant cells in order to maintain homeostasis. Exosomes carry different types of molecules like proteins and different RNAs, which can act as signaling molecules. Some proteins are ex-osome specific and present in almost all exex-osomes, and therefore they are used as general exosome markers (like CD9, CD63 and CD81). The exosomal protein con-tent can vary depending on the exosome’s prospective roles and functions. They can contain proteins which have roles in membrane trafficking like annexins, or they can have enzymes like glyceraldehyde 3-phosphate dehydrogenase (GAPDH). They can also carry adhesion proteins on their membranes such as various integrins. The fate of exosomes and their function is partially based on their content (internal mRNA and miRNA, and membrane proteins) (11). Exosomes as a communication tool can also be like a double-edged sword. On one hand, they can keep normal cells in touch, act as an antigen-presenting vesicles as well as induce antitumor immune responses, but on the other hand, they can also keep cancer cells in touch and pro-mote their capability to progress by induction of cancer cell migration, angiogenesis,
Figure 1. Some of known proteins and pro-tein markers in the exosome.
immune inactivation and immune suppression, which will be described in more de-tail in section 2.5 (6,9).
1.5
BJ - Tumor cells, BJ - Normal cells and
cancer-associ-ated fibroblasts (CAF)
BJ-N cell is a foreskin human derived fibroblast, which is mostly used for stable transfection studies (12) and as a control for its tumor version (BJ-T). BJ-T cells were immortalized via human telomerase reverse transcriptase. There are other can-cer-associated fibroblasts which are present in different types of cancer. Fibroblasts are able to make tumors by themselves but can also be altered as CAFs and promote tumorigenic features like facilitating tumor migration and invasion via angiogenesis, modifying the microenvironment (13). Thus, studying BJ-T cells can reveal some information regarding both fibroblast tumors and other tumor microenvironments.
1.6
Thymidine kinase 1; Molecular structure and enzymatic
activity
Thymidine kinase (TK) is a type of kinase in human and animal cells. There are two isoforms of TK de-tected in animal cells: TK1 mostly in the cytoplasm and TK2 in the mitochon-dria (14). TK1 adds a
phosphate group to thymidine to make it ready for the rest of deoxythymidine tri-phosphate (dTTP) synthesis, which is essential for DNA and cell proliferation (15). The activity of TK1 is higher in proliferating cells and reaches its highest level at the G1 phase/S-phase of the cell cycle and it decreases in the M phase (16). It can exist as a monomer with almost no function or act as a dimer, which has low activity or even a tetramer with the highest activity and a molecular weight of around 100kDa (15). Two pathways can provide nucleotides for DNA synthesis: the de
novo pathway and the salvage pathway. The salvage pathway reuses the degraded
DNA as a source of deoxyribonucleosides (dNs) while low molecule weight precur-sors are used in the de novo pathway (17). Figure 2 shows part of the salvage path-way in which TK1 has a role. Thymidine is imported into the cells by nucleoside transporters (NT) and then TK1 has a role in cytoplasm to make thymidine mono-phosphate from it (18).
2.1
TK1 and related diseases
Different mutations in genes could make a malfunction protein or even skip the pro-tein synthesis which leads to deficiency. It is known that mutations in the TK2 gene results in mitochondrial DNA depletion syndrome (myopathic form), but there is no known disease caused by TK1 deficiency (19). Although TK1 deficiency does not cause disease, there are some types of cancers (lung, liver, cervix) which were proved their association with TK1 elevation in terms of tumor growth rate (20). It is also shown that the thymidine kinase knockout mice (KO) has shorter life span than the normal mice which may due to kidney sclerosis and KO mice has different sali-vary gland secretions, elevated level of serum thymidine and significantly lower spleen lymphocyte cloning which changes the histological lymphoid pattern of spleen and all these shows abnormal immune system(21). Moreover, all diseases which cause cell proliferation such as inflammation could lead to TK1 elevation (17). Chen Z. and colleagues found out that by screening serum TK1 (STK1) in 11,880 persons that 83% of STK1-positive persons had various diseases from hep-atitis and helicobacter pylori-positive to benign and malignant cancers. They pin-pointed that more than 2 pM STK1 could be an indicator for the future malignancies occurrence (22). Particularly, it was shown that STK associates with different pa-rameters in heamatological cancers such as the clinical stage and the tumor burden (17). There are also some studies were done on serum TK and its role in solid can-cers and a review summarized them. It showed that STK has the statistically corre-lation with breast cancer stage and the total tumor TK concentration is significantly higher in the recurrent cases than the non-recurrent ones. It was revealed that there is a significant difference between STK level of the metastatic colorectal cancer pa-tients and the normal controls. In addition, investigation in the lung cancer eluci-dated STK role as a prognostic marker for the non-small-cell lung carcinoma (NSCLC) (23).
2.2
TK1 in normal and cancer cells
TK1 activity increases in the G1 phase and reaches its highest level at the G1 phase/S-phase of the cell cycle where after it decreases in the M phase in normal cells while in the cancer cells, TK1 levels can still be high in the M phase and G2 phase (24,25). Several studies have been performed based on serum TK1 and TK1 in cell lines but fewer studies have been done on cell surface TK1. Weagel EG. and colleagues indicate that TK1 is upregulated in Burkitt’s lymphoma and different types of leukemia based on evaluating cell-surface TK1 in cell lines and patients tumor samples (26). These authors also studied lung, breast and colorectal cancer cell lines and surface TK1. They found that there was significantly higher cell-surface TK1 in all cell lines (except one colorectal cell line) than controls. Further-more, they compared the TCGA data with their study and revealed that TK1 gene expression was upregulated in cancer patients compared to the healthy individuals (27). Xiaofei Wang and Richard Wahl also worked on doubling time (DT) in breast and colorectal cancer cell lines and its correlation with TK1. They found that TK1 had a better correlation with DT than the conventional proliferation markers such as Ki67 and PCNA. Here, they observed a shorter DT with higher amount of TK1 (28,29).
2.3
TK1 as a biomarker in cancers
TK1 as an initial enzyme for preparing TTP has a critical role in DNA replication, DNA repair process and cell proliferation. DNA repair and replication pathways are two approaches which are studied in cancer. He and colleagues used chemo-lumi-nescent dot assays and immunohistochemistry (IHC) for TK1 level evaluation in serum and tissues where they found that TK1 tissue expression correlated to the pathological stage and the clinical grade, remission and relapse of lung cancer, oe-sophagus cancer and one type of breast cancer (30,31). One the first studies which was done on serum thymidine kinase role as a prognostic marker was Gronowitz study on non-Hodgkin's lymphoma patients which showed that STK1 increases dur-ing the progression of disease, decreases in the case of successful therapy and again increasing in the case of cancer relapse (32). Focusing on breast cancer, Nisman and his colleagues performed a study on serum TK1 activity. Using quantitative ELISA, serum levels of TK1 in breast cancer patients was significantly higher than the nor-mal persons, which suggests that it could be an important prognostic factor in terms of recurrence-free survival in breast cancer (33). Additionally, the Human Protein Atlas shows that lower expression of TK1 is a prognostic marker in different cancers like liver, lung and renal (34). A meta-analysis study was done in 2013 and fifteen studies were evaluated by details which were selected among 453 studies. It showed that individually TK1 was not a significant diagnostic biomarker. However, TK1
was a significant marker with combination of other biomarkers and using TK1 with other biomarkers was preferred in order to increase the specificity (35). The initial idea was that TK1 could be either secreted out of the cells, could be inside the cells and localizing at the cytoplasm or mitochondria, whereas a study also showed that it could locate on the cell surface membrane and therefore it could have a role in invasiveness and cell migration in the lung cancer cell line (36). Moreover, surface TK1 is significantly higher in the breast and colorectal cancer cell lines and also higher in cancer patient tissues compared to normal tissues, which shows the rele-vance of the clinical evidence and the cancer cell lines results (27). Evita’s study on lymphoma and leukemia also showed that TK1 which was located on the cell mem-brane could be a possible target for immunotherapy in haematological cancers (26).
2.4 Extracellular vesicle trafficking in cancer
As previously mentioned, extracellular vesicles including exosomes have roles in cell communication and homeostasis of the microenvironment. A research group working on glioblastoma exosomes found that the RNA content of exosomes could act as a messenger for distant cells, and these RNAs could be translated in the target cells. They also indicated that glioblastoma exosomes could induce proliferation in the human glioma cell line (37). Safaei and her colleagues worked on drug resistance ovarian carcinoma cells with cisplatin (CDDP) as a chemotherapy drug. They con-cluded that cancer cells could organise the CDDP transporters into the exosomal pathway and escape the cisplatin treatment by exporting CDDP out of the cells, sug-gesting alteration of extracellular vesicular trafficking resulting in drug resistance (38). In a recent review, the different roles of extracellular vesicles in different can-cers were discussed. One of the cancer hallmarks is angiogenesis and several studies showed that extracellular vesicles including exosomes could carry pro-angiogenic factors and stimulate the endothelial cells for angiogenesis and tumor growth (39). Extracellular vesicles can also make the proper microenvironment for fibroblasts surrounding the cancer cells to be resistant to apoptosis and consequently fibroblasts can ease the migration and invasion of the cancer cells (40). There are many studies focusing on extracellular microvesicles and their roles in most of the cancer hall-marks including evading the immune response, facilitating invasion and migration of tumor cells and multi-drug resistance (41).
2.5 Exosomes in normal cells and cancer cells
Different normal cell types in the human body such as endothelial cells, blood cells and platelets are able to excrete exosomes for a variety of reasons. Wieckowski and
Whiteside compared the tumor-derived exosomes and dendritic cell (DC)-derived exosome (as normal cells) and found that their contents and functions were different. DC-derived exosomes stimulated T-cell proliferation whereas the tumor-derived ex-osomes induced T-cells apoptosis that stopped the immune response against tumor cells (41). Exosomes could also induce metastasis and angiogenesis in lung cancer cells. They utilized different lung cancer cell lines and also an in vivo metastasis model showing that platelet-derived exosomes could induce proliferation in the A549 cell line via upregulating cyclin D2 expression in addition to upregulating MMP-6 and some growth factors as angiogenic factors. Furthermore, in a lung can-cer mice model, the exosomes resulted in more metastatic foci not only in the lungs but also in the bone marrow (39). Webber and colleagues even tried to evaluate how different tumor-derived exosomes could act on the normal cells. Here, they used a mesothelioma cell line, different prostate cancer cell lines, a bladder cancer cell line, a colorectal cancer cell line and a breast cancer cell line. Fibroblasts were the normal cells, which were treated with different cancer cell lines exosomes. The results in-dicated that tumor-derived exosomes regardless of the cancer type could increase expression of muscle actin and other proteins for differentiation of fibroblasts into myofibroblasts (42).
2.6 Exosomes and TK1 relations in cancer
There are only a few studies were done on the exosome-derived TK1 and its role in cancers.
Del Re and colleagues studied the correlation of plasma-derived exosomal TK1 with the clinical response to cyclin-dependent kinase 4/6 inhibitors in breast cancer patients. They found that TK1 expression was statistically and significantly higher in cancer patients than the normal cases while there was no association between the baseline of TK1, CD4 and CD6. They claimed that exosome-derived TK1 could be a biomarker for early patient detection who could get the CD4/6 dependent treatment later (43).
In another study one class of exosomes named prostasomes which are excreted out of acinar and epithelial cells of the prostate gland were studied. They used sem-inal fluid of healthy individuals from the university hospital (Uppsala, Sweden) and extracted the normal human prostasomes comparing them with the malignant cell line-derived exosomes (PC3, LNCaP and Du145). They found that TK1 activity was higher in the malignant prostate cell line exosomes than prostasomes of healthy in-dividuals and concluded that exosome-derived TK1 could be a useful biomarker for not only monitoring but also during the prognosis of prostate cancer (44).
Although different studies were performed on the TK1 roles in different cancer cell lines and different cancer patients, the excretion route of TK1 as a basic biological feature has not been studied so far. The aim of this study was to deduce whether exosomes could be a candidate for carrying TK1 out of the cells, and if the amount of excreted TK1 in BJ-T cells is different from BJ-N cells.
4.1
Cell lines and cell culture
The BJ-N cells are human fibroblasts which can be immortalized via human te-lomerase reverse transcriptase and makes BJ-T cells. These two cell lines were used in the current project. The normal fibroblast line was from a human child provided by Uppsala University Hospital (Cell code S0013). The cell lines were cultured in T175 flasks in DMEM media (Sigma-Aldrich) with 6.5% fetal bovine serum (FBS) as a low serum culturing condition to prevent false positive results due to serum TK1 level and 1% penicillin-streptomycin (Sigma-Aldrich) as an antibacterial and antifungal agent. Cells were incubated at 37 °C supplied with 5% CO2. The super-natant was collected when the cells became confluent which was reached once a week for normal cells and twice a week for tumor cells. The normal cells grew slower than the tumor cells and took a longer time to reach the desired confluency.
4.2
Exosome isolation
A differential preparative ultracentrifuge-based technique was used for exosome isolation. Twenty-five ml of cell free supernatant media was collected from each culture flask. The exosome isolation was done in two steps: the normal centrifuga-tion and the ultracentrifugacentrifuga-tion, where the whole process needed to be optimized. The normal centrifugation optimization was done using a Multifuge x3R (Ther-mofisher) to get rid of free nuclei, free mitochondria and cell debris. The supernatant was subsequently collected without disturbing the pellets. This supernatant was then used for ultracentrifugation, which also needed to be optimized. This was done through three separate experiment with different normal centrifugation and ultra-centrifugation settings as follows. In the first round, samples were centrifuged at 10,000 x g for half an hour and then subjected to ultracentrifugation at 80,000 x g for 3 hours. The second round, normal centrifuge was run at 10,000 x g for an hour
and ultracentrifugation was run at 96,000 x g for 5 hours, and in the last round the samples were run for 1 hour at 10,000 x g in the normal centrifuge followed by 6 hours running at 107,000 x g in the ultracentrifuge (Table. 1). The resulting pellet was dissolved in 100 or 200 µl PBS for further investigation. The concentration factor was calculated for exosome samples based on the volume of supernatant me-dia before ultracentrifugation and the volume of the prepared exosome sample after ultracentrifugation to make the results comparable. The samples in the optimizing part included BJ-T cell supernatant media before ultracentrifugation (OTBU), BJ-T cell supernatant media after ultracentrifugation (OTAU) and BJ-T exosomes (OTEX).
After optimizing the ultracentrifugation setting, the exosome isolation process was done on the BJ-T cell supernatant media and the BJ-N cell supernatant media at the same time to minimize the confounding elements. Therefore each sample set included tumor samples; BJ-T cell supernatant media before ultracentrifugation (TBU), BJ-T cell supernatant media after ultracentrifugation (TAU) and BJ-T exo-some (TEX) and normal samples; BJ-N cell supernatant media before ultracentrifu-gation (NBU), N cell supernatant media after ultracentrifuultracentrifu-gation (NAU) and BJ-N exosome (BJ-NEX).
Additionally, the ultracentrifuge was set twice on 132,000 x g (maximum speed for the rotor) for 6 hours but due to technical issues, it stopped during both runs. Therefore, this setting was eliminated from further optimizing steps.
It has to be mentioned that no complementary technique (like electron micros-copy or exosome specific antibody) has been used to examine the exosome isolation and purification accuracy while it’s believed that the pellet after ultracentrifugation is exosome pellet.
Table 1. Centrifugation and ultracentrifugation optimizing settings for exosome isolation.
Centrifugation Ultracentrifugation
Setting Speed (x g) Time (Hour) Temp(°C) Speed (x g) Time (Hour) Temp.(°C)
1 10000 0.5 4 °C 80,000 3 4 °C
2 10000 1 4 °C 96,000 5 4 °C
3 10000 1 4 °C 107,000 6 4 °C
4.3
Protein quantification
Protein quantification was measured on the exosome samples to evaluate the total exosome protein amounts in BJ-N exosome samples compared to BJ-T exosome samples. The supernatant media samples were not used for protein quantification evaluation since the media contained the serum proteins which we did not intend to evaluate and would not be meaningful in terms of tumor cell exosome evaluation.
A Bio-Rad protein assay was used for protein quantification and a standard curve using bovine serum albumin (BSA) dilution series (2 µg/ml, 4 µg/ml, 6 µg/ml, 8 µg/ml and 10 µg/ml) and UVmini-1240 spectrophotometer (Shimadzu) was made. Each sample was diluted 10 times and 3 µl of diluted sample was used for protein quantification. The same volume (3 µl) of each BSA dilution was used for making standard curve. All samples and the standards were read at 595 nm.
4.4
TK1 enzymatic assay
A [3 H]-dThd phosphorylation assay was chosen for the enzyme activity evaluation. The supernatant media before ultracentrifugation, supernatant media after centrifu-gation and isolated exosomes were checked for TK1 enzyme activity. The reaction mixtures were prepared as follows:
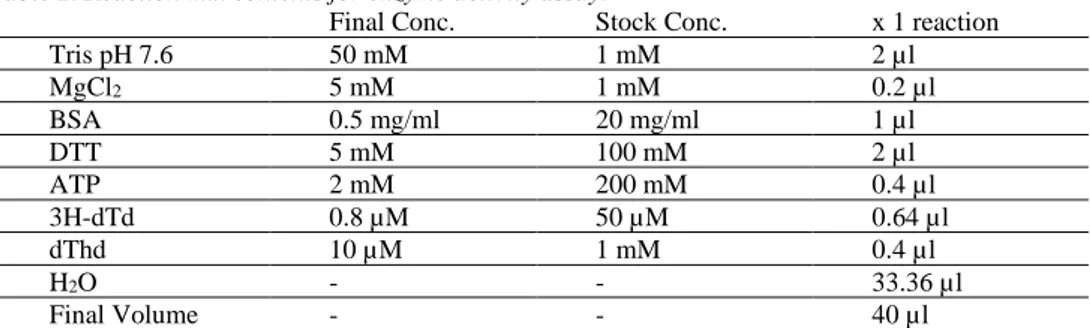
Table 2. Reaction mix contents for enzyme activity assay.
Final Conc. Stock Conc. x 1 reaction
Tris pH 7.6 50 mM 1 mM 2 µl MgCl2 5 mM 1 mM 0.2 µl BSA 0.5 mg/ml 20 mg/ml 1 µl DTT 5 mM 100 mM 2 µl ATP 2 mM 200 mM 0.4 µl 3H-dTd 0.8 µM 50 µM 0.64 µl dThd 10 µM 1 mM 0.4 µl H2O - - 33.36 µl Final Volume - - 40 µl
Firstly, a 0.1 % final Triton concentration was added to the samples, which were incubated on ice for 20-30 minutes. Thereafter, 40 µl of a reaction mixture and 20 µl of each sample were mixed and incubated in a water bath at 37 °C for 30 minutes. During these 30 minutes, 10 µl of samples were taken in 4 time points ( 0, 10, 20 and 30 minutes). The different time point samples were loaded on DEAE filtermat (PerkinElmer) and then dried for 20-30 minutes. The filtermats were washed with ammonia formate three times (total 18 minutes) and 2 minutes with distilled water on a shaking plate. Afterwards, each filtermat was put in the corresponding scintil-lation tube adding 500 µl of the elution buffer (HCl 0.1 M + KCl 0.2 M) and shaken for 20 minutes for TK1 elution. Thereafter, 2 ml of scintillation buffer was added to each tube and shaken for 10 minutes. Finally, the emission counting was done by the liquid scintillation analyser (PerkinElmer, Tri-carb, 2810TR) and Quantsmart (TM) software. The enzyme activity results were imported to Microsoft excel 2016 and TK1 activity in 1 ml of supernatant media and the specific enzyme activity (SEA) were calculated.
Western blot is a protein detection technique which was used for TK1 detection in this project. The supernatant media samples before ultracentrifugation, supernatant media samples after ultracentrifugation and isolated exosomes were used for prov-ing TK1 presence. Twenty µl of SDS loadprov-ing buffer was added to 80 µl of each sample and incubated 10 minutes at 95 °C. Subsequently, 25 µl of the mixture was run on SDS-PAGE at 150V for 2 hours. The proteins on the gel were transferred to polyvinylidene difluoride (PVDF) membrane at 0.2A (max 100V) for 50 minutes. The membrane was blocked by BSA blocking buffer for an hour and incubated with mouse monoclonal anti-human TK1 antibody (Arocell AB, Uppsala, Sweden) as a primary antibody overnight and then was washed three times with TBST (tris-buff-ered saline plus tween-20) for 30 minutes in total and once with tris-buff(tris-buff-ered saline (TBS) for 5 minutes. The membrane was incubated with the secondary anti-mouse antibody (LiCor bioscience, U.S) for an hour and washed again as previously de-scribed. Finally, the membrane was developed by Odyssey® CLx Imaging System (LI-COR Biosciences, U.S.) in grey scale mood.
4.6
TK1 presence proved by dot blot chemiluminescence
assay
Dot blotting, as a straight forward protein detection method was used for TK1 de-tection in samples of this project. Dot blot is almost the same as western blot except it does not have the running and the transferring steps which makes it easier to op-timize. Ten percent Triton was added to a sample up to 0.1% final concentration and incubated for 20-30 minutes on ice. Afterwards, the loading frame was put on top of a suitable size of nitrocellulose (NC) membrane then, 3 µl of samples were loaded on the NC membrane through the frame, 3 µl of 20 ng/3 µl, 10 ng/3 µl, 8 ng/3 µl, 6 ng/3 µl, 4 ng/3 µl, 2 ng/3 µl, 1 ng/3 µl and 0.5 ng/3 µl of TK1 recombinant protein (made in house, (45)) as a positive control and 3 µl of PBS as a negative control. TK1 recombinant protein was used for quantification. Membranes were left to dry for 20 minutes and blocked with 10% milk blocking buffer for an hour followed incubation with a mouse monoclonal anti-human TK1 antibody (amino acids 161– 183, AYTKRLGTEKEVEVIGGADKYHS; MAB 528–2, AroCell AB, Uppsala, Sweden) overnight. The MAB 528–2 antibodies has been biotinylated using the ChromaLink™ Biotin Antibody Labeling Kit (Solulink, California, USA) according to manufacturer’s instructions (46). The membrane was washed firstly for 15 minutes by TBS and then TBS for 5 additional minutes. Thereafter, the membrane was incubated with streptavidin-HRP antibody (Thermo Scientific, USA) for an hour and washed again as previously described. Detection reagents (Amersham™ ECL™ Western Blotting detection reagents, UK) and ChemiDoc™ Touch Imaging from Bio-Rad were used for developing and 4 images were captured in 120 seconds. ImageJ (version 1.52a) was used to quantify the TK1 concentration.
4.7
Statistical analysis
For the comparison of TK1 activity of BJ-N cell samples and BJ-T cell samples and also TK1 concentration in BJ-N cell samples and BJ-T cell samples, a two-tailed distributed and unequal variance t-test was used for calculating the p-value.
5.1 Exosome isolation
5.1.1 Optimizing stage
The exosome pellet after ultracentrifugation (Fig. 3) was re-suspended in 100 or 200 µl PBS and concentration factors were 250, 178.9 and 283 for OTEX1, OTEX2 and OTEX3 samples respectively.
5.1.2 BJ-T and BJ-N exosomes
The exosome pellets of BJ-T cell and BJ-N were resus-pended as previously described. There were six sets of sam-ples and their concentration factors are shown in table 3.
Table 3. Concentration factors in different BJ-N and BJ-T cells samples.
Series number Sample name Concentration Factor
1 NEX1 209.7 TEX1 193 2 NEX2 191.1 TEX2 211.8 3 NEX3 336.2 TEX3 325 4 NEX4 322.2 TEX4 339.1 5 NEX5 307.4 TEX5 312.6 6 NEX6 246.1 TEX6 285.85
5
Results
Figure 3. Exosome pel-let appearance after ul-tracentrifugation (107,000 x g, 6 hours).
5.2 Protein quantification
5.2.1 Optimizing stage
Protein amounts of exosome samples of each optimizing steps were quantified in order for comparison. The quantification results are shown in table 4. Sample vol-umes (3 µl), the dilution factors for protein quantification preparing (x10) and the concentration factors of ultracentrifugation were all considered in order to calculate the exosome protein concentration in 1 ml of cell supernatant media.
Table 4. Protein quantification of BJ-T cells exosomes in different optimizing settings.
Optimizing setting number
Sample name Normalized Absorbance Protein Conc. (µg/ 3µl) * Exosome protein Conc. (mg/ml) ** 1 BJ-T cell exosome (OTEX1) 0.139 2.230 0.0297 2 BJ-T cell exosome (OTEX2) 0.275 3.393 0.0632 3 BJ-T cell exosome (OTEX3) 0.644 6.547 0.0771 * 3 µl of prepared sample for protein quantification
** 1 ml of cell supernatant media
5.2.2 BJ-T and BJ-N exosomes
BJ-N and BJ-T cells exosome protein in every six sets of samples were quantified (table 5). The protein concentration was calculated by considering the factors which are mentioned in the previous section.
Table 5. Protein quantification of BJ-N and BJ-T exosome samples.
Sample series
Sample name Normal-ized Ab-sorbance Protein Conc. (µg/ 3µl) * Exosome pro-tein Conc. (mg/ml) **
1 BJ-N cell exosome (NEX1) 0.506 5.367 0.085
BJ-T cell exosome (TEX1) 0.554 5.777 0.099
2 BJ-N cell exosome (NEX2) 0.585 6.042 0.105
BJ-T cell exosome (TEX2) 0.423 4.658 0.073
3 BJ-N cell exosome (NEX3) 0.626 6.393 0.063
BJ-T cell exosome (TEX3) 0.669 6.760 0.069
4 BJ-N cell exosome (NEX4) 0.599 6.162 0.063
BJ-T cell exosome (TEX4) 0.574 5.948 0.058
5 BJ-N cell exosome (NEX5) 0.395 4.418 0.047
BJ-T cell exosome (TEX5) 0.662 6.700 0.071
6 BJ-N cell exosome (NEX6) 0.723 7.222 0.097
BJ-T cell exosome (TEX6) 0.513 5.427 0.063 * 3 µl of prepared sample for protein quantification
** 1 ml of cell supernatant media
The mean of the protein concentration for BJ-N exosome samples was 0.078 and was 0.072 for BJ-T exosome samples. The standard deviations (SD) in BJ-N and
BJ-T exosome samples were 0.022 and 0.014 respectively (supplementary table 1), a p-value of 0.266.
5.3 TK1 enzyme activity
5.3.1 Optimizing stage
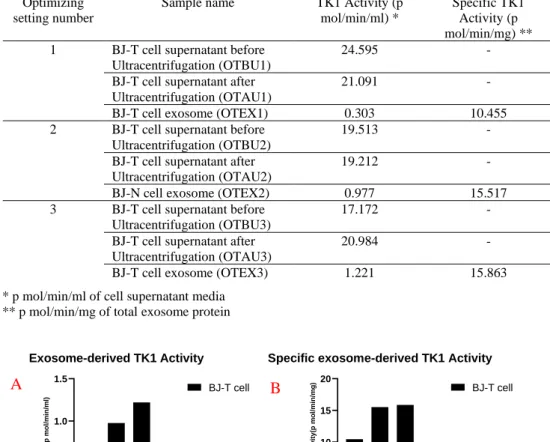
In the first setting, although it was run at 80,000 x g for 3 hours, there was still high TK1 activity in the supernatant media after ultracentrifugation. Therefore, it was decided to increase the centrifugation time, both ultracentrifugation time and the speed. The second round was run at 96,000 x g for 5 hours and the enzyme activity in the supernatant after ultracentrifugation decreased while TK1 activity in the exo-some sample was more than doubled compared to the first setting. Thereafter, the third setting was decided to run at 107,000 x g for 6 hours in the ultracentrifugation with the same centrifugation setting as the second round. TK1 activity in the exo-some sample increased even more than the second round. To make the comparison more accurate and clearer, TK1 activity per 1ml of the supernatant and specific TK1 activity per 1mg of total exosome protein were calculated and summarized in table. 6 (and visualized in Fig. 4). TK1 activity in the optimize setting 1 is 24.59, 21.09 and 0.30 (p mol/min/ml of BJ-T cells supernatant) in TBU1, TAU1 and TEX1 sam-ples respectively. The enzyme activity for optimize setting 2 was 19.51, 19.21 and 0.97 (p mol/min/ml of BJ-T cells supernatant) in TBU2, TAU2 and TEX2 samples respectively. The last optimize setting, TK1 activity is 17.17, 20.98 and 1.22 (p mol/min/ml of BJ-T cells supernatant) in TBU3, TAU3 and TEX3 samples respec-tively. The specific TK1 activity based on the total exosome protein amount was calculated only for exosome samples due to the fact that there are lots of protein in the media necessary for cell growth, which we were not interested in. Therefore, the comparison of exosome proteins would not be logical for the supernatant samples because of media containing proteins. Here, the specific TK1 activities in TEX1, TEX2 and TEX3 were 10.45, 15.51 and 15.86 (p mol/min/mg of total exosome pro-tein) respectively.
Table 6. TK1 activity and specific TK1 activity of samples in different optimizing settings.
Optimizing setting number
Sample name TK1 Activity (p mol/min/ml) *
Specific TK1 Activity (p mol/min/mg) ** 1 BJ-T cell supernatant before
Ultracentrifugation (OTBU1)
24.595 -
BJ-T cell supernatant after Ultracentrifugation (OTAU1)
21.091 -
BJ-T cell exosome (OTEX1) 0.303 10.455 2 BJ-T cell supernatant before
Ultracentrifugation (OTBU2)
19.513 -
BJ-T cell supernatant after Ultracentrifugation (OTAU2)
19.212 -
BJ-N cell exosome (OTEX2) 0.977 15.517 3 BJ-T cell supernatant before
Ultracentrifugation (OTBU3)
17.172 -
BJ-T cell supernatant after Ultracentrifugation (OTAU3)
20.984 -
BJ-T cell exosome (OTEX3) 1.221 15.863 * p mol/min/ml of cell supernatant media
** p mol/min/mg of total exosome protein
5.3.2 BJ-T and BJ-N supernatant (before and after ultracentrifugation) and exosomes
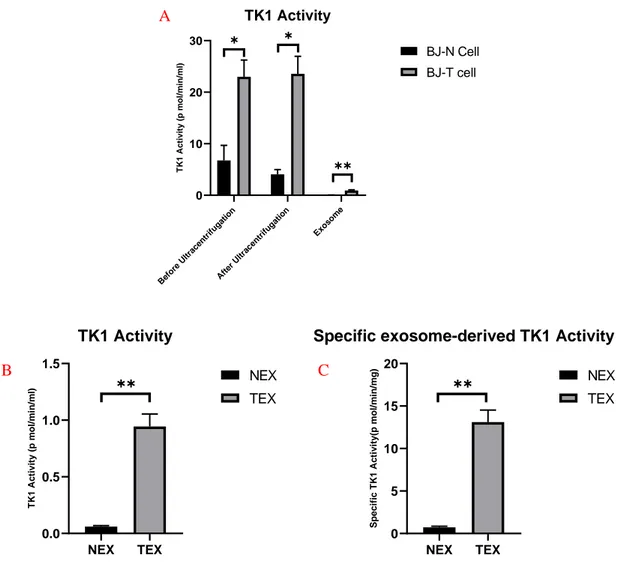
TK1 activity evaluation was done on BJ-T and BJ-N cells supernatant media (before and after ultracentrifugation) and isolated exosomes at the same time. It was per-formed on six sets of samplesand all parameters here represents the average of six repeats. The detailed data of the repeats is provided in supplementary table. 2. The enzyme activity in 1 ml of supernatant and specific enzyme activity (SEA) per 1 mg of total exosome protein were calculated. Table. 7 and Fig. 5A shows the results. The mean TK1 activity in BJ-N cells supernatant before ultracentrifugation samples
Figure 4. Exosome-derived TK1 activity of samples in different optimizing settings. Comparison of exosome-derived TK1 activity in 1 ml of tumor cell supernatant media(A). Comparison of specific exosome-derived TK1 activity in 1 mg of total tumor cells exosome protein(B).
OTE X1 OTE X2 OTE X3 0 5 10 15 20
Specific exosome-derived TK1 Activity
S p e c if ic T K 1 A c ti v it y (p m o l/ m in /m g ) BJ-T cell B OTE X1 OTE X2 OTE X3 0.0 0.5 1.0 1.5 Exosome-derived TK1 Activity T K 1 A c ti v it y ( p m o l/ m in /m l) BJ-T cell A
(NBU) was 6.754 p mol/min/ml of supernatant while it is 22.997 p mol/min/ml of supernatant in TBU samples. The mean of TK1 activity in BJ-N and BJ-T cells su-pernatant media after ultracentrifugation samples (NAU and TAU) were 4.072 and 23.570 p mol/min/ml respectively. In exosome samples, the mean of TK1 activity in BJ-N isolated exosomes (NEX) was 0.06 p mol/min/ml while for BJ-T isolated exosomes (TEX) showed 0.944 p mol/min/ml of activity. The p-value was less than 0.05 (P<0.05). The mean of TK1 SEA was 0.77 p mol/min/mg for NEX and 13.107 for TEX.
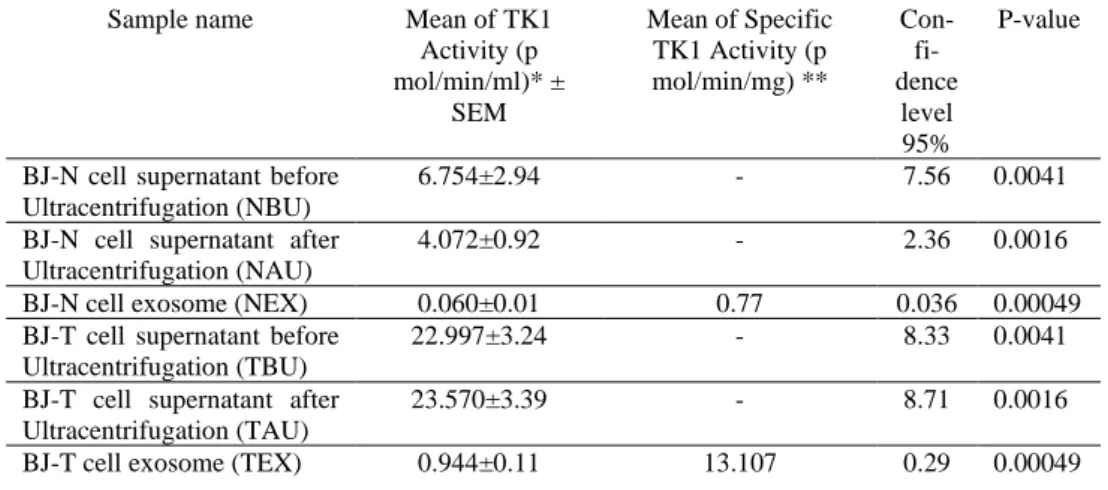
Table 7. TK1 activity and specific TK1 activity in BJ-N and BJ-T cell supernatant media (before and after ultracentrifugation) and exosome samples.
Sample name Mean of TK1 Activity (p mol/min/ml)* ± SEM Mean of Specific TK1 Activity (p mol/min/mg) ** Con- fi-dence level 95% P-value
BJ-N cell supernatant before Ultracentrifugation (NBU)
6.754±2.94 - 7.56 0.0041
BJ-N cell supernatant after Ultracentrifugation (NAU)
4.072±0.92 - 2.36 0.0016
BJ-N cell exosome (NEX) 0.060±0.01 0.77 0.036 0.00049 BJ-T cell supernatant before
Ultracentrifugation (TBU)
22.997±3.24 - 8.33 0.0041
BJ-T cell supernatant after Ultracentrifugation (TAU)
23.570±3.39 - 8.71 0.0016
BJ-T cell exosome (TEX) 0.944±0.11 13.107 0.29 0.00049 * p mol/min/ml of cell supernatant media
** p mol/min/mg of total exosome protein
Exosome-derived TK1 activity was 15.73 times more in BJ-T cells than BJ-N cells which was statistically significant (Fig. 5B). The specific TK1 activity in 1 mg exosome protein was 18.1 times more in BJ-T cells than BJ-N cells (Fig. 5C).
If the TK1 activity (p mol/min/ml) in samples before ultracentrifugation was considered as total TK1 activity in the supernatant, the proportion of specific TK1 activity of NEX/ specific TK1 activity of NBU showed that the exosome-derived TK1 activity was 0.8% of total TK1 activity in BJ-N cells while this proportion in BJ-T cells was 4% (4.6 times more in BJ-T cells than BJ-N cells). Fig. 6 shows the proportion of exosome-derived TK1 activity to non-exosome-derived one.
Figure 5. Comparison of TK1 activity of BJ-N cell supernatant before and after ultracentrifugation and exosome samples in 1 ml of supernatant media(A). Comparison of TK1 activity of BJ-N and BJ-T cells exosome samples in 1 ml of superna-tant media(B). Comparison of specific TK1 activity of BJ-N and BJ-T exosomes in 1 mg of total exosome protein (C).
Bef ore Ultr acen trifu gatio n Afte r U ltrac entr ifuga tion Exo som e 0 10 20 30 TK1 Activity T K 1 A c ti v it y ( p m o l/ m in /m l) BJ-N Cell BJ-T cell ✱ ✱ ✱✱ NEX TEX 0.0 0.5 1.0 1.5 TK1 Activity T K 1 A c ti v it y ( p m o l/ m in /m l) NEX TEX ✱✱ A B C NEX TEX 0 5 10 15 20
Specific exosome-derived TK1 Activity
S p e c if ic T K 1 A c ti v it y (p m o l/ m in /m g ) NEX TEX ✱✱
5.4
Western blotting
In both the optimizing part and the real project, the samples were used also to screen for the presence of TK1 protein in the supernatant media before ultracentrifugation, supernatant media after ultracentrifugation and isolated exosomes.
5.4.1 Optimizing stage
The supernatant media of BJ-T cells before and after ultracentrifugation and the isolated exosomes were run in western blots for three experiments in the optimizing process (Fig. 7). In the first experiment, there were two weak bands for tumor cells supernatant media before and after ultracentrifugation, and also a fairly strong band for the tumor exosome sample (Fig. 7A). For the second experiment, there were no bands for tumor cells supernatant media before and after ultracentrifugation while there was a strong band for the tumor exosome sample (Fig. 7B). The last round of western blot in the optimizing process also showed no bands for the supernatant media before and after ultracentrifugation but a very weak band for the exosome sample (Fig. 7C). The western blot was run several times on three optimizing steps samples but the early results were not reproducible.
Figure 6. Comparison of exosome-derived TK1 and non-exosome-derived TK1 activity in BJ-N cells (A) and BJ-T cells (B) based on TK1 activity in supernatant (p mol/min/ml).
Proportional Comparison of TK1 activity in BJ-N cell
0.89% Exosomic TK1 Activity 99.11% Non-exosomic TK1 Activity
Proportional Comparison of TK1 activity in BJ-T cell
4.10% Exosomic TK1 Activity 95.90% Non-exosomic TK1 Activity
A
5.4.2 BJ-T and BJ-N supernatant (before and after ultracentrifugation) and exosomes
The BJ-N and BJ-T cell samples were run on SDS-PAGE several times and trans-ferring to PVDF membranes but no bands were observed. We do not know why the western blot did not work in these cases and therefore a new approach using the dot blot was chosen as an alternative technique.
5.5
Dot blot chemiluminescence assay
5.5.1 optimizing stage
Three sets of optimizing stage samples were run on one nitrocellulose membrane (Fig. 8). Samples of each optimizing step were run twice. The first row is the first optimize setting samples, the second row is the second optimize setting samples and the third row is the third optimize setting samples. TK1 recombinant protein in the fourth row was used in a dilution series to make TK1 quantification possible by making the standard curve afterwards. The last row is a positive control for TK1 (cytosolic extract of BJ-T cells) which was loaded in duplicates as well as duplicates of PBS as a negative control. By using ImageJ software, the dot blot membrane results were quantified and TK1 concentrations were calculated (summarized in
Figure 7. Western blot results of the optimizing steps with different centrifugation and ultracentrifuga-tion settings.
A
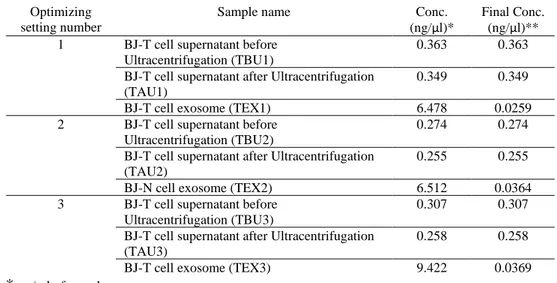
table. 8 and visualized in Fig. 9). The exosome TK1 concentration was 0.0259 ng/µl of supernatant media which increased to 0.0364 ng/µl in the second setting. TK1 exosome concentration reached 0.0369 ng/µl in the third optimizing setting. Ther-fore, the last optimizing setting showed the most concentrated TK1.
Table 8. ImageJ TK1 concentration quantification for three optimizing settings.
Optimizing setting number
Sample name Conc.
(ng/µl)*
Final Conc. (ng/µl)** 1 BJ-T cell supernatant before
Ultracentrifugation (TBU1)
0.363 0.363 BJ-T cell supernatant after Ultracentrifugation
(TAU1)
0.349 0.349 BJ-T cell exosome (TEX1) 6.478 0.0259 2 BJ-T cell supernatant before
Ultracentrifugation (TBU2)
0.274 0.274 BJ-T cell supernatant after Ultracentrifugation
(TAU2)
0.255 0.255 BJ-N cell exosome (TEX2) 6.512 0.0364 3 BJ-T cell supernatant before
Ultracentrifugation (TBU3)
0.307 0.307 BJ-T cell supernatant after Ultracentrifugation
(TAU3)
0.258 0.258 BJ-T cell exosome (TEX3) 9.422 0.0369
* ng/ µl of sample
** ng/ µl of supernatant media
TBU TBU TEX TBU TBU TEX
Optimizing 1 Optimizing 2 Optimizing 3 TK1 Recombinant 20 ng 10 ng 8 ng 6 ng 4 ng 2 ng 1 ng 0.5 ng PC PC NC NC Repeat 1 Repeat 2
Figure 8. Dot blot results of different optimizing settings. The first row is for the samples of the first optimizing setting, the second row represents the samples of the second optimizing setting and the third row shows the samples of third optimizing setting. TK1 recombinant protein was loaded in dilution series in the fourth row. Cytosolic BJ-T cells extract and PBS were loaded on the last row as a positive and negative control respectively.
5.5.2 BJ-T and BJ-N supernatant (before and after ultracentrifugation) and exosomes
All six sets of samples which included BJ-N cell samples and BJ-T cell samples were used for dot blotting. Each sample set was run at least twice (Fig. 10). All sample sets results were used to calculate the mean of TK1 concentration (Supplementary Table. 3). The sample loading amount and concentration factor of ultracentrifugation was considered in the final concentration calculation. The results of TK1 quantification is summarized in Table. 9, Fig. 11 and 12. The t-test was done for evaluating the difference TK1 concentrations between NBU samples and TBU samples, NAU samples and TAU samples, NEX samples and TEX samples separately. The concentration of BJ-N cells exosome-derived TK1 was 0.013 ng/µl of supernatant media while BJ-T cell exosome-derived TK1 concentration was 0.027 ng/µl.
Figure 9. TK1 concentration comparison between BJ-T cells supernatant media before and after ultracentrifugation and exosome samples in three different optimizing settings.
TBU TAU TEX
0.0 0.1 0.2 0.3 0.4
TK1 Concentration in BJ-T cells supernatant media
T K 1 C o n c e n tr a ti o n ( n g /µ l) OPT1 OPT2 OPT3
Table 9. TK1 concentration in BJ-N and BJ-T cells supernatant before and after ultracentrifugation and exosome samples based on dot blot results and ImageJ analysis.
Sample name Mean of TK1 concentrtion (ng/µl) * ±SEM
Confidence level 95%
P-value BJ-N cell supernatant before
Ultracentrifugation (NBU)
0.292±0.084 0.218 0.981 BJ-N cell supernatant after
Ultracentrifugation (NAU)
0.242±0.082 0.211 0.924
BJ-N cell exosome (NEX) 0.013±0.001 0.005 0.020
BJ-T cell supernatant before Ultracentrifugation (TBU)
0.295±0.096 0.249 0.981 BJ-T cell supernatant after
Ultracentrifugation (TAU)
0.230±0.090 0.232 0.924
BJ-T cell exosome (TEX) 0.027±0.004 0.011 0.020
* ng/µl of superntant media
Figure 10. Dot blot results of one set of samples. every samples run twice (the first row is the first repeat and the second row is the second repeat). Each repeat has 6 samples including (from left to right) BJ-N cell supernatant media before ultracentrifugation (NBU), BJ-N cell supernatant media after ultracentrifugation (NAU), BJ-N exosome (NEX), BJ-T cell supernatant media before ultracen-trifugation (TBU), BJ-T cell supernatant media after ultracenultracen-trifugation (TAU) and BJ-T exosome (TEX). TK1 recombinant protein was loaded in dilution series in the third row. Cytosolic BJ-T cells extract and PBS were loaded on the last row as a positive and negative control respectively.
If the TK1 concentration in exosome samples was considered exosome-derived TK1 and the TK1 concentration in supernatant media samples after ultracentrifugation was considered non-exosomic derived TK1 (or TK1 from other source than exosomes), it could be possible to clarify the proportion of exosome-derived TK1 to total TK1 (Fig. 13). Exosome-exosome-derived TK1 in BJ-T cells was 10.49%
Figure 11. TK1 concentration comparison in BJ-T and BJ-N supernatant media before and after ultracentrif-ugation and exosome samples.
Bef ore Ultr acen trifu gatio n Afte r U ltrac entr ifuga tion Exo som e 0.0 0.1 0.2 0.3 0.4 0.5 TK1 Concentration T K 1 C o n c e n tr a ti o n ( n g /µ l) BJ-N Cell BJ-T cell ns ns ✱
Figure 12. TK1 concentration comparison in BJ-T and BJ-N exosome samples.
NEX TEX 0.00 0.01 0.02 0.03 0.04
TK1 Concentration Comparison in Exosome
T K 1 C o n c e n tr a ti o n ( n g /µ l) NEX TEX ✱
of the total TK1 however, exosome-derived TK1 in BJ-N cells was 5.25% of the total TK1.
Figure 13. Comparison of the proportional concentration of exosome-derived TK1to non-exosome-derived TK1 in BJ-N (A) and BJ-T cells (B).
Proportional Comparison of TK1 in BJ-N cell
5.25% Exosome-derived TK1 94.75% Non-exosome-derived TK1
Proportional Comparison of TK1 in BJ-T cell
10.50% Exosome-derived TK1 89.50% Non-exosome-derived TK1
A
The first step of this project was exosome isolation. Although there are different exosome isolation techniques such as size-based techniques, immunoaffinity capture-based techniques and exosome precipitation kits, which one to use was based on the purpose of the study. The ultracentrifugation-based technique is the gold standard for exosome isolation due to the fact that it is easy to use, it needs little technical expertise, is moderately time consuming and needs no or little sample pretreatment (47). The results of the optimizing stages showed that although the lowest speed and time of ultracentrifugation could isolate TK1-containing exosomes, increasing the low speed centrifugation time from half an hour to an hour, increasing the time of ultracentrifugation run from 3 hours to 6 hours in addition to increasing the speed from 80,000 x g to 107,000 x g could lead to an increase in TK1 concentration in the isolated exosome samples and a decrease in TK1 activity in the supernatant media after ultracentrifugation compare to the supernatant media before ultracentrifugation. It was shown previously that 100,000 x g for 3 hours could be sufficient for exosome isolation (48) but it was also shown in this project that increasing the time and speed of ultracentrifugation could increase the yield of TK1-containing exosomes. The enzyme activity in exosome samples increased during the optimizing process. TK1 activity per 1 ml of supernatant increased in exosome samples by increasing the time and speed of ultracentrifugation. The TK1 activity decreased in the supernatant media samples after ultracentrifugation com-pared to the supernatant media samples before ultracentrifugation. The specific ac-tivity of TK1 per 1 mg of exosome protein was also increased gradually by increas-ing the ultracentrifugation time and speed. Therefore, the last set up for exosome isolation was the most efficient one for this study.
Dot blot and western blot are similar techniques for specific protein evaluation. Dot blot is technically easier than western blot, while both methods have their own pros and cons. In the dot blot method, whole samples were loaded on the membrane and it is very unlikely to lose them in theblotting process. Therefore, it would be a good choice if the protein target is small or low in term of amount in the sample.
However if the antibody was not specific enough, unspecific binding to the primary antibody could occur. On the other hand, in western blotting by running the sample on the SDS-PAGE and separating different proteins based on their mass, the probability of unknown unspecific binding is decreased. It can also be considered that wet western blotting (which was used in this project) has the buffer based transferring step which can increase the probability of protein loss during the transferring step, particularly for the low abundant and small sizes proteins which can also make the optimization more time consuming and difficult (49,50). The initial western blot worked well (see Fig. 4) but for some unknown reasons it did not work later even though a lot of effort had been used to optimize the procedure.
After trying to optimize the western blotting in this project, it was decided to utilize the dot blot as an alternative method for TK1 protein concentration determination. In the optimize steps, the exosome-derived TK1 concentration increase was also supported by dot blotting results. In the dot blot results, there were very weak circles (band/signal) for the tumor cells supernatant media before and after ultracentrifugation and a clear circle for the BJ-T exosome samples. The specific TK1 activity in the exosome sample of the third setting of optimization was slightly more than exosome samples of the second setting as well as the dot blot result showed that TK1 was a bit more concentrated in third setting than other settings. Furthermore, the protein quantifiction showed higher total protein amounts in the third optimizing setting which regardless of specific protein showed the highest exosome concentration in the exosome pellet of third optimizing setting. Therefore, the third setting was chosen for running both the normal and tumor samples of the current project.
The enzyme activity in 1 ml of supernatant was calculated since comparing the supernatant and the exosome samples could be possible, and specific enzyme activ-ity in 1 mg of exosome protein was calculated for a more accurate comparison of normal cell exosomes and tumor cell exosomes. However, it could not be done for the supernatant media samples because the media contains many other proteins from the FBS, which it’s evaluation was not useful for this study. It was concluded that the exosome-derived TK1 was higher in BJ-T cells compared to BJ-N cells, which could mean that it might affect tumor formation and progression.
Western blot and dot blot techniques used in this study are routine methods for specific protein evaluation while there are some other methods that could be used as well, including immunoprecipitation, mass spectrometry (which could be used to determine all exosome content based on mass-to-charge ratio) (51). The enzyme activity evaluation could also be done via different approaches such as a TK-radio enzymatic assay (TK-REA), TK liaison assay or divitum assay based on the research purposes (17). The methods used in the current project were chosen as they were more accurate and available in the lab.
Wei Sun and colleagues claimed that the tumor cells produce and secret more total proteins, nucleic acids and lipids (52). This study showed that the total exosome protein concentration in BJ-N and BJ-T cells (NEX and TEX) were not significantly different (P-value>0.05) which means that the total excreted protein via exosomes in the normal and tumor cell culture are similar. Therfore, if there is any difference between the protein secretion of BJ-T cells and BJ-N cells, it is likey not to be related to exosome excretion, and could be due to other protein secretion pathways. However, the TK1 amount in NEX and TEX samples was significantly different (P-value<0.05) and TK1 was 2 times more in BJ-T derived-exosomes than BJ-N derived-exosomes. The TK1 protein amount was not significantly different neither in NBU and TBU samples nor in NAU and TAU samples. The proportion of exosome-derived TK1 to total TK1 was calculated in both the BJ-N samples and the T samples. It showed that the proportion was 2 times more in T cells than BJ-N cells which could associate with the nature of tumor cells but more in vitro investigations would have to be done to confirm this. So far, the results of this study support the literature behind the role of TK1 in various cancer types (31,33,35).
It is well-established that the serum and tissue-derived TK1 correlate with the pathological stage and clinical signs in different cancer types, which were briefly described in 2.3 part of this thesis (TK1 as a biomarker in cancers) but they could not be directly compared to this study because the serum or tissue-derived TK1 is not comparable to the cancer cell cultured exosome-derived TK1. If we want to compare the serum, tissue and/or the cell cultured exosome-derived TK1, tissue and blood could be collected from healthy individuals and cancer patients. The tissue could be cultured and exosomes extracted then isolated. Subsequently, TK1 from the serum-derived exosomes and cell cultured derived-exosomes could be compared. Roughly, our results support previous studies showing that BJ-T cells excrete more TK1 in the exosomes than BJ-N cells. Additionally, our study did not clarify the exosome number in BJ-T and BJ-N cells. For this purpose, electron microscopy and an exosome specific antibody such as CD63, CD81 and CD9 antibody could be used. Moreover, these antibodies could be used as an exosome marker for the resuspended exosome pellets. The result could be more accurate when the exosome number of BJ-T cells and BJ-N cells are compared in parallel, as claimed by Jenjaroenpun and colleagues, where the number of exosomes appear higher in tumor cells than normal cells (53). It would be possible to see if either T cells secrete much more TK1 than N cells with equal exosome numbers or BJ-T cells secrete more BJ-TK1 in more total exosome number than BJ-N cells. BJ-To be more conclusive, the exosome number, total TK1 and exosome-derived TK1 could be evaluated in parallel, and separately in vitro and/or in vivo (in serum, cancer tissue and cultured cells).
There are very few studies on exosome derived TK1 and its function, and this study could complement them in terms of how TK1 is excreted out of the cells. It has been shown that TK1 in plasma-derived exosomes is higher in breast cancer patients than normal cases, which supports our findings. Here,they claimed that TK1 in plasma-derived exosomes could be an early breast cancer biomarker and also useful for choosing the treatment option (43). Furthermore, Dubois has studied prostasomes and evaluated different prostate cancer cell lines and compared exosome-derived TK1 from aforementioned cell lines (in part 2.6) with normal prostasomes, which were isolated from seminal fluid of healthy individuals (44). Dubois found that the exosomes of the most metastatic prostate cancer cell line (PC3) showed significantly higher TK1 Unit values compared to other cell lines’ exosomes and the healthy individuals prostasomes. However, there are some points to discuss about the studies methods and materials compared to our study. The samples used in that study were exosomes from different prostate cancer cell lines in terms of metastatic feature (PC3 is much more metastatic than LNCaP and DU1) as the tumor samples and the prostasomes from seminal fluid of the healthy persons. Technically, these two types of samples are not comparable due to their sources. Although cancer cell lines were originally collected from cancer patients, they are immortalized and also have different characteristics due to the culture conditions. The cancer cell lines were cultured in as similar conditions to the body as possible in laboratorie. However, the microenvironment and the cell interactions of cancer cells in the culture condition is different from cancer cells in the human body. Therefore, the comparison of exosome-derived TK1 in the way that the study was done is fundamentally questionable.
In our study, BJ-T cells and BJ-N cells as tumor and normal cells were used to make the comparison more logical. On the other hand, in our study, a [3 H]-dThd phosphorylation assay was used for TK1 activity evaluation, which directly measures TK1 activity in 37 °C (the natural temperature for TK1) while in Dubois study the TK1 real-time activity assay was more complicated. This method was de-veloped around six years ago and indirectly measures the TK1 activity. The method is Taq DNA polymerase-based involving several other enzymes downstream of TK1 reaction to produce dTTP, which is then used to generate the complement strand of an oligonucleotide template catalyzed by the Taq DNA polymerase (54). Although all the processes carried out at 37 °C where Taq DNA polymerase could act at this temperature (1.5 nucleotides/sec), the optimum temperature for its activity is 75-80 °C (150 nucleotides/sec) (55,56). Therefore, the Taq DNA polymerase will act slowly and consequently dTTP accumulation may inhibit TK1 activity(57).
In this project, TK1 activity assay was performed to evaluate the rate of reaction of TK1 with thymidine but count per minute (CPM) could not be used alone to evaluate the TK1 protein amount. If ten times more CPM were seen in the tumor