Faculty of Natural Resources and Agricultural Sciences
Behavioural study of the house cricket
(Acheta domesticus): Individual boldness
and personality
Behavioural study of the house cricket (Acheta domesticus):
Individual boldness and personality
John-Christophe Hessler Frelinckx
Supervisor: Åsa Berggren, SLU, Department of Ecology Examiner: Matthew Low, SLU, Department of Ecology
Credits: 15 hec
Level: G2E
Course title: Självständigt arbete i biologi
Course code: EX0894
Course coordinating department: Department of Aquatic Sciences and Assessment
Place of publication: Uppsala
Year of publication: 2019
Cover picture: John-Christophe Hessler Frelinckx
Online publication: https://stud.epsilon.slu.se
Keywords: house crickets, Acheta domesticus, boldness, behavioural
The study of personality in species can be used to better understand the dynamics of a population. Personality is however a wide concept and is often divided into easier and identifiable terms when it concerns animalia such as “Behavioural traits”. One such trait is boldness which is often used as a distinguishable trait. In this study boldness is measured in the house cricket (Acheta Domesticus). The study aims to measure if boldness is con-sistent in the population or if it has a variation, this is done across a timespan of ten days. Boldness is measured by the latency for a cricket to emerge from a shelter into a novel environment. The study measured bold-ness for 15 males and 15 females a total of 10 times each every day for a total of 600 predicted observations. The study found that there are distinc-tive patterns in the levels of boldness in the individuals and that they do differ by significant margins. It can thus be concluded that some crickets are bolder than others and different personality types related to boldness exists. Boldness increased over time as the crickets experienced the trial suggesting plasticity in personality. The study also found that in general males dis-played higher degrees of boldness compared to the female crickets.
Keywords: House crickets. Acheta Domesticus. Boldness. Behavioural traits.
Per-sonality in insects.
Abstract
Studien om personligheter hos arter är ett kunskapsområde som kan hjälpa veten-skapen att bättre förstå dynamiken hos populationer. Personlighet kan dock vara ett brett koncept och kan enklare förklaras inom vetenskap med termer som ”Beteen-deegenskaper” när det angår djurriket. En egenskap som oftast används för att mäta personlighet är ”modighet” eller ”boldness”. Denna studie mäter modighet hos hussyrsan (Acheta Domesticus). Studien ämnar mäta modighet och om den är kon-sekvent eller om den varierar över ett tidsspann om 10 dygn. Modighet mäts genom att mäta tiden det tar för en syrsa att ta sig ut från ett skydd och ut till en ny omgiv-ning. Studien mäter modighet hos 15 hanar och 15 honor tio gånger var per dygn vilket ska ge totalt 600 mätpunkter. Studien visar att det finns distinkta skiljemöns-ter när det kommer till modighet hos individuella syrsor och att dessa skillander är markanta. Det kan därav dras en slutsats att det existerar modighetsskillnader syrsor emellan och att personlighetsdrag relaterade till dessa existerar. Modigheten ökade under försökens gång vilket visar på en plasticitet när det kommer till personlighet associerad till modighet. Studien visar också att syrshanarna uppvisar en statistiskt högra grad av modighet än syrshonorna.
List of figures 5
Abbreviations 6
Introduction 7
1 Method 7
1.1 Study species and housing 7
1.2 Behavioural trials 8 1.3 Analyses 8 2 Results 9 3 Discussion 13 References 15
Table of contents
List of figures
Figure 1. Total LTA (latency to activate) values for each individual (colour coded id’s) 9 Figure 2. Total LTE (latency to emerge) values for each individual (colour coded id’s) 10 Figure 3. Total LTA (Latency to activate) values (all individuals summed up) for each
of the ten trials 11
Figure 4. Total LTE (Latency to emerge) values (all individuals summed up) for each
of the ten trials. 11
Figure 5. Total LTA values for individuals with males (left) and females (right). Mean value for all individuals on the far right. 12 Figure 6. Total LTE values for individuals with males (left) and females (right). Mean value for all individuals on the far right. 13
Abbrevations
LTE Latency to emerge LTA Latency to activate
Introduction
The study of behaviour and personality in animals and organisms is a relatively unexplored subject in science. This may be due to the difficulty to label or quanti-fy a personality trait and ultimately conclude what it means (Réale et al 2007). In humans personality may be explained as the traits that make a person unique or distinct from their peers. When this shifts to the animal kingdom these terms may change to those of “Life-history strategies” or “behavioural syndromes” (Sih et al 2004). One commonly examined trait is that of boldness, which in the wild may be expressed in ways such as when and how animals forage, how often they decide to hide and response to new experiences. The personality associated with different levels of boldness can be expressed as the “Pace of life syndrome” which means that individuals can adopt a bolder fast-paced “high-risk high-reward” lifestyle or a less bold slower-paced lifestyle with little risk (Réale et al 2010). According to Batemans principle (Bateman 1948) there may also be selection for different per-sonality types associated to boldness in between the sexes. Promoting the bolder and faster paced lifestyle in the gender less invested in the offspring.
Behaviour is however not entirely decided by predestined factors such as life-experience. Studies have shown that single populations exposed to new environ-ments or circumstances can develop new “animal personalities” as an adaption to novelty, which displays plasticity within the population (Dingemanse et al 2010). Other evidence of this have shown that animal personality and boldness can be directly influenced by presenting them with experiences of novelty (Frost et al 2007). Studies of personality in insects is somewhat lacking when it comes to in-dividual personality traits (Modlmeier et al 2015) and deserves more attention. The many individuals is what makes up the population and might make it easier to distinguish the origins of a behaviour in the population as a whole. This study will focus on determining the presence of individual personality in a group of crickets. I will also examine if males and females behave differently in accordance to pre-existing theories concerning behavioural differences between the sexes. This will be done by testing boldness related to the hiding behaviour of crickets. The first hypothesis is that the crickets will form a gaussian distribution of “personality types” with most placing somewhere in the middle with few individuals diverging from the “mean” (most common) behaviour. This will establish a baseline of dif-ferent personalities over an identifiable and measurable spectrum. The second hypothesis is that individuals will become adapted to the experiment, so boldness of the crickets should increase over time, in correspondence to previous studies on behavioural plasticity. My third hypothesis is that males and females could display different patterns concerning boldness as other studies have shown that in crickets the female may display a higher degree of boldness (Hedrick 2000).
Method
Study species and housing
In my study I used House crickets (Acheta Domesticus) from a breeding popula-tion at SLU. The individuals used came from four different families to reduce the
risk for family-related behaviours. In the experiment 30 adult crickets (15 male and 15 female) were picked at random from the families. Each cricket was given a unique colour code by applying a non-toxic paint to its thorax. This allowed for easy identification of each individual throughout the trial. The experiment was conducted in a climate-controlled room with a temperature of approximately 30°C, 40% humidity and a 12:12h light-dark cycle. Between the trials, the crickets were kept together in a plastic container measuring 30 x 24 x 15 cm with a netted roof to ensure air circulation. In the cage the individuals had access to shelter and hid-ing areas. Ad libitum food (chicken feed) and ad libitum water were provided in the cages.
Behavioural trials
The room used for the trial was soundproof and had the same temperature, humidi-ty and light regime as the housing. I used the method to measure and assess bold-ness of individuals used by Niemelä et al (2012) and others (Hedrick, 2000; Hedrick & Kortet, 2006; Kortet & Hedrick, 2007). The trial consisted of placing the cricket inside a black opaque tube that measured 7 cm lengthwise and 2 cm in diameter with a one-way opening. The tube was closed with a lid and placed hori-zontally in the trial box that measured 18 x 18 x 10 cm. This box will henceforth be known as “the arena”. The size of the arena was based on previous experiments on boldness in related species (Fisher et al 2018). Once the tube with the cricket was placed horizontally down in the arena, a 2-minute pause was taken to reduce any stress in the cricket. When 2 minutes had passed the lid of the tube was re-moved and a plexiglass cover was placed on the roof of the arena to prevent audi-tory input. Time recording started at this point.
To measure boldness of the individuals, two factors, LTA (Latency to activate) and LTE (Latency to emerge) were measured. LTA was the time it took for the cricket to visibly explore its environment, i.e. look out of the tube. LTE was the time it took for the cricket to exit the tube with its whole body. The maximum time allowed for each individual in the trial was 10 minutes. This cut-off was set due to previous experiments having reported that if a cricket stays put in the tube for longer than 10 minutes, it is likely to stay for an extended period of time (Hedrick & Kortet 2006). The trials were repeated for every individual cricket once a day for a 10-day period. The arena and tubes were cleaned with ethanol between every trial to reduce scents and leftovers from previous individuals.
Analyses
Results
The study resulted in a total of 596 observations from the 30 individuals over the 10 days of trials. Individuals took between 0 – 573 seconds to become active and 1 - 598 seconds to emerge from the tube. There was a variation between individu-als in boldness (LTA and LTE) (Fig 1, Fig 2). Both figure 1 & 2 show that the distribution is skewed toward the lower values i.e. the bolder value. Meaning that the distribution is non-gaussian.
Figure 1. Total LTA (latency to activate) values for each individual (colour coded id’s)
0 500 1000 1500 2000 2500 3000 3500 w hi te-w hi te bl ue-y el low y el low -g re en w hi te-gr e en gr e en-y el low gr e en-w hi te w hi te-bl ue re d-b lue bl ue re d -re d re d -g re e n bl ue-g reen bl ue-re d bl ue-w hi te re d y el low -r e d bl ue-b lue y el low -b lue re d-w hi te gr e en-b lue w h ite y el low w h it e -y e llo w gr e en-g reen y el low -y e llo w gr e en w hi te-red red -y el low y el low -w hi te g re e n -re d A ll in d iv id u a ls T im e ( S ec )
Total individual LTA value
LTA1(S) LTA2(S) LTA3(S) LTA4(S) LTA5(S) LTA6(S) LTA7(S) LTA8(S) LTA9(S) LTA10(S)
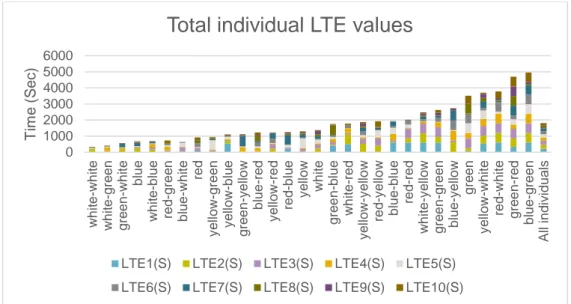
Figure 2. Total LTE (latency to emerge) values for each individual (colour coded id’s)
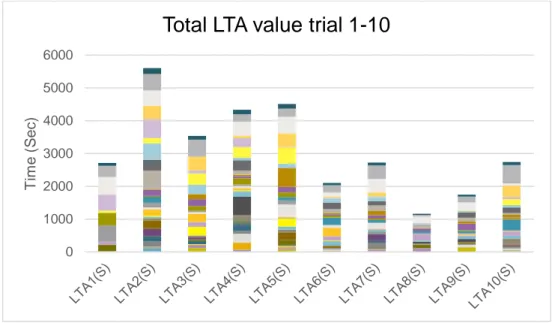
The total LTA values showed an initial peak and towards the later trials became lower (fig. 3). This resulted in a deviation from a normal distribution and yielded a significant P-value (P < 0,001).
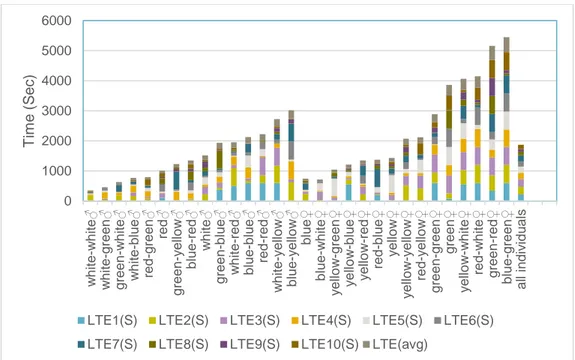
Total time elapsed until the individuals emerged from the tube (LTE) was higher in the beginning than in the end of the trials (P < 0,000001) (Fig 4). This shows that the individual’s behaviour changed to become bolder during the course of the experiment. 0 1000 2000 3000 4000 5000 6000 w hi te-w hi te w hi te-gr e en gr e en-w hi te bl ue w hi te-bl ue re d -g re e n bl ue-w hi te re d y el low -g re en y el low -b lue gr e en-y el low bl ue-re d y el low -r e d re d-b lue y el low w h ite gr e en-b lue w hi te-red y el low -y e llo w red -y el low bl ue-b lue re d -re d w h it e -y e llo w gr e en-g reen bl ue-y el low gr e en y el low -w hi te re d-w hi te g re e n -re d bl ue-g reen A ll in d iv id u a ls T im e ( S ec )
Total individual LTE values
LTE1(S) LTE2(S) LTE3(S) LTE4(S) LTE5(S) LTE6(S) LTE7(S) LTE8(S) LTE9(S) LTE10(S)
Figure 3. Total LTA (Latency to activate) values (all individuals summed up) for each of the ten trials
Figure 4. Total LTE (Latency to emerge) values (all individuals summed up) for each of the ten trials.
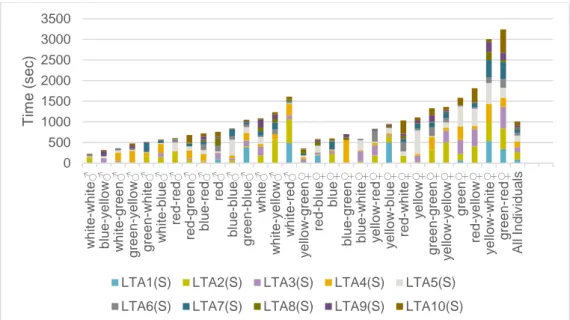
I found a difference between the sexes in that males took less time both to start exploring (Fig.5) and to exit from the test tube than the females (fig.6). This shows that the males are bolder in this experiment and the P-values show this is statisti-cally true. The LTA values yields (P < 0,01) and the LTE values yields (P< 0,01).
0 1000 2000 3000 4000 5000 6000 T im e ( S ec )
Total LTA value trial 1-10
0 1000 2000 3000 4000 5000 6000 7000 8000 9000 T im e ( S ec )
On average males took 134 ± 75 Sec to move out from the tube and females took 229 ± 147 Sec to move out from the tube (LTE value). The time it took the cricket to visibly explore its surrounding (LTA value) was for males 74 ± 37 sec and for females 128 ± 85 sec.
Figure 5. Total LTA values for individuals with males (left) and females (right). Mean value for all individuals on the far right.
0 500 1000 1500 2000 2500 3000 3500 wh it e -wh it e♂ bl ue -y el low ♂ wh it e -gr een ♂ gr een -y el low ♂ gr een -wh it e♂ wh it e -bl ue ♂ re d -re d♂ re d -gr een ♂ bl ue -re d♂ re d♂ bl ue -bl ue ♂ gr een -bl ue ♂ wh it e♂ wh it e -y el low ♂ wh it e -re d♂ y el low -gr een ♀ re d -bl ue ♀ bl ue ♀ bl ue -gr een ♀ bl ue -wh it e♀ y el low -re d♀ y el low -bl ue ♀ re d -wh it e♀ y el low ♀ gr een -gr een ♀ y el low -y el low ♀ gr een ♀ re d -y el low ♀ y el low -wh it e♀ gr een -re d♀ A ll I n di v id u al s T im e ( s ec )
LTA1(S) LTA2(S) LTA3(S) LTA4(S) LTA5(S) LTA6(S) LTA7(S) LTA8(S) LTA9(S) LTA10(S)
Figure 6. Total LTE values for individuals with males (left) and females (right). Mean value for all individuals on the far right.
Discussion
My study has found that individuals show a variation in behaviour and how bold they are. This means there is something that makes each individual act in a differ-ent fashion from one another. The individuals were from four differdiffer-ent laboratory generations. which could have resulted in a slightly different upbringing between the crickets during their nymph stage. This means that there potentially could be a difference concerning pace of life syndrome in each generation as the group dy-namic may be different (Montiglio et al 2018). Since the genetics of the crickets are unknown it is difficult to make conclusions regarding the role similar genetics could influence the results. There have however been other studies that show that even species that share the same genetics will act differently to the same situation (Schuett et al 2011). Giving credence to the possibility of other factors affecting behavioural traits. Genetics as a factor is however mostly disregarded for this study as the information is not readily available. The boldness levels did not form an entirely gaussian distribution with a slight skewedness towards the bolder and faster times. It can however be concluded that a difference in boldness does exist and that they form a spectrum across the whole timeframe established.
The capacity for learning in insects is not fully studied, with some even suggesting that they do not in fact possess learning capability (Montgomery & Kanzaki 1996). This leads to difficulty in pinpointing the exact origin of the increase in boldness observed. For the experiment the crickets have all been kept together to ensure a
0 1000 2000 3000 4000 5000 6000 wh it e -wh it e♂ wh it e -gr een ♂ gr een -wh it e♂ wh it e -bl ue ♂ re d -gr een ♂ re d♂ gr een -y el low ♂ bl ue -re d♂ wh it e♂ gr een -bl ue ♂ wh it e -re d♂ bl ue -bl ue ♂ re d -re d♂ wh it e -y el low ♂ bl ue -y el low ♂ bl ue ♀ bl ue -wh it e♀ y el low -gr een ♀ y el low -bl ue ♀ y el low -re d♀ re d -bl ue ♀ y el low ♀ y el low -y el low ♀ re d -y el low ♀ gr een -gr een ♀ gr een ♀ y el low -wh it e♀ re d -wh it e♀ gr een -re d♀ bl ue -gr een ♀ a ll in d iv id u a ls T im e ( S ec )
LTE1(S) LTE2(S) LTE3(S) LTE4(S) LTE5(S) LTE6(S) LTE7(S) LTE8(S) LTE9(S) LTE10(S) LTE(avg)
similar environment and experiences. Several studies using the same method of measurement recommends the use of a room equipped with dim red light to imi-tate a dark environment for the crickets (Niemelä et al 2012; Hedrick & kortet 2012; Hedrick & kortet 2007). The red light imitates a dark environment and makes the observer not visible to the crickets. This would mean that in this case the observer was visible to the crickets. (Briscoe & Chittka, 2001). This could be a source of disturbance, but a disturbance that affects all the crickets equally as they all experience the same potential danger that is the observer.
Time the individuals spent before exiting the tube changed with number of trials (or time after first trial). The more time that had passed after the first trial the bolder the individual was (p < 0.000001). This seem to strongly confirm the hy-pothesis that the boldness of the cricket will increase over time. This could be due to the decrease of novelty and accumulation of experience in the individual. Other experiments have shown that differing levels of boldness can be observed over the life stages of crickets before the adult stage (Hedrick & Kortet 2012). Since all crickets in this experiment are at the adult stage and thus the same stage of life, this variable should be minimized. The first two trials featured behaviour which the method fails to differentiate from a faulty measurement. During the beginning several crickets would leap out immediately following the opening of the tube, resulting in a very low LTE value and no LTA value whatsoever. The data will register this as a very bold result when in reality this is a fleeing behaviour (Ste-venson & Rillich 2012). The last two trials are also missing two datapoints each, this due to an individual perishing from natural causes, this reduced the total num-ber of datapoints from the predicted 600 to 596 and the sample size (n) to 29. The values gathered prior to the individual perishing are however kept and reduced sample size is taken into consideration for the last two calculations, reducing the impact missing data could otherwise have. The result does not appear to have been majorly impacted from this.
Previous studies on how boldness in crickets is related to their sex have shown different results. Some studies have found that no difference can be observed (Wilson et al 2010), others have had results where females exhibit bolder behav-iour (Hedrick 2000) and some studies show a graduate shift where males start out bolder and then grow more shy as they age and proceed through stages of life (Hedrick & Kortet 2012). My results differ in that there is a clear difference in boldness between the sexes, contradicting some of the results from previous stud-ies. The initial conclusion might be to refer to Bateman’s principle (Bateman 1948) which states that different level of investment in the offspring will result in different behaviour. Typically, the female will invest more energy into each off-spring and since the female carry the offoff-spring it may be assumed that they will not exhibit a reckless or overly bold behaviour. Thus, decreasing the risk of losing
the sexes with males displaying a bolder behaviour, which is in accordance with certain principles and established theories but not in agreement with other similar studies.
References
Bateman, A.J. (1948) Intra‐sexual selection in Drosophila. Heredity, 2, 349–368.
Briscoe, A.D. & Chittka, L. (2001) The evolution of color vision in insects. Annual Review of Ento-mology, 46, 471–510.
Dingemanse, N.J. & Wolf, M. (2010) Recent models for adaptive personality differences: a re-view. Philosophical Transactions of the Royal Society B-Biological Sciences, 365, 3947–3958.
Fisher, DN, David, M, Rodríguez‐Muñoz, R, Tregenza, T. (2018) Lifespan and age, but not residual reproductive value or condition, are related to behaviour in wild field
crick-ets. Ethology. 2018; 124: 338– 346.
Frost, A. J., Winrow-Giffen, A., Ashley, P. J., & Sneddon, L. U. (2007). Plasticity in animal person-ality traits: does prior experience alter the degree of boldness? Proceedings. Biological scienc-es, 274(1608), 333–339.
Hedrick, A.V. & Kortet, R. (2006) Hiding behaviour in two cricket populations that differ in preda-tion pressure. Animal Behaviour, 72, 1111–1118.
Hedrick, A.V. (2000) Crickets with extravagant mating songs compensate for predation risk with extra caution. Proceedings of the Royal Society of London, Series B, 267, 671– 675.
Hedrick, Ann & Kortet, Raine. (2012). Sex differences in the repeatability of boldness over meta-morphosis. Behavioral Ecology and Sociobiology. 66. 10.1007/s00265-011-1286-z.
Kim HY. (2014) Analysis of variance (ANOVA) comparing means of more than two groups. Restor Dent Endod. 2014;39(1):74–77.
Kortet, R. & Hedrick, A.V. (2007) A behavioural syndrome in the field cricket Gryllus integer: intrasexual aggression is correlated with activity in a novel environment. Biological Journal of the Linnean Society, 91, 475–482.
Modlmeier P Andreas, Keiser N Carl, Wright M Colin, Lichtenstein LL James, Pruitt N Jonathan, (2015) Integrating animal personality into insect population and community ecology, Current Opinion in Insect Science, 9, 77-85, 2214-5745,
Montgomery, C.A. & Kanzaki, Ryohei. (1996). Behavioral and neural basis of instinctive behavior in insects: Odor-source searching strategies without memory and learning. Robotics and Autono-mous Systems. 18. 10.1016/0921-8890(95)00081-X.
Montiglio, Pierre-Olivier & Dammhahn, Melanie & Dubuc Messier, Gabrielle & Réale, Denis. (2018). The pace-of-life syndrome revisited: the role of ecological conditions and natural history
on the slow-fast continuum. Behavioral Ecology and Sociobiology. 72. 116. 10.1007/s00265-018-2526-2.
Niemelä, Petri & Vainikka, Anssi & Hedrick, Ann & Kortet, Raine. (2012). Integrating behaviour with life history: Boldness of the field cricket, Gryllus integer, during ontogeny. Functional Ecology. 26. 450-456.
Réale, D., Garant, D., Humbries, M.M.,Bergeron, P., Careau, V. & Montiglio, P.‐
E.(2010) Personality and the emergence of the pace‐of‐life syndrome concept at the population level. Philosophical Transactions of the Royal Society B-Biological Sciences, 365, 4051–4063.
Réale, Denis & M Reader, Simon & Sol, Daniel & T McDougall, Peter & Dingemanse, Niels. (2007). Integrating animal temperament within ecology and evolution. Biological reviews of the Cambridge Philosophical Society. 82. 291-318. 10.1111/j.1469-185X.2007.00010. x.
Schuett, W., Dall, S. R., Baeumer, J., Kloesener, M. H., Nakagawa, S., Beinlich, F. and Eggers, T. (2011), Personality variation in a clonal insect: The pea aphid, Acyrthosiphon pisum. Dev. Psy-chobiol., 53: 631-640.
Sih, A, Bell, A. & Johnson, J.C. (2004) Behavioral syndromes: an ecological and evolutionary over-view. Trends in Ecology & Evolution,19, 372–378.
Stevenson, P. A., & Rillich, J. (2012). The decision to fight or flee - insights into underlying mecha-nism in crickets. Frontiers in neuroscience, 6, 118.
Wilson, Alexander & Mcauley, Emily & Bennett, Rachel & Visanuvimol, Laksanavadee & Lauzon, Chris & Bertram, Susan. (2010). Behavioral correlations across activity, mating, exploration, ag-gression, and antipredator contexts in the European house cricket, Acheta domesticus. Behavior-al Ecology and Sociobiology. 64. 703-715. 10.1007/s00265-009-0888-1.