Green IT Balanced Scorecard
A model developed for the Swedish environment
Bachelor’s thesis within Informatics
Author: Pernilla Andersson & Linnea Malmkvist
Tutor: Vivian Vimarlund
Bachelor’s Thesis in Informatics
Title: Green IT Balanced Scorecard
- a model developed for the Swedish environment Author: Pernilla Andersson & Linnea Malmkvist
Tutor: Vivian Vimarlund
Date: 2012-06-04
Subject terms: Green IT, IT practices, Balanced Scorecard, Drivers of Green IT
Abstract
Climate change has become a widely discussed topic in many regions of the society. Green IT can be seen as part of the solution to this problem and can be defined as practices that work to improve the phases of design, production and usage of IT hardware, software and communication systems to effectively and efficiently use IT as a tool in the business, with minimal effect on the environment and promoting sustainability.
The purpose of this thesis is to investigate if the Balanced Scorecard model has to be adap-ted and can be used to find objectives that can aid the implementation of Green IT. This was done by using an inductive approach to find Green IT practices through secondary data and with semi-structured interviews with four Swedish companies. From the intervi-ews, several Green IT practices and drivers were established. The drivers allowed the authors to determine that the Balanced Scorecard’s perspectives did not have to be adapted to fit a Green IT Strategy.
The Green IT practices were transformed into initiatives that formed the basis for several Green IT objectives. Each objective individually fit into the four original perspectives of the Balanced Scorecard. These objectives, including initiatives, were the building blocks for the final Green IT Balanced Scorecard.
Table of Contents
1
Introduction ... 1
1.1 Background ...1 1.1.1 Green IT...1 1.2 Problem Statement...3 1.3 Purpose ...3 1.4 Research Question...3 1.5 Perspective...3 1.6 Definitions...32
Frame of Reference... 5
2.1 Drivers of Green IT...5
2.2 Green IT Practices ...7
2.2.1 Green Processes...8
2.2.2 Green Data Centers...10
2.2.3 Green Consortiums...12
2.3 The Balanced Scorecard...13
2.3.1 The Balanced Scorecard Model ...15
3
Method ... 18
3.1 Research Philosophy ...18 3.2 Research Approach...18 3.3 Research Design...18 3.3.1 Research Purpose...18 3.3.2 Research strategy...19 3.3.3 Method Choice...19 3.3.4 Time Horizon ...193.4 Data Collection Techniques ...20
3.4.1 Secondary Data...20 3.4.2 Empirical Data ...20 3.5 Credibility of Research ...22 3.6 Data Analysis ...22
4
Results ... 25
4.1 Company A...25 4.2 Company B...26 4.3 Company C ...27 4.4 Company D ...295
Analysis ... 30
5.1 Green IT Practices and Drivers ...30
5.2 Green IT Balanced Scorecard Perspectives ...32
5.3 Initiatives and Objectives...33
6
Conclusion... 37
Figures
Figure 2.1 Drivers of Green IT... 5
Figure 2.2 Major Areas of Influence of the Green Organization... 7
Figure 2.3 Servers in hot-aisle-cold-aisle arrangement... 12
Figure 2.4 The Balanced Scorecard model... 15
Figure 5.1 The Green IT Balanced Scorecard ... 36
Tables
Table 1.1 Key definitions ... 4Table 5.1 Green IT Practices used in the Swedish environment ... 30
Table 5.2 Drivers of Green IT used in the Swedish environment... 32
Appendix
Appendix 1 – Interview questions ... 43Appendix 2 – Green IT Practices matrix... 44
1
Introduction
This section will introduce the history behind climate changes and how this has lead to the invention of Green IT that can be seen as one solution to this concern. The problem that is the basis for this thesis is presented in section 1.2, along with the purpose and research question. The perspective of the thesis is also discussed, as well as the definitions for key terms, in this thesis, are given.
1.1
Background
Before the agricultural revolution, 10 000 years ago, people believed that humans should disturb the biosphere as little as possible and therefore changed their lifestyle accordingly. However, from the agricultural revolution and onward, the human population started to exploit nature and its resources in a whole new way, thereby adjusting nature to human needs instead (Milbrath, 1984). After the agricultural revolution came the industrial revolu-tion that involved machines and inorganic material, producing goods for the growing population (Penna, 2010). These transformations and revolutions led to more power being available and increased consumption of it, thus leading to one of the three basic causes for the climate change according to scientists: fossil fuel emissions. This is a contributing rea-son for rising temperatures, with the other two causes being “exchange of energy by the oceans and atmosphere... and solar energy” (Penna, 2010, p. 287).
During the seventies, in the United States, people were becoming more aware of environ-mental issues and problems like resource conservation and water and air pollution were re-ceiving more attention (Dunlap, Van Liere, Mertig, & Jones, 2000). At the first World Cli-mate Conference, held in 1988, a warning of the dangers of global warning was issued and a turning point in climate policies was the United Nations Framework Convention on Cli-mate Change in 1994. The goal at this convention was to stabilize greenhouse gases, at 1990 levels, by the end of the decade (Behringer, 2007). In the year of 1997, the Kyoto-protocol was adopted as a link to the United Nations Framework Convention on Climate Change. The protocol bound thirty-seven industrialized countries and the European com-munity to reduce their greenhouse gas emissions by an average of 5% against the 1990 lev-els between the years of 2008-2012. (United Nations Framework Convention on Climate Change, 2012). The results are yet to be published.
1.1.1 Green IT
Information technology (IT) is today a widespread culture throughout any organization, consuming a lot of resources and producing waste (Brown, DeHayes, Hoffer, Martin, & Perkins, 2009; Kristiansson, 2008). IT is defined by several authors, such as Brown et al. (2009), and Pearlson and Saunders (2009), as technology used to create, process and store information, as well as aiding information communication between users.
Kristiansson (2008) stated that global IT usage consumes more power than all sectors in the Scandinavian region. Therefore, she continues to argue that by changing the way in which IT is used daily, for example by utilizing resources in a responsible way, as well as having good recycling and IT destruction techniques, the organization can reduce its waste and eliminate unnecessary energy usage, a process known as Green IT.
Past research, conducted within the Swedish environment, on the field of Green IT is lim-ited, however, covers vital aspects of the topic. As will be discussed below, some research covers the examination and definition of what Green IT amounts to in a single Swedish company as well as in the Swedish environment. Other research examined why Green IT is
of importance for Swedish companies and investigated how to implement and further im-prove Green IT practices in Swedish companies.
Two separate authors of previous work, Norström (2009) and Kristiansson (2008), both investigated the effect a single Swedish company has on the environment due to its opera-tions. They provided guidelines for improvements for their respective companies and Kris-tiansson (2008) argued that her thesis work could be used as guidelines for the company’s future implementation of Green IT.
Broberg (2009) investigated what factors are vital, or of key importance, when choosing to adopt Green IT into an organization. His conclusions were that it is important to not ex-amine a single factor and evaluate its potential alone. Companies should instead look at the combination of factors for choosing Green IT, and evaluate how these affect one another and in what ways. In addition, Broberg (2009) concluded that it is important to link Green IT initiatives with the business strategy and that the environmental policies are linked with the IT practices assigned. Continuous measurements are needed to upkeep a company’s Green IT initiatives and its respective advantages (Broberg, 2009).
Aasvold and Nilsson (2010) join Broberg (2009) by having investigated why it is of impor-tance for a company to have an environmental policy. Their findings were that organiza-tions with an environmental policy can better communicate with their customers, as well as increase their competitiveness in their market segment. Kristiansson (2008) joined in on this statement and argued that it is valuable to have an active Green IT strategy and policy. She continues to argue that more than just Green technology is needed and in effect, a clear strategy can convince and gain support from user and the organization as a whole. Frennesson and Gustavsson (2008) took a more specific aspect of Green IT, namely data centers, and investigated how energy savings can be done in this area through different techniques. On the contrary, Puelma, Huynh and Negasi (2008) looked at Green IT from a more general and strategic level and investigated the advantages and disadvantages of im-plementing Green IT into an organization.
Puelma et al. (2008) mentioned in their work that they saw, as a common trend, companies adopting new work practices, such as Green IT, but that the companies did not follow up on the success of the implementation nor evaluated its fit. The authors continued by argu-ing that this way of workargu-ing usually leads to failed investments and consequences for the company. To solve this, they proposed for future research, the development of a clearer picture of how to align the company goals with the implementation of Green IT and also argued the need for ways to measure its success. In other words, they proposed the crea-tion of a Balanced Scorecard for implementing Green IT (Puelma et al., 2008).
In addition to the Swedish research on Green IT, several international authors have con-ducted research on producing Balanced Scorecards for Green IT. Jain, Benbunan-Fich, and Mohan (2011) assessed Green IT initiatives through the Balanced Scorecard model as they saw the need to investigate how Green IT initiatives contribute to enterprise-wide sustain-ability performance. The authors based the model on several press releases, from various companies across the globe, that mention Green IT and included a sustainability perspec-tive in addition to the original four perspecperspec-tives of the Balanced Scorecard. The authors did not interview individual companies, neither did they go into full detail of how they adapted the Balanced Scorecard to the Green IT practices they found. In addition, Unhelkar (2011a) also mentions the possibility of creating a Green Balanced Scorecard in order to “help organizations in creating and implementing balanced Green IT strategies and their
policies” (Unhelkar, 2011a, p. 111). Unhelkar (2011a) does not actually create a Balanced Scorecard but discusses how each perspective of the Balanced Scorecard could include mo-tives and measures for Green IT implementation.
1.2
Problem Statement
According to a Green IT index from Almega, many Swedish companies have a Green IT policy, but fail to implement and follow up on it because they do not have defined goals for the implementation (Wikberg, 2008). As mentioned previously, a Balanced Scorecard model can aid in creating clear and balanced goals for a company implementing Green IT (Jain et al., 2011; Unhelkar, 2011a). However, the authors saw that the previous Balanced Scorecards created for Green IT, either focus to generally on the global implementation of Green IT (Jain et al.), or was theoretical, but not fully developed to be used in practice (Unhelkar). In addition to this, none of the previous Balanced Scorecard models were cre-ated in regards to the culture, business and mental thinking of a Swedish company.
Thus the problem statement is that, at the present, there is no Balanced Scorecard model adapted for the implementation of Green IT in the Swedish environment. The authors see the need for a tool to help both Swedish companies, as well as other researchers, to under-stand what objectives are currently used in the implementation of Green IT in Sweden.
1.3
Purpose
The purpose of this thesis is to investigate if the Balanced Scorecard model has to be adapted and can be used to find objectives, through IT practices found in the Swedish en-vironment that can aid in the implementation of Green IT.
1.4
Research Question
Can the Balanced Scorecard model be adapted and used to create objectives for the imple-mentation of Green IT in a Swedish environment?
1.5
Perspective
The intention of this study is to research the field of Green IT from a consumer perspec-tive. This implies that the companies interviewed are consumers of Green IT and not pro-viders of Green IT solutions. Looking at the consumer side of the question will better ful-fill the purpose of this study since the consumers of Green IT are the ones that have im-plemented Green IT practices.
1.6
Definitions
Below, table 1.1 is a summary of definitions that the authors have chosen to use as stan-dards in this thesis.
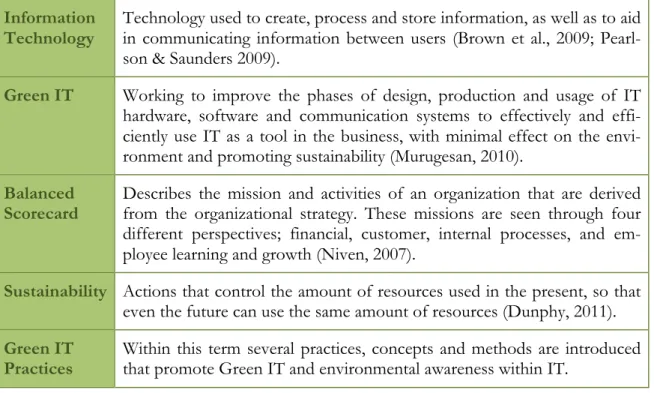
Information Technology
Technology used to create, process and store information, as well as to aid in communicating information between users (Brown et al., 2009; Pearl-son & Saunders 2009).
Green IT Working to improve the phases of design, production and usage of IT hardware, software and communication systems to effectively and effi-ciently use IT as a tool in the business, with minimal effect on the envi-ronment and promoting sustainability (Murugesan, 2010).
Balanced
Scorecard Describes the mission and activities of an organization that are derived from the organizational strategy. These missions are seen through four different perspectives; financial, customer, internal processes, and em-ployee learning and growth (Niven, 2007).
Sustainability Actions that control the amount of resources used in the present, so that even the future can use the same amount of resources (Dunphy, 2011).
Green IT
Practices Within this term several practices, concepts and methods are introduced that promote Green IT and environmental awareness within IT. Table 1.1 Key definitions
2
Frame of Reference
The Frame of Reference section presents the theoretical background for this thesis. The area of Green IT will be discussed, along with definitions, drivers for Green IT and common practices often found and consid-ered in the implementation of Green IT. Those terms and practices introduced using italics will be used in the analysis section. In addition, the Balanced Scorecard model will be introduced.
Several authors have defined Green IT, such as Kristiansson (2008) and Lamb (2009). Kristiansson (2008) simply describes Green IT as applying environmental consciousness in the IT industry. Lamb (2009) defines it further and states that it is about utilizing IT more efficiently to reduce energy consumption and thus create an energy-efficient IT solution for the organization.
However, for this thesis, the authors have chosen to use Murugesan’s (2010) definition of Green IT because it is more comprehensive. Green IT, according to Murugesan (2010), is working to improve the phases of design, production and usage of IT hardware, software and communication systems to effectively and efficiently use IT as a tool in the business, with minimal effect on the environment and promoting sustainability.
As seen in Murugesan’s definition of Green IT, the topic covers a wide array of IT im-provements that can be done to decrease the environmental impact of a company. Areas within Green IT include; reduction of energy consumption, energy efficient end-user de-vices (Kristiansson, 2008), optimizing and virtualizing data centers, better communication equipment (Unhelkar, 2011a) and responsible design, use and disposal of IT products (Mu-rugesan, 2010). These are a few examples of Green IT practices that will be discussed in greater detail in this section.
2.1
Drivers of Green IT
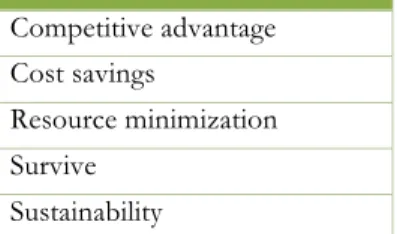
Many have stated that reducing greenhouse gas emissions for an organization will be an expensive process. However, during the last years, companies have significantly managed to reduced their carbon footprint and still been able to make a profit (Gore, 2006; Nidumolu, Prahalad, & Rangaswami, 2009). What is interesting in this statement is that even though companies find Green IT challenging and expensive, they still go through with the implementation of it. The six drivers (see Figure 2.1) discussed below may be the motivation behind the implementation of Green IT practices.
Figure 2.1 Drivers of Green IT (Unhelkar, 2011a)
Responsible Busi-ness Ecosystem Costs Government Legislation Social and Political Pressure Enlightened Self-Interest New Market Opportunities
The Costs driver pushes Green IT projects to be managed efficiently, ensuring that the most amount of costs are eliminated and that money is saved. Through Green IT implementa-tion, the organization has the possibility to optimize its processes to reduce unnecessary and costly steps (Unhelkar, 2011a), as well as reduce the amount of resources put into the process (Nidumolu et al., 2009). They can also reduce the number of physical machines, which both takes up space and uses a lot of energy (Unhelkar, 2011a). Murugesan (2008) promotes using virtualization techniques in data centers to reduce equipment costs and size.
However, it needs to be mentioned that there is a risk of miscalculating the cost of the new technology that is replacing the old. For example, if stationary computers are being re-moved from an organization to save money and space, mobile devices that in turn may in-crease operations cost in the long run might replace them. Therefore, it is important to evaluate the new costs with the old costs, as well as compare this difference with the amount of carbon reduction that could be done achieved (Unhelkar, 2011a).
Increased Government Legislation on environmental issues has put greater force on organiza-tions to improve and eliminate their carbon emissions (Murugesan, 2010; Unhelkar, 2011a). Some governments, such as the Australian government, are forcing companies to report their carbon emission annually if it is above 150 kiloton. This driver is a heavy weight for any organization as it comes from authorities and must be complied with. With the imple-mentation of Green IT, carbon reduction can be easily assessed and also done through sev-eral means (Unhelkar, 2011a). A Swedish government legislation (see p. 13 in the thesis) controls how Swedish companies run their business and demands that the business is run in a sustainable way. Further discussion on Sustainability as a driver of Green IT is done below.
The Social and Political Pressures driver only come into play depending on the type of society the organization acts and operates in. If the society sees the environment as a major actor in the value system, the organization feels pressured to do something about their carbon emission and use of environmental resources (Unhelkar, 2011a). When making buying de-cisions, today's customers have now started to take the suppliers’ environmental records and initiatives into account, giving the green organization a competitive advantage (Mu-rugesan, 2008). An example of this type of pressure is the increasingly popular Earth Hour, taking place every year since 2007, on the last Saturday in March. Started by the World Wildlife Foundation (WWF) in Australia, its main aim to prove that everyone, including children and CEOs, could do something to change the world (Earth Hour, 2012a). This pressure has now spread worldwide and in 2012 more than 150 countries and territories participated in the event (Earth Hour, 2012b).
The Enlightened Self-Interest driver occurs when the company themselves find a need to be-come more environmentally friendly. This need may be-come from the organization wanting to do a common good, personal satisfaction from top management (Unhelkar, 2011a), or for competitive reasons to look better for the end customer as compared to competitors (Lamb, 2009).
Collaborations with other, both larger and smaller companies, can cause pressure in be-coming more environmentally friendly, due to Responsible Business Ecosystems. When one company decides upon improving its processes and services to reduce carbon consumption and nonrenewable resources, they put pressure on both their suppliers and consumers to improve their own processes in turn (Unhelkar, 2011a). This will involve collaboration
be-power management policies will be set that can act both on the supplier and on the con-sumer network (Unhelkar, 2011b). However, Unhelkar (2011b) also argues that trust and security issues will arise from this tighter collaboration between partners, but may be re-solved by the growing use of cloud computing.
Green strategies are an emerging trend and are therefore a new way to compete on the market. As with any New Market Opportunity, there are a multitude of possibilities in which to compete, but as always, this requires the company to be the best in the industry. There-fore, in accordance with Green IT possibilities, the company’s strategies need to be formed in such a way that they outrival the competitors and that the company stands out as a fore-runner in the market (Unhelkar, 2011a). For example, Green IT can help a company be-come more mobile by implementing cloud computing and IT virtualization (Lamb, 2009) that are Green IT solutions removing the need for large physical storage units (Unhelkar, 2011a).
In addition to Unhelkar’s (2011a) six drivers of Green IT, Nidumolu et al. (2009) argue that
Sustainability can also be seen as an optional driver of Green IT. Sustainability is, according
to Dunphy (2011), actions that control the amount of resources used in the present, so that even the future can use the same amount of products. Also, a sustainable organization is one that actively works at removing all destructive effects from their business on the earth, contributing to current and future generations well being (Dunphy, 2011). Nidumolu et al. (2009) lists five steps in creating a sustainable organization: view compliance as an oppor-tunity, making value chains sustainable, designing sustainable products and services, devel-oping new business models and creating next-practice platforms. They argue that the initial driver of implementing Green IT is often to improve the company’s image, but that the implementation usually also results in cost reductions and new market opportunities.
2.2
Green IT Practices
According to Unhelkar (2011a), a Green Organization has three major areas in which it can influence both the way they conduct their business, as well as how their consumers and suppliers perform and run theirs; Green Processes, Green Data Center and Green Consor-tiums. This model, shown below in figure 2.2, provides a practical way of categorizing the different practices within Green IT, and it is therefore used to easily present several differ-ent Green IT practices discussed in the literature.
Figure 2.2 Major Areas of Influence of the Green Organization (Unhelkar, 2011a) Green
Processes Data Centers Green Consortiums Green Green Organization
2.2.1 Green Processes
Green Processes are operations and activities that an organization performs, focusing on Green thinking and environmental consciousness. These Green Processes have usually been reengineered from older ones to reduce the company's environmental impact and CO2 emissions. They can include both internal and external activities and can be meant to provide benchmarks and lead-by-examples to help others near the organization to follow their lead (Unhelkar, 2011a).
A device goes through three major phases in the IT asset lifecycle; Procurement, Operation and Disposal (Unhelkar, 2011a). A good beginning, or procurement, of an IT asset both assure the environmental responsibility of the asset, as well as it aids for the future phases of the IT asset’s lifecycle. According to Unhelkar (2011a), end-user devices are one of the major IT products that affects the environment and he continues to state, along with Kris-tiansson (2008) and HP (2011), that it is important to focus on buying low-powered de-vices and choosing the most environmentally friendly ones to make up for some of the negative effects. In addition, the device should be manufactured in biodegradable material, and should easily be recycled (HP, 2011; Unhelkar, 2011a). Murugesan (2008) agrees with this statement of selecting and evaluating suppliers, and argues that a trend is that companies are taking it to the next level, demanding from their suppliers to actively become more envi-ronmentally friendly in the way of doing business. HP (2011) recommends to only to buy from environmentally friendly vendors.
To assure that the procured items are environmentally built, companies can opt to choose products that are eco-labeled. There are several types of IT eco-labels, such as Energy STAR, TCO (HP, 2011; Unhelkar, 2011a) and Svanen that is the Nordic region's official alterna-tive to eco-labeling (Miljömärkning Sverige AB, 2012). These will be discussed in more depth in the Green Consortium section further down.
By changing the way in which employees operate and interact with their end-user devices, a considerable reduction in the company’s energy consumption would be possible. Turning off
a single computer might not seem profitable, but considering the hundreds, maybe thousands,
of desktop computers that are used in a company, the savings could be substantial (Mu-rugesan, 2008; Unhelkar, 2011b). Also, by introducing communication technology, such as web and phone conferences, traveling resources and emissions can be reduced (Unhelkar, 2011a).
One way of reducing the energy consumption of desktop computers, or any other end-user device is to install a sleep mode. A technique that can be used for this is to install a soft-ware that provides network-level control over PCs and monitors, and shuts down, or puts each computer into standby or hibernation mode, without harming the performance (Un-helkar, 2011b; Murugesan, 2008). The network manager can then, through the software, remotely control the power-up or power-down of the computers when, for example, back-ups are being made (Murugesan, 2008). According to the US Environmental Protection Agency (EPA), sleep mode on a computer can save 60-70% of energy and thus “reduce carbon... emission by the equivalent of 5 million cars.” (cited Unhelkar, 2011a, p. 90). In addition, by using thin-client computers, each PC will only use a fifth of the power of a normal desktop PC (Murugesan, 2008). However, this gain needs to be weighed out with the energy to support the greater bandwidth needed, as well as the need for increased cool-ing for the servers in the data centers (Unhelkar, 2011a).
When reengineering end-user device usage, the organization can aid the user to make the right decisions when printing out papers. By making two-sided, gray-scaled printing default (Unhelkar, 2011a; Unhelkar 2011b), the user actively has to choose if more resources, such as paper and ink, are needed for their printing needs. In addition, limits on papers printed per day could be set and a centralized help desk for printing documents could be opened to better control the usage (Kristiansson, 2008; Unhelkar, 2011a). Taking care of recycling pa-per and old toners is also part of better printing techniques (Unhelkar, 2011b)
When an IT assets’ life cycle ends, it becomes electronic waste (e-waste) (Tomlinson, 2010), and the components should be recycled to reduce the total impact the product lifecycle has on the environment (HP, 2011; Murugesan, 2008; Unhelkar, 2011a). However, the device’s components may not, for whatever reason, be recyclable and the public environment often blames the organization for not being able to dispose of the device in an environmentally friendly way. This consequence may not be the organization’s fault as the computer might have been designed in such a way that is not possible to recycle any component (Tomlin-son, 2010), however, the organization still has some responsibility in the matter as it can choose to buy eco-labeled products (Unhelkar, 2011a).
A renewable energy source is, according to Jönköping Energi (2012), a source of energy that can be used and will not be depleted in the foreseeable future. Unhelkar (2011a) lists six of the most common renewable energy sources available: nuclear, thermal, wind, water, solar and biomass. He continues to state that these energy sources, in addition to not depleting the Earth's resources, also can aid in the reduction of carbon emissions from the source itself - the production of the energy. Unhelkar (2011a) mentions, however, that not all regions of the world are able to provide renewable energy sources. He continues, European countries are in the lead in trials and use of renewable energy consumption. According to the Energy Administrative Authority of Sweden, during the years 2009 and 2010, 47% of all energy used in Sweden was from renewable resources. This level was not anticipated to be reached before 2015-2016, showing that the Swedish market is willing and is actively choosing en-ergy from renewable resources (cited in Hansson, 2011).
Research has previously shown that adding, or completely replacing non-renewable energy sources, with renewable ones, can create problems for companies as renewable energy sources are not as reliable as, for example, fossil fuels. However, through smart power grids, enabled by IT, supply and demand can be regulated on a more detailed level and thereby help solve the problem (Tomlinson, 2010).
According to Tomlinson (2010), the key to success in reducing energy consumption is to monitor energy usage properly and reliably. Therefore, companies should replace their old energy meters with newer, smarter ones that can create an integrated power grid that will enable them to see where the energy is being used (Tomlinson, 2010). Unhelkar (2011a, 2011b) refers to these as smart energy meters and argues that they do not only measure power consumption automatically, but also provide the organization with real-time feedback of how much energy that they are consuming and on what devices. This real-time information can then be gathered for further analysis, and some smart meters, installed correctly, can even turn off devices once they have used a given amount of energy (Unhelkar, 2011a). IBM’s vice president of energy and environment has stated in Lechner (2009) that a piece of data is on average saved thirty times on different computers and servers within an orga-nization (cited in Tomlinson, 2010). This requires a lot of space on servers, physical space, as well as it in turn causes more energy consumption. However, with the help of Document
Docu-ment ManageDocu-ment System, can either be a web-based service or an in-house server solu-tion, and its main purpose is to control all files and folders located in the business in one place, where they easily can be viewed in their different versions and read by several users (Tomlinson, 2010).
In order for all of these Green IT processes and practices mentioned above to be able to achieve and contribute to a greener organization, awareness among the employees is needed to be raised, through Green IT education (Nidumolu et al., 2009; Unhelkar, 2011b). All organizations with active Green IT practices, need to seek their employees satisfaction for a certain practice, as well as listen to and handle their concerns. It is also vital to teach them how to work with their new tasks, as well as encourage them to come up with new, greener solutions (Murugesan, 2008). Murugesan (2010) states that IT professionals and students need to be educated in the subject in order to increase the understanding of Green IT, which can be done through courses at universities and learning institutes.
By using tools such as “web portals, blogs, wikis, and interactive simulations” (Murugesan, 2008, p. 33) green awareness could be spread among IT professionals, employees, busi-nesses and also the general public. Education and knowledge of how to become green, and how to use Green IT process, is needed to help create awareness of how IT could be a contributing factor to a more environmentally friendly way of doing business for an orga-nization (Murugesan, 2008).
2.2.2 Green Data Centers
Another major IT area that influences the environment, is the multitudes of data center servers that are needed in the business, both the real servers and the backups. In this area, Green IT should be used to optimize and virtualize as many data centers as possible to bring down the number of physical units used (Unhelkar, 2011a). Pearlson and Saunders (2009) provide the example of comparing the energy consumption of five of the largest search engine companies and the maximum amount of electricity produced by the Hoover Dam in Nevada, USA. The companies used about two million servers together in 2008, needing about 2.4 gigawatts of electricity to function; the Hoover Dam produced two gi-gawatts of electricity in total in 2008.
Data centers are a big part of an organization’s hardware assets and can be built and spe-cialized to become a Green IT asset. Data centers are secure and protected environments, in which servers are stored, with large amounts of data for the organization. Data centers can be seen as the ‘heart’ of most businesses. Along with the servers necessary, network connections are in place, as well as the critical cooling units and back-up power, also known as Uninterruptible Power Supply (UPS) (Unhelkar, 2011a). The benefits that come from making data center improvements could be tax incentives and also a competitive advantage because more customers are demanding greener services (Murugesan, 2008).
To create a green data center, the physical building in which the center is housed plays a large role in how environmentally friendly the data center is. The data center can be located within a building or within several, either located in one region, or spread out across differ-ent countries. Where the building is placed, and in what region and climate, is a vital deci-sion for managers because the buildings themselves usually remain in use for about fifteen to twenty years, whilst the equipment inside may be changed every fifth year (Unhelkar, 2011a). Murugesan (2008) agrees that the positioning of the data center is important and should be chosen with regards to the use of natural light, cooling and ventilation.
There are several different Green practices that can be used in data centers. Blade servers are one of them and are a relatively new technology where several servers share networking devices, administrative modules and fan-modules in a base frame. Older types of severs, monolithic servers and rack servers, all have their own networking, administrative and fan modules making them larger in size and more drift expensive. By instead sharing these modules, the data center becomes more energy efficient and at the same time minimizes hardware usage and physical space needed in the data center (Frennesson & Gustavsson, 2008).
Virtualization initiatives can be defined as “running multiple virtual computers on a single
physical computer” (Jain et al., 2011, p. 28), which improves hardware utilization and re-duces the total data center energy demand. By reducing the number of physical servers in the data center, data center floor space and building size is also decreased, as well as less employees are needed (Murugesan, 2008; Unhelkar, 2011a). Virtualization work through providing a layer between the hardware and the software allowing all operating systems to communicate with the same hardware simultaneously (also known as thin client-fat server) (Frennesson & Gustavsson, 2008), leading to better use of the computers’ resources, and higher efficiency and usage of the servers (Frennesson & Gustavsson, 2008; Unhelkar, 2011b).
Cooling strategies are vital for the performance and the lifetime of components within data
centers. However, cooling is not an easy task because all electrical objects within the data center emit heat radiation, including the cooling units themselves (Frennesson & Gustavs-son, 2008). Nevertheless, installing a cooling system is one of the most concrete ways to adopt Green IT practices (Unhelkar, 2011a). Below, two types of cooling systems are dis-cussed.
Free cooling is a technique in which the data center is cooled by drawing in cold outside air into the data center. This technique works best in regions where the average temperature, over a year, is low. For example, regions in the north of Sweden, such as Luleå, have an av-erage year temperature of 1-2 degrees Celsius and are therefore suitable for free cooling in data centers (Brundin, 2011).
A popular arrangement for server racks, is to place the fronts of all servers facing the same direction in which the cool air is blowing. The fans in the servers then draw in the cool air transporting it through the entire server, whilst cooling it and emitting hot air through the back. The backs of all the servers face the exhaust fan transporting the hot air out of the data center (Unhelkar, 2011a).:)See figure 2.3 below.
Figure 2.3 Servers in hot-aisle-cold-aisle arrangement (Unhelkar, 2011a)
PUE stands for Power Usage Effectiveness and can be used as a metric to make data centers more effective. If a data center has a PUE value of 1, all energy consumption is used solely for computation and the data center has therefore reached total effectiveness. However, if the value goes above 1, this indicates that energy is also used for other activities than com-puting, for example cooling or lights. In the current industry, a PUE of 2 is considered to be good (Tomlinson, 2010).
2.2.3 Green Consortiums
This is the section that allows organizations to lead the change. Consortiums allow organi-zations to join and lead the changes with already existing standards and initiatives, showing consumers that they are serious and may even invite suppliers or others in their environ-ment to follow their lead (Unhelkar, 2011a).
Protocols are international agreements, formed by political leaders from the entire world that bind countries to certain emissions controls and carbon reduction plans. An example is the well-known Kyoto Protocol, where the main aim is to stabilize the concentration of greenhouse gases to a level that would prevent danger to the climate (Unhelkar, 2011a). In addition to protocols, standards provide a framework for organizations to aid in envi-ronmental management and also provide a benchmark for companies to compare them-selves to others, both internationally and domestic. An example is the ISO 14000:2004 family that is the most common for environmental frameworks (Unhelkar, 2011a; Unhel-kar, 2011b).
The International Organization for Standardization (ISO) has created the ISO 14001 stan-dard to certify organizations implementing “Green IT strategies, metrics, reporting, and continuous improvements” (Unhelkar, 2011a, p. 332). This standard provides guidelines of what the company should perform, and excel at, within Green IT practices. It contains a policy defining environmental objectives that the organization has to consider, a plan of what process, technologies and user factors are required, as well as a risk assessment and product life cycle assessment. The standard also contains implementation and operating techniques, including education and training programs, and how to communicate the change. Lastly, checking and making corrective actions, and management review techniques are available for the organization (Unhelkar, 2011a).
Initiatives are an additional consortium that includes personal, industrial, or government actions driven by, in many cases, self-interest in the area. These initiatives, for example in-dustrial ones, such as Energy STAR and TCO, not only aid the industry, but also allow other organizations and private users to choose Green IT strategies and products (Unhel-kar, 2011a).
Energy STAR is a voluntary initiative that labels energy efficient products to help
consum-ers identify products built for lesser energy consumption. The initiative regulates how much external and internal power supply and consumption the device is allowed to have for different modes, such as sleep, idle and active (Murugesan, 2008). This label has, since its start in 1992, promoted energy-conscious decisions and saved billions of dollars in en-ergy consumption reduction (Unhelkar, 2011a).
TCO Certification was launched in 1992, as an initiative in quality and environmental
con-trol for IT equipment. The initiative “covered electromagnetic fields, energy efficiency and electrical and fire safety” (Sundblad, Lind & Rudling, 2002, p. 1). The requirement have since then been adapted further to include ergonomic and ecological initiatives. TCO Certi-fication is seen as an international de facto in initiative surrounding IT devices (Sundblad et al., 2002).
Svanen is an eco-labeling initiative from the Swedish government that promotes reduction
in energy consumption, as well as to reduce the amount of hazardous chemicals used in the production of computers. Svanen places very high demands on the manufacturers of com-puters as they demand that the comcom-puters should be designed in such a way that they are easy to upgrade and repair whilst still in working order and when the computers are ready to be disposed of, they should easily be recycled (Miljömärkning Sverige AB, 2012).
Legislations are passed by a country's government, specifying certain requirements and le-gal compliances that all organizations within the country need to comply with. This enables better trade among partners and a platform from which additional Green IT strategies can stand upon (Unhelkar, 2011a). The strongest Swedish legislation, regarding environmental protection is the Environmental Code (Miljöbalken 1998:808) that came into effect 1998. This legislation's main aim is to promote a sustainable community development that does not compromise the present, nor the coming, generations’ health and environment. The legislation controls the need to protect the environment, whilst still allowing the population the right to use and change the environment around them responsibly (Sveriges Riksdag, 2012).
In addition, the Ministry of Industry, Employment and Communication in the Swedish Government Offices have specified that the goal for IT-politics is to create a sustainable information community for all citizens of Sweden. IT should be used to promote sustain-able growth through resource- and energy-efficient solutions that promote efficiency, im-provement and international competitiveness (Regeringskansliet, 2012).
2.3
The Balanced Scorecard
The Balanced Scorecard model allows for an accessible and comprehensible way of de-scribing the mission and activities of an organization (Olve & Sjöstrand, 2006). It should be derived from an organization’s strategy and can be used as a tool to communicate to the users and external stakeholders, the firm's mission and strategic objectives, through out-comes and performance drivers (Niven, 2007).
Effective scorecards represents “cause and effect relationships between current activities and long-term success” (Olve & Sjöstrand, 2006, p. 1) and has several different usage areas:
Effective execution of a new strategy (Niven, 2005). The Balanced Scorecard is known for its
ef-fectiveness in helping an organization execute its strategy through its objectives, measures, targets and initiatives. However, it is important to note that the scorecard was not devel-oped to aid companies in developing a new strategy, it was created to support companies in their progress toward executing their already existing strategy (Niven, 2005).
Discussing activities that are motivated by strategic aims rather than current necessities and how they will pay off in the future, such as development of competencies, customer relationships and IT
(Olve & Sjöstrand, 2006). The creation of a Balanced Scorecard may lead the organization to reconsider their strategic objectives and thereby enable the creation of a new strategy (Niven, 2005). Olve & Sjöstrand (2006) also mentions that some organizations mainly use the Balanced Scorecard to discuss strategies and have not implemented it further.
Communicating strategic intentions (Olve & Sjöstrand, 2006). By stating desired outcomes and
performance drivers (Niven, 2007), the Balanced Scorecard can help the organization achieve their long-term goals by channeling the employees’ energy, knowledge and activi-ties (Kaplan & Norton, 1996). It can also be used when prioriactivi-ties, and causes and effects, needs to be communicated (Olve & Sjöstrand, 2006).
Monitoring and rewarding strategic activities. The Balanced Scorecard approach can also be used
as a tool to check the progress of the strategy execution and what has been achieved so far (Olve & Sjöstrand, 2006).
Developing external collaborations. As outsourcing and external partnerships are becoming more
common in the present business world, the Balanced Scorecard can be used as a way of creating and maintaining lucrative relations between parties. The collaborations in supply chains, and external supplier relations, require formal and informal contracts that span longer periods than normal market relations. The purpose of these partnerships is to find joint business practices that are profitable for both parties, not to find the most cost-effective product for the individual organization (Olve, Petri, Roy & Roy, 2003).
Since the start of the modern way of doing business, executives have been using financial measures, but in today’s world of changing business requirements, it is not enough. (Niven, 2007). Niven (2007) gives five reasons for why the use of financial measures has become overabundant: financial measures are not consistent with today’s business realities; it only measures past performance; it tends to reinforce functional silos; it may sacrifice long-term thinking, and; financial measure are irrelevant to many levels of the business.
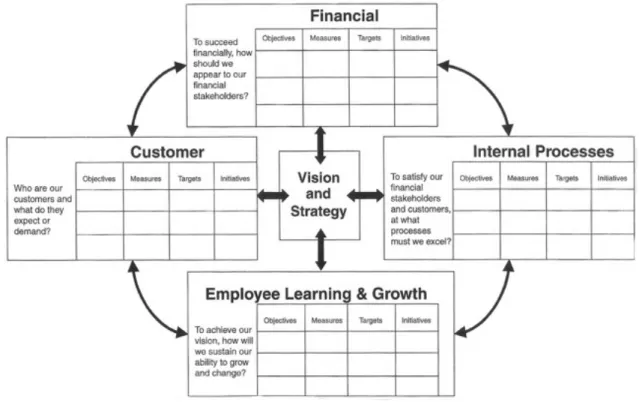
The Balanced Scorecard model (see Figure 2.4) was first introduced in 1992 by Kaplan and Norton, and has since then become a widely adopted approach to management control and performance management by both business and government (Niven, 2007). Kaplan and Norton (1996b) recognized that business requirements were changing and that firms’ abil-ity to capitalize on intangible assets were becoming more important than their management of tangible assets.
The Balanced Scorecard was created as a complement to financial measures, not as a sub-stitute (Kaplan & Norton, 1996b), and worked on balancing the four perspectives in order to give a comprehensive description of the business. It not only gives information about the company’s objectives from four different perspectives, it also considers the time di-mension, meaning that past investments may have consequences for today’s profitability (Olve & Sjöstrand, 2006).
Figure 2.4 The Balanced Scorecard model (Niven, 2007) 2.3.1 The Balanced Scorecard Model
Kaplan & Norton (1996a) states that a Balanced Scorecard should be derived from an or-ganization’s unique strategy. By using the Balanced Scorecard, the strategy and vision of the company can be converted into performance measures that include both outcome meas-ures and the drivers of these measmeas-ures. For a strategy to be successful, it needs to consider financial ambitions, processes to be improved, markets served and the people in the orga-nization that actualize the strategy (Niven, 2007). The Balanced Scorecard uses all these as-pects by considering both internal and external asas-pects (Olve & Sjöstrand, 2006).
Every perspective should contain four different sections: objectives, measures, targets and initiatives. For employees to be able to act upon the organization’s vision, translating the strategy and mission of the company into objectives is the first step in the creation of each perspective. Strategies like “an empowered organization” (Kaplan & Norton, 1996b, p. 76) is hard to realize in practice and senior executives should therefore create understandable and actionable objectives, along with defined measures to keep track of the progress of reaching each goal (Kaplan & Norton, 1996b).
Each measure should then be associated with a target (a short-term goal) that works as a milestone to assist in evaluating the progress of each objective. The last column in each perspective should be initiatives, describing actions that should be undertaken by the firm to reach each objective (Kaplan & Norton, 1996b).
In order to achieve a balance between intangible and tangible assets, Kaplan and Norton (1996a) created four different perspectives that contained financial, customer, internal processes and employee learning and growth aspects. Critical success factors, strategic goals, measures and action plans is to be created for each perspective, using the company’s overall vision as a starting point (Olve & Sjöstrand, 2006).
The relationship between the different perspectives is shown through cause and effect rela-tionships. To achieve financial profitability, the organization must satisfy their customers and become more efficient by excelling at key business processes. The customers can only be satisfied by improving business processes in such a way that they are suitable to custom-ers’ needs. Internal processes are improved by learning and developing business require-ments in the future through value propositions and internal processes (Olve & Sjöstrand, 2006).
Even though intangible assets are becoming more important, financial measures are still crucial to the organization since its efforts in customer satisfaction and internal processes will not be of value unless it is shown in the firm’s financial returns (Niven, 2007).
The financial perspective should be used to ensure that the organization is implementing and executing their strategy proposition effectively and cost-efficiently, getting a positive effect in the bottom-line results. Indicators in this perspective are usually lagging, showing past performance and includes profitability, asset utilization and revenue (Niven, 2005).
Typical financial goals consider growth, profitability and shareholder value, and ‘to survive, succeed and prosper’ are examples of these. To measure these financial goals, success by quarterly sales growth, increased market share by segment, return on equity and cash flow, can be used (Kaplan & Norton, 1992).
The customer perspective of the Balanced Scorecard forces managers to translate their, often customer-focused, mission into measures that can help to evaluate what really matters to the customers and the firm’s progress in meeting those requirements (Kaplan & Norton, 1992). Niven (2007) states that the customer perspective should declare who the organiza-tion’s target customers are, what they demand or expect and what the company’s value proposition is towards them.
Customers’ concerns often fall into different categories: quality, time, cost and perform-ance and service. These different categories can be measured in several ways. For example, quality can be measured through on-time delivery (Kaplan & Norton, 1992) and “defect level of income products as perceived and measured by customers” (Kaplan & Norton, 1992, p. 73). The time aspect can be measured by looking at different lead-times and by measuring how the company’s products or services creates customer value, performance and service can be evaluated (Kaplan & Norton, 1992). Other typical customer measures are customer satisfaction, market share, customer loyalty and customer acquisition. Like the financial perspective, the measures of the customer perspective are often lagging (Niven, 2007).
When working with the internal processes perspective of the Balanced Scorecard, managers should consider the processes and competencies that they need to improve in order to in-crease customer satisfaction and meet customers’ needs. Therefore, measures in this per-spective should be derived from the business processes that impact the customers the most (Kaplan & Norton, 1992). Niven (2007) states that one of the challenges to the internal perspective is to find what processes are the most important to excel at and the best way to
the four categories mentioned above and, for example, if reliability is an important factor for the organization’s customers, maintenance should be considered in the internal per-spective and be seen as a process that the company should excel at (Niven, 2007). Exam-ples of processes often discussed in this perspective are “product development, produc-tion, manufacturing, delivery, and post-sale service” (Niven, 2007, p. 201).
The employee learning and growth perspective is usually the last perspective that is developed in the creation of a Balanced Scorecard and recurring aspects to be considered are employee satisfaction and skills, and alignment and availability of information (Niven, 2007). The goals of this perspective enable the success of the others and should be designed to close the gap between the present infrastructure of the company (including organizational, in-formational and human capital) and the firm’s desired direction of IT (Niven, 2007). The organization’s ability to improve existing processes and skills, as well as introducing new products and practices, is crucial for its survival. Companies should therefore, through this perspective, make sure that it can respond to future changes in business requirements (Kaplan & Norton, 1992).
3
Method
In this section the philosophy behind this research will be discussed, along with the research approach and design that has been chosen. After that, the data collection techniques for the secondary data and empirical findings are shown and the credibility of the research will be argued for. Finally, the analysis process will be discussed in length, showing how the resulting Green IT Balanced Scorecard model was made.
3.1
Research Philosophy
Saunders, Lewis and Thornhill (2009) argue that the research philosophy of a research con-tains assumptions about how the authors view the world and this view should underpin the research strategy of the work. The research philosophy of this study is direct realism, as it takes the viewpoint that things exist independently of the human mind (Saunders et al., 2009). The authors believe that the Green IT practices found through the secondary data and the empirical findings, which will be discussed below, exist in spite of what the practi-tioners, for example the interviewees, believe and perceive Green IT to be. However, the authors realize that Green IT is a dubious concept that may result in Green IT practices being interpreted differently and thereby used differently.
3.2
Research Approach
This thesis is grounded on an inductive research approach that develops the resulting the-ory after data has been collected (Saunders et al., 2009). The thesis work started with a data collection period, where data was collected from both the literature and company inter-views. The findings from these data searches were analyzed and resulted in a Green IT Bal-anced Scorecard.
Creating the Green IT Balanced Scorecard in advance and testing it with reality, which would have been consistent with a deductive approach (Saunders et al., 2009), might also have given good results. However, with this approach some vital questions and findings might have been missed because the authors were too focused on the already proposed so-lution. The inductive approach forces the study to look for all possible solutions and ways of thinking around Green IT, and therefore receive a fuller picture on the matter.
3.3
Research Design
3.3.1 Research Purpose
Robson (2002) defines exploratory studies as “[finding out] what is happening; to seek new insights; to ask questions and to assess phenomena in a new light” (cited in Saunders et al., 2009, p. 139). As mentioned previously, research on Green IT in Sweden, and Green IT Balanced Scorecards internationally, has already been conducted. However, no research has been done on a Green IT Balanced Scorecard model based on the Swedish environment. Thus, in this subject the authors see that research on the matter is needed. This thesis sets out to see what Green IT practices are currently used in the Swedish environment with the help of the different perspectives of the Balanced Scorecard. The authors mean to asses Green IT practices in Sweden, through a new light and create a new Green IT Balanced Scorecard model separate from those previously done. In other words, not based on the previous research of Green Balanced Scorecards. Therefore, this study is exploratory in the sense that new insights are being explored by looking at practices in the Swedish environ-ment and presenting these in the Balanced Scorecard model. The reason for doing this is to
create a model exclusively for the Swedish environment that was not influenced by outer sources or other regions.
3.3.2 Research strategy
The authors have chosen to use case studies in this research. Case studies are defined as “a strategy for doing research which involves an empirical investigation of a particular con-temporary phenomenon within its real life context using multiple sources of evidence” (Robson, 2002, cited in Saunders et al., 2009, p. 146). Morris and Wood (1991) defines it further by saying that case studies can give a deeper understanding of the research context and its processes (cited in Saunders et al., 2009). This is consistent with the purpose of in-vestigating what Green IT practices are used within the Swedish environment, and then applying these to the perspectives of the Balanced Scorecard model.
Yin (2003) establishes two dimensions in case study strategies that the researcher need to choose between (cited in Saunders et al., 2009):
single case v. multiple case; holistic case v. embedded case.
For this thesis, a holistic multiple case study technique was used. Using multiple cases from separate industries allowed the authors to base their research on the Swedish environment that is in accordance to the research question. This strategy ensures that the practices found reach similar results and that they are not unique to a particular industry, but actually used throughout the Swedish environmental. Thus reaching literal replication, as defined by Yin (2003). This study also takes a holistic view of the organization, seeing it as a whole, and does not concern any specific departments, since Green IT is used throughout the organi-zation, even though it is mostly managed by the IT department.
When using a case study strategy, the data can be triangulated, in other words using several data collection techniques within a study in order to ensure that the data is reliable (Saun-ders et al., 2009). This was achieved in this study by comparing the resulting practices from the empirical findings with the Green IT practices found in the literature. Hence ensuring that the IT practices considered to be “green” by the Swedish companies are also consid-ered to be Green IT practices in the scientific environment.
3.3.3 Method Choice
Saunders et al. (2009) explains that quantitative and qualitative data can be used for data collection and analysis. The authors have chosen to use qualitative data collection and analysis techniques in order to find and understand techniques and concepts of Green IT practices and to be able to find the IT practices that are considered to be “green” by Swed-ish organizations. Since Green IT is a dubious concept, a qualitative method choice will al-low the authors to get more accurate findings that will provide context to the thesis. This thesis is built upon multi-method qualitative study as it uses two data collection tech-niques and one analysis procedures (Saunders et al., 2009). Two different data collection techniques have been used in order to ensure triangulation of data.
3.3.4 Time Horizon
This study has a cross-sectional time horizon that Saunders et al. (2009) defines as a ‘snap-shot’ of a particular phenomenon at a certain time. As the research question concerns what
practices are used in Swedish companies at the moment of the interview, the study will re-sult in a “snapshot” of Green IT practices in the current Swedish environment which may cause difficulties for the replication of this study.
3.4
Data Collection Techniques
Secondary data from litetarture, which Saunders et al. (2009) defines as data collected pre-viously for another purpose, and interview data collected for emprirical findings are the two sets of data used for this study.
3.4.1 Secondary Data
A preliminary literature search was started in order to get to know the subject area and to create, and later refine, the research question. The parameters for the literature search were to find publications in both English and Swedish, within the subject area of Green IT. No specific geographical area or publication period was selected.
Saunders et al. (2009) lists three different types of literature sources; primary, secondary and tertiary sources and in the preliminary search all three of these sources were included The search started with exploring the Internet, using the search engine Google Scholar, the Jönköping University Library website and the Swedish website for academic research, DIVA, that are tertiary sources. Initially, the only keywords used were ‘Green IT’, and the Swedish translation ‘Grön IT’. After the preliminary search was started, it was found that the scientific journal IT Professional and the author Murugesan had published a considerable amount of material on the subject matter and had been referred to in many of the sources that were found. Thus, these two also became keywords used in the search, as they are key actors within the subject field.
Literature from several different sources, both primary and secondary, focusing on differ-ent aspects of Green IT was found. The findings both included discussions of the overall topic of Green IT, the evolution of it and techniques that were considered to be Green IT practices. In addition, this created the basis for the Frame of Reference section that was later expanded further as new techniques were found through the empirical findings, men-tioned below.
The purpose was to find Green IT practices and not further explain how each technique is technically implemented or evaluated. Therefore, focus was only put on the literature that explained why they were considered to be Green IT practices. Also, many of the resources considered several techniques in one publication, such as Unhelkar (2011a) and Tomlinson (2010), and therefore they were considered as key literature for the Frame of Reference. As a further matter, to find more information about the Balanced Scorecard model, the Jönköping University library was used for book search on the topic. The authors had both worked with the model in previous courses and therefore material from these was used. 3.4.2 Empirical Data
Saunders et al. (2009) defines semi-structured interviews as interviews that are based on a list of themes or questions that the researcher follows. However, depending on the flow of the conversation, the order of these themes or questions can be altered. Some themes or questions may also be added if they are significant to the organizational context, or ex-cluded if they are not (Saunders et al., 2009).
The reason for choosing this interview type was to get deeper understanding of the Green IT practices used in Sweden. In the initial stages of the literature search, the authors found that several authors defined Green IT differently and it was therefore assumed that the companies would also have different views on the topic. Semi-structured interviews en-abled the authors to explore the interviewee’s thoughts and perceptions of Green IT that resulted in practices that had not been considered before. This could not have been achieved through sending out a questionnaire to the companies.
Based on the literature that was found on Green IT and the Balanced Scorecard model, an interview guide was created and that can be found in Appendix 1. These questions all con-sidered the different perspectives of the Balanced Scorecard model and tried to find out what Green IT practices the companies used. However, these questions were only used as guidelines for the interviews and sent to the interviewees beforehand so they could prepare, making sure that all topics were covered. Three of the interviews were conducted face-to-face and became more of a discussion, where the companies explained what practices they were using, the thoughts behind them and how they worked. One of the interviews was conducted over the telephone and over email, due to time limit on the interviewee’s side. This interview was shorter and only explained what practices that were used and did not go into the same level of detail as the other interviews did.
The three face-to-face interviews were all audio-recorded, with the interviewees’ permis-sion, and transcribed within days of the interview in order to assure that data was not lost. The transcriptions and notes were for internal use only and were not sent to the compa-nies. However, in order to ensure that the data had not been misunderstood, the individual empirical findings were sent out to each company interviewee, before the thesis was pub-lished, so they could approve the Result section.
In the thesis, the company and the interviewees’ names have been removed to eliminate the possibility of biases towards the companies chosen or the people interviewed. The com-pany names have been changed to Comcom-pany A, B, C and D, depending upon the order of the interviews. In other words, the interview with Company A was held first, Company B second and so on.
There are two types of sampling techniques, probability and non-probability. Non-probability sampling was used for this study, where the Non-probability was not known, and was done through the researcher’s subjective judgment (Saunders et al., 2009). This technique was chosen because the research question did not require any statistical valuation of the population.
The sampling technique used was purposive sampling, with a heterogeneous sampling strategy. A purposive sampling technique can be applied when a small sample is used, such as in case studies, and lets the researcher use his or her judgment to find the cases that will best suit the purpose of the research. This technique also allows the researcher to find cases that are especially valuable and informative than others (Neuman, 2005, cited in Saunders et al., 2009). Moreover, a heterogeneous sampling strategy permits the researcher to ob-serve and describe the key themes in the subject. Patton (2002) argues that even though the sample size might be small, it can still contain cases that are different from each other, which can enable the researcher to find key themes that are particularly valuable and also define uniqueness (cited in Saunders et al., 2009).
To be able to find cases that were more informative than others, the Internet was used to search for companies that had a stated climate policy on their website. The companies were