Pooled individual patient data from five
countries were used to derive a clinical
prediction rule for coronary artery disease in
primary care.
Marc Aerts, Girma Minalu, Stefan Bösner, Frank Buntinx, Bernard Burnand, Jörg Haasenritter, Lilli Herzig, J André Knottnerus, Staffan Nilsson, Walter Renier, Carol Sox,
Harold Sox and Norbert Donner-Banzhoff
Journal Article
N.B.: When citing this work, cite the original article. Original Publication:
Marc Aerts, Girma Minalu, Stefan Bösner, Frank Buntinx, Bernard Burnand, Jörg Haasenritter, Lilli Herzig, J André Knottnerus, Staffan Nilsson, Walter Renier, Carol Sox, Harold Sox and Norbert Donner-Banzhoff, Pooled individual patient data from five countries were used to derive a clinical prediction rule for coronary artery disease in primary care., Journal of Clinical Epidemiology, 2017. 81(), pp.120-128.
http://dx.doi.org/10.1016/j.jclinepi.2016.09.011
Copyright: Elsevier
http://www.elsevier.com/
Postprint available at: Linköping University Electronic Press
Deriving a clinical prediction rule for coronary artery disease in primary
care: improving internal and external validity by pooling individual
patient data from five international sites
By the members of the International Working Group on Chest Pain in Primary Care (INTERCHEST): Marc Aerts (Ph.D)1, Girma Minalu (Ph.D)1 Stefan Bösner (MD, MPH)2, Frank Buntinx (MD, Ph.D)3, Bernard Burnand (MD, MPH)4, Jörg Haasenritter (RN, MScN)2, Lilli Herzig (MD)5, J. André
Knottnerus (MD, PhD)6, Staffan Nilsson (MD)7, Walter Renier (MD)3, Carol Sox (Engr)8, Harold Sox (MD)9 , Norbert Donner-Banzhoff (MD, MSc)2
1 Hasselt University, Interuniversity Institute for Biostatistics and Statistical Bioinformatics (I-BIOSTAT), Belgium; 2 University of Marburg, Department of General Practice/ Family Medicine, Germany; 3 Katholieke Universiteit Leuven, Department of General Practice, Belgium; 4 Institute of social and preventive medicine, Lausanne University Hospital, Switzerland; 5 Institute of General Medicine, University of Lausanne, Switzerland; 6 University of Maastricht, Department of General Practice, Netherlands; 7 Linköping University, Primary Health Care and Department of Medicine and Health Sciences, Norrköping, Sweden; 8 formerly Department of Family and Community Medicine, Geisel School of Medicine at Dartmouth, USA. 9 The Patient-Centered Outcomes Research Institute, Washington, DC, USA and Geisel School of Medicine at Dartmouth, Hanover, New Hampshire, USA.
Correspondence to: Marc Aerts
Hasselt University, Interuniversity Institute for Biostatistics and Statistical Bioinformatics (I-BIOSTAT)
Address: Campus Diepenbeek, Agoralaan Gebouw D, 3590 Diepenbeek, Belgium Tel: ++32-11-268247
E-mail: marc.aerts@uhasselt.be Word count: 3796
Abstract (250 words)
Objective: To construct a clinical prediction rule for coronary artery disease (CAD) presenting with
chest pain in primary care.
Study Design: Meta-Analysis using 3099 patients from 5 studies. To identify candidate predictors,
we used random forest trees, multiple imputation of missing values and logistic regression within individual studies. To generate a prediction rule on the pooled data, we applied a regression model that took account of the differing standard data sets collected by the 5 studies.
Results: The most parsimonious rule included six equally weighted predictors: age>55 (males) or
>65 (females)(+1); attending physician suspected a serious diagnosis(+1); history of CAD(+1); pain brought on by exertion(+1); pain feels like “pressure”(+1); pain reproducible by palpation(-1). CAD was considered absent if the prediction score is <2. The AUC was 0.84. We applied this rule to a study setting with a CAD prevalence of 13.2% using a prediction score cut-off of <2 (i.e., -1, 0, or +1). When the score was <2, the probability of CAD was 2.1%(95%CI:1.1-3.9%); when the score was ≥2, it was 43.0%(95% CI:35.8-50.4%).
Conclusions: Clinical prediction rules are a key strategy for individualizing care. Large data sets
based on electronic health records from diverse sites creates opportunities for improving their internal and external validity. Our patient-level meta-analysis from 5 primary care sites should improve external validity. Our strategy for addressing site-to-site systematic variation in missing data should improve internal validity. Using principles derived from decision theory, we also discuss the problem of setting the cut-off prediction score for taking action.
Keywords [MeSH] Chest Pain, individual patient data meta-analysis, Myocardial Ischemia, Medical
History Taking, Symptom Assessment, Primary Health Care, Sensitivity and Specificity
1 Introduction
Applying individual patient meta-analysis to create clinical prediction rules is methodologically difficult when primary studies, acting independently, do not collect the same standard data sets. Methods to summarize the measures of prediction (e.g. regression coefficients) across studies must account for the data that individual studies did not try to collect. We encountered this problem when we used data from 5 independent studies of chest pain to develop a clinical prediction rule for initial assessment of patients presenting to a primary care setting. Chest pain is an important diagnostic problem in primary care, where 0.7% to 2.7% of patient encounters are due to chest pain [1–3], and coronary artery disease is the cause of chest pain in 8.6 to 14.6 % of patients [3, 4]. Clinical prediction rules developed in emergency departments, specialty clinics, or hospitals may not apply to primary care because diagnostic test results (e.g., an electrocardiogram) are
incorporated in the prediction rule in those settings.
2 Methods
2.1 Data Sources and Study Selection
We conducted a systematic literature search to identify studies potentially suitable for inclusion in a patient-level meta-analysis [5]. We describe the search and selection process in Appendix 1. We defined primary care as an outpatient or clinic setting other than an emergency department. We identified studies that had prospectively obtained data on symptoms and signs and established a
final diagnosis of CAD in consecutive adult patients presenting with chest pain in primary care. We excluded studies if the patients received care in a hospital emergency department or had been pre-selected for evaluation because of suspected CAD.
Included studies:
We identified eight potentially eligible studies. We did not include 3 studies because individual patient data were not available [6], we could not contact the principal investigators [7], or the study was ongoing when we conducted our analysis [8] (see Supplement Figure 1). The 5 included studies had a total enrollment of 3099 patients [2, 4, 9–11]. Table 1 summarizes characteristics of the studies. All studies had investigated prospectively the diagnostic accuracy of symptoms and signs for CAD in consecutive patients with chest pain in a primary care setting. To establish the final diagnosis, study patients were followed up for a defined period, and study physicians used the clinical course and results of tests to establish the cause of the index episode of chest pain. This delayed-type reference standard can be an acceptable and valid alternative when a single reference test is not possible [12]. The five studies differed in the length of follow-up. The physicians making the final study diagnosis were not blinded to the initial history and physical examination findings.
- Table 1 about here -
2.2 Data management
Principal investigators of the eligible primary studies were invited to join the INTERCHEST collaboration and to provide the raw data and information on inclusion criteria, patient
recruitment, data collection, and diagnostic reference standard. If necessary, we translated the original questionnaires or case report forms into English and created a synopsis of definitions of all variables used in each study. We excluded symptoms and signs that only one study obtained
a common definition across the 5 data sets. The authors of each study verified that the meaning of each variable was consistent with its counterpart in their study.
2.3 Data analysis
Overview of Methods
Our objective was a clinical prediction rule for estimating the probability that CAD is the cause of a patient’s chest pain. Here, we give a short overview of our methods. Figure 1 provides a schematic depiction.
- Figure 1 about here –
In all analyses, the dependent variable was a CAD diagnosis (both stable and acute forms) for the index episode of chest pain, as determined by a study clinician or an expert panel at least several months after the index visit, taking all available information into account (Table 1). We excluded cases that lacked a final diagnosis. Items of the medical history or clinical examination were the predictor variables. We imputed data that a study collected routinely but were missing in an individual patient, generating five imputed data sets for each original study. We identified the best predictors within each study, using random forest trees and logistic regression. We created five imputed meta-data sets, each including one imputed data set from each original study, and, for each imputed meta-data set, fitted a logistic regression model in which the independent variables were the best predictors in each study and the dependent variable was a CAD diagnosis. We combined the results from each model (see below for details) and, to derive an easy-to-use clinical prediction rule from this model, reduced the number of predictors to six by removing the weakest predictors and by replacing the regression coefficients by 1 (if β > 0) and -1 (if β< 0), respectively. We calculated the area under the ROC curve to measure how well the models discriminated
between patients with and without a final diagnosis of CAD. We calculated sensitivity, specificity, likelihood ratios and predictive values for all studies that provided data on all predictors included in the final, simplified model. To test for over-fitting the model, we performed an internal validation using a three-fold cross-validation approach [13]. To test the performance of the rule in patients with acute and non-acute pain, we calculated likelihood ratios for each variable in the rule in both sub-groups, plotted the ROC curve and calculated the AUC. [14]
Details of the methods:
Missing values – A study that combines retrospective data from several sources can have 2 sources
of missing data: within-study missingness and between-study missingness. If a study routinely recorded a specific predictor, but its value was missing for individual patients within the study (within-study missingness), we considered these as missing at random and performed multiple imputation. As imputed data are not truly observed data and are random on their own, multiple imputation is needed in order to get valid inference at the final stage of analysis (five imputation are considered sufficient, see [15, 16]). Using imputation by chained equations [17], we created five [18] imputed datasets for each of the studies, selected the candidate predictors across studies (see below) and then merged them into 5 imputed meta-datasets, each of which included a different imputed dataset from each of the five studies (see Figure 1).
The regression analyses of the meta-data took into account between-study missingness: some of the selected candidate predictors had been recorded routinely in some studies but were not obtained in other studies (between-study missingness). In fact, only two predictors had been obtained routinely in all 5 studies. The regression models fitted on the meta-data took account of the differing sets of predictors that the individual studies had routinely collected (see formula 1 in
Supplement 3). The estimation of the effects of the two predictors common to all 5 studies was based on data from all studies, whereas the effects of the other predictors were estimated using data from the studies that collected data on these predictors [19].
Selection of candidate predictors – This section describes a two-step process for identifying
candidate predictors from each individual study. in step 1, we used a random forest algorithm to identify the most important predictors in each study. The random forest algorithm cycles many times through a process of constructing a classification tree by random selection (with
replacement) of cases from a study (the set of all such trees is a forest). The tree is constructed by testing a random subset of predictors at each node to determine which one provides the best discrimination. The most commonly occurring predictor among the set of predictors at all terminal nodes of each tree is the classifying predictor for the tree. The candidate predictors for the forest are the classifying predictors appearing most frequently over all the trees in the forest [20]. In step 2, we fitted logistic regression models using the forest candidate predictors as the independent variables and a CAD diagnosis as the dependent variable. As noted above, we repeated this process for each of the 5 imputed data sets of each original study. All statistically significant predictors (α≤0.05) in the logistic models from at least one of the imputed datasets from each original study were included in the candidate predictor list for the patient-level meta-analysis.
Meta-analysis and derivation of the diagnostic model - We fitted a logistic regression model to each
imputed meta-dataset (created as described in the section on missing values). We used a fixed effects regression model with study-specific intercepts 𝛽𝛽0𝑖𝑖2Tand study-specific dummy indicators 𝐼𝐼𝑘𝑘𝑖𝑖
(formula 1). The study-specific intercepts account for the different CAD prevalences across studies while accounting for the effect of the predictors. The study-specific dummy indicators account for the different predictor sets across studies, with the indicator 𝐼𝐼𝑘𝑘𝑖𝑖taking value 1 if data on predictor k were obtained for study i, and 0 otherwise. Regression coefficients and their standard errors from
the five imputed datasets were combined according to the rules of multiple imputation, as
proposed by Rubin [15, 16]. All predictors that were significant (α ≤ 0.05) were combined into one linear score to be used for classifying patients (see Supplement 3 in Appendix).
Prediction rule sensitivity, specificity, and discrimination: In applying the classification rule to a
specific patient, the clinician can ascertain the value of each predictor (present or absent); since all predictors are available, all availability-indicators would be equal to 1. For the application of the rule on our original data set, we need to include the indicator in formula in Supplement 3 as we need to compute the score for all patients in our five studies and not all predictors are available for all studies. We applied the rule to all the patients in the five studies, each of which had been classified as having a CAD diagnosis or not. Using different cut-off values of the chest pain score, we calculated sensitivity and specificity and the area under the ROC curve.
Internal validation - We randomly partitioned the entire sample of patients into three sub-samples.
We performed the steps of the meta-analysis, model derivation and model simplification three times, taking one of the sets as the test sample, the other two as learning samples.[21].
Sensitivity analyses: We performed two sensitivity analyses. One measured the sensitivity, specificity, likelihood ratios, and discrimination (AUC) of the chest pain rule in patients with acute chest pain and patients with chronic chest pain (see Supplement 5 in the Appendix). The other compared these performance measures after deleting one predictor variable (physician is concerned that chest pain is serious) (see Supplement 6 in the Appendix)).
We used R 2.13.2 (R Foundation for Statistical Computing, Vienna, Austria) using Mice [17], randomForest [22], and pROC [23] packages.
3 Results
As candidate predictors, we considered 61 medical history and physical examination items that at least two studies had collected routinely (see Supplement 2). No two studies collected the exact same set of predictors. The predictors ‘sex’ and ‘age’ were the only ones that all studies obtained. Based on the random forest tree analysis and the study-specific logistic regression analyses, we entered 19 candidate variables in a logistic regression model that we fitted to each of the five imputed meta-data sets.
- Table 2 about here –
The clinical prediction rule: In this patient-level meta-analysis, eleven of the 19 candidate
predictors were statistically significant predictors of the final diagnosis (α≤0.05) (Table 2). The corresponding chest pain rule I discriminated well between patients with and without a CAD final diagnosis (area under the ROC curve, AUC, = 0.87) (table 3); the discrimination was only slightly lower (AUC=0.85) after eliminating the five statistically weakest predictors (chest pain rule II). The rule discriminated essentially equally well after we further simplified the calculation of the score by assigning a value of 1.0 or -1.0 to the six regression coefficients (chest pain rule III, AUC= 0.84).
– Table 3 about here –
The final chest pain rule III included six predictors: older age, physician initially suspected a serious condition (the very first impression or gut feeling), chest pain feels like “pressure”, chest pain is related to effort, history of CAD, and chest pain reproduced by chest wall palpation. With one exception, the presence of a predictor increased the likelihood of CAD; chest pain reproducible by chest wall palpation decreased the likelihood. Two of the five studies [2, 11] had collected data on all predictors included in the final chest pain rule III. Figure 2 shows the distribution of chest pain
scores in these two studies; the score values range from -1 to 5 points; most of the patients had scores of 1 or less. Using the same two studies, we calculated the diagnostic accuracy of this clinical prediction rule for a chest pain score threshold of 2 points (CAD considered unlikely if score < 2) (Table 4). We applied this rule to one of the two study settings (4) with a CAD prevalence of 13.2% using a prediction score cut-off of <2 (i.e., -1, 0, or +1). When the score was <2, the probability of CAD was 2.1% (95%CI: 1.1-3.9%); when the score was ≥2, it was 43.0% (95% CI: 35.8-50.4%). These post-test probabilities are equivalent to a negative predictive value of 97.9 and a positive predictive value of 43%, as shown in Table 4.
We performed three internal cross-validations, which all yielded a model with the same predictors and similar estimates of their discriminatory power (see Supplement 4; Supplement Tables 2, 3, and 4).
- Figure 2 about here - - Table 4 about here -
Sensitivity analyses: we divided the study population into those with acute chest pain and those
with non-acute chest pain and applied the simplified rule. Five of the six variables in the simplified rule had the same likelihood ratio in the two subgroups (see Supplement 5; Supplement Table 5). The variable ‘history of CAD’ was a weaker predictor in the acute chest pain subgroup. We applied the simplified rule (chest pain rule III) to the five imputed data sets from the two participating studies [2][11] that routinely collected data on all 6 variables in both subgroups. In both studies the simplified rule predicted a CAD reference diagnosis equally well in the two subgroups. When we applied the chest pain rule to the 5 imputed data sets of the study by Bösner et al. [11], the AUC ranged from 0.79 to 0.80 (patients with acute pain) and from 0.86 to 0.87 (patients with non-acute pain) (see Supplement 5, Supplement Table 6 and Figure 2); p values of DeLong's test for whether
the two ROC curves differed ranged from 0.08 to 0.12. In the study of Verdon et al. [2], the difference in the AUC of each subgroup was even smaller.
We were concerned that some clinical sites would be reluctant to use a prediction rule that used the predictor variable “physician initially suspected a serious condition,” which requires a highly subjective judgement. In a second sensitivity analysis, we deleted this variable from chest pain rule III and tested the resulting rule on the five imputed data sets derived from the Bösner et al. [11] and the Verdon et al. [2] respectively. Omitting the variable reduced the sensitivity of the rule, increased its specificity, and did not change its discrimination (AUC) (Supplement 6 in the Appendix).
4 Discussion
The present systematic review and meta-analysis is the first, to our knowledge, to pool the patient data from all completed studies of chest pain signs and symptoms in a primary care setting, which is where most patients with chest pain first seek care. Our individual patient meta-analysis enhances internal validity in several ways. First, the large number of patients improves statistical precision, especially for subgroup analyses, and reduces the likelihood of a Type II error in comparing subgroups of patients. Furthermore, the diverse primary care settings in different countries enhances external validity.
Second, we used a statistical modeling strategy that deals with several difficulties encountered in individual patient meta-analyses based on observational studies. These include heterogeneity across studies (different populations, different sets of routinely collected predictors) and within studies (missing observations). The logistic regression meta-analytic model assumes that the effects of predictors on the probability of CAD are the same in all 5 studies, even if a particular
predictor is not available in a particular study. In our modeling strategy, only studies with data on a particular predictor contribute to the estimation of that predictor’s effect, and consequently different studies contribute differently to the estimation of predictive effects. In this way, albeit under the reasonable assumption of a common effect for all predictors in the final clinical
prediction rule, the model optimizes the contribution of all studies. The use of different intercepts for each study adjusts for the heterogeneity between the 5 studies (because we had only 5 studies, we used fixed models). To deal with missing observations for a patient within a study, we used multiple imputation.
Our meta-analysis has several limitations. First, the exact meaning of history items used in the studies may vary due to semantic and cultural differences, adding statistical uncertainty to measures of discrimination. Second, unlike a study of a recursive partitioning algorithm for diagnosing myocardial infarction [24],we did not do a prospective external validation in a
consecutive series of patients from an independent clinical setting [25]. However, each prediction rules generated by our cross-validation identified the same predictors and each had sensitivity, specificity and likelihood ratios similar to the original prediction rule, suggesting that over-fitting to our study data sets is less likely. Our limited approach to validation is another limitation. We did not do an internal validation study of the clinical diagnosis of CAD using an objective diagnostic reference standard on a randomly selected subset of patients from the pooled study populations. Such a study would be subject to concerns that the results of applying an objective diagnostic reference standard to patients referred for it would not be the same as the source population (test-referral bias). Our cross-validation study provides an internal validity check that our model was not over-fitted to the data. We did not do a prospective external validation study in a consecutive series of patients from an independent clinical setting, as is considered best practice. Ideally, an
external validation study should be entirely independent of the original study: new patients, different clinical settings, and different clinicians [25, 26]. We suggest that an individual patient meta-analysis based on data pooled from studies done at different times, with different patients and clinicians, and using different diagnostic reference standards provides partial assurance of external validity.
The choice of a diagnostic reference standard in studies of chest pain in primary care poses a special dilemma. We used a clinical diagnostic reference standard based on follow-up data rather than a uniform objective measure, such as coronary arteriography. This is a limitation because some diagnostic misclassification probably occurred and because clinical findings obtained at the index visit may have influenced the final diagnosis, which could lead to biased estimates of the likelihood ratios of clinical findings. Using coronary angiography as the diagnostic reference standard is not feasible in primary care settings. The alternative, using receipt of coronary angiography as a study inclusion criterion, would result in referral bias and possibly a serious systematic error when applying the results to a primary care population [27]. Despite these observations, a clinical diagnosis after follow-up may be a good diagnostic reference standard for primary care, since the clinician is initially uncertain of the diagnosis and hopes to choose the best interventions for the eventual diagnosis as established by testing, response to empirical treatment, and the passage of time.
Comparison of our prediction rule and previous work is difficult because we studied patients in primary care, whereas prior studies studied them in emergency department and subspecialty clinics. In one large study validating a prediction rule for assessing chest pain in the ED, the target was myocardial infarction, and ECGs were performed routinely [24]. Because that study used a
recursive partitioning algorithm, it is possible to evaluate the role of the ECG findings in identifying patients with myocardial infarction. Four of the 13 nodes in the algorithm used ECG results, and these nodes identified 628 of the 835 patients with myocardial infarction. Only 3 nodes used findings that were included in our prediction rule, and all of them were distal to a high yield ECG-based node, which made it impossible to compare the accuracy of these findings in our study (in which ECGs were done sporadically) and theirs.
A 2012 individual patient meta-analysis of 18 data sets developed a CAD prediction rule in
hospitalized patients who were referred to CT angiography, catheter angiography or both [28]. The findings of angiography were used to establish the reference diagnosis. We could not use the results of this study as a validity check on our results because the authors classified the
participants’ chest pain as non-specific, atypical angina, and typical angina and used these global syndromes as candidate predictors of the results of angiography. We, on the other hand, used the individual characteristics of chest pain (e.g. substernal, brought on by exertion, reproduced by palpating the chest wall) as candidate predictors.
A critical concern for any clinical prediction rule is linking the clinical score to an action, such as referral from primary care to an emergency department. A clinical score above a threshold would lead to further evaluation or treatment for CAD, whereas a score below the threshold would lead to watchful waiting or pursuing other diagnoses. In decision theory, the choice of threshold depends on the prevalence of CAD and the ratio of harms to benefits of the actions to be taken.[29] Given the small harms of treating CAD in patients who do not have CAD and the large benefit of treating CAD in patients who do have CAD, one should prefer a threshold clinical score that provides high sensitivity. A high sensitivity threshold would mean a very low probability of CAD if the clinical score
is below the action threshold. Using the simplified chest pain rule 3, a score value below 2 points resulted in a sensitivity of 88 % and 82%, respectively in the two study sites that were suitable for calculating sensitivity and specificity because they had obtained all of the chest pain rule predictors [2, 11]. While that sensitivity might seem too low for the clinician to rely solely on this prediction rule, especially in acute situations, the prevalence of a CAD diagnosis is low in office-based primary care, as shown in these two studies (13.2% and 14.5%) [2, 11]. Therefore, the negative predictive values (the probability that a patient with a chest pain score < 2 does not have a CAD diagnosis) in these two settings is very high (97.9% and 96.0%, respectively). Given the low probability of a CAD diagnosis with a score <2, clinicians may consider the rule to be suitable for initial triage in a
primary care setting, especially if the prevalence of CAD diagnoses was very low (e.g., 7.4% as in the Sox et al. study [4]).
In the past 25 years, five studies have focused on the diagnosis of coronary artery disease in patients with chest pain in the primary care setting, a small number given the importance of the problem. We undertook a systematic review of this experience. By pooling the data from the 5 studies, we hoped to create a prediction rule that was more trustworthy than the clinical prediction rules of the 5 individual studies. Beyond the specifics of the clinical problem, our study suggests a more general model for diagnostic research: the sharing of clinical data to improve the care of the patient [30]. In the coming era of large data sets derived from diverse clinical settings, researchers are eager to pool data and develop clinical prediction rules with high external validity. Our
experience with 5 independently derived, heterogeneous data sets, and that described in a recent publication [28], provide reason to hope that individual patient-level meta-analysis can produce promising clinical tools from studies that were performed independently with little or no attention to standardizing data definitions, clinical data sets, and uniform diagnosis protocols.
Authors’ contributions: MA and GM performed the statistical analyses and wrote a first draft of
manuscript. All other authors commented on this draft and contributed to, and improved the final manuscript. All authors contributed to the study design and analyses. NDB is the principal
investigator of the study described in this article. JH coordinated the study.
Conflict of Interest Statement: The authors declare that they have no competing interests.
Disclaimer: Dr. Sox is an employee of the Patient-Centered Outcomes Research Institute (PCORI). This study does not describe any policies of PCORI.
Acknowledgments: Tobias Biroga and Christian Keunecke (University of Marburg, Department of
General Practice/ Family Medicine, Germany) contributed to the literature search.
Funding: This study was funded by Federal Ministry of Education and Research, Germany (BMBF -
grant no. FKZ 01GK0920). The funding source had no involvement in the study.
Prior presentations: German College of General Practitioners and Family Physicians, 46th Annual Meeting, Rostock, 2013
5 Literature Cited
1. Svavarsdottir AE, Jonasson MR, Gudmundsson GH, Fjeldsted K. Chest pain in family practice. Diagnosis and long-term outcome in a community setting. Can.Fam.Physician 1996; 42:1122–8.
2. Verdon F, Herzig L, Burnand B, Bischoff T, Pecoud A, Junod M et al. Chest pain in daily practice: occurrence, causes and management. Swiss Med Wkly 2008; 138(23-24):340–7. 3. Bösner S, Becker A, Haasenritter J, Abu Hani M, Keller H, Sönnichsen AC et al. Chest pain in primary care: epidemiology and pre-work-up probabilities. Eur J Gen Pract 2009; 15(3):141–6.
4. Sox, H. C., Jr., Hickam DH, Marton KI, Moses L, Skeff KM, Sox CH et al. Using the patient's history to estimate the probability of coronary artery disease: a comparison of primary care and referral practices. American Journal of Medicine 1990; 89(1):7–14. 5. Haasenritter J, Aerts M, Bosner S, Buntinx F, Burnand B, Herzig L et al. Coronary heart disease in primary care: accuracy of medical history and physical findings in patients with chest pain - a study protocol for a systematic review with individual patient data. BMC family practice 2012; 13(1):81.
6. Rosser W, Henderson R, Wood M, Green L. An exploratory report of chest pain in primary care. A report from ASPN. J.Am.Board Fam.Pract. 1990; 3(3):143–50.
7. Klinkman MS, Stevens D, Gorenflo DW. Episodes of care for chest pain: a preliminary report from MIRNET. Michigan Research Network. J.Fam.Pract. 1994; 38(4):345–52.
8. Haasenritter J, Bösner S, Vaucher P, Herzig L, Heinzel-Gutenbrunner M, Baum E et al. Ruling out coronary heart disease in primary care: external validation of a clinical prediction rule. Br J Gen Pract 2012; 62(599):415–21.
9. Buntinx F, Truyen J, Embrechts P, Moreel G, Peeters R. Evaluating patients with chest pain using classification and regression trees. Fam Pract 1992; 9(2):149–53.
10. Nilsson S, Scheike M, Engblom D, Karlsson LG, Molstad S, Akerlind I et al. Chest pain and ischaemic heart disease in primary care. Br J Gen Pract 2003; 53(490):378–82.
11. Bösner S, Becker A, Abu Hani M, Keller H, Sönnichsen AC, Haasenritter J et al.
Accuracy of symptoms and signs for coronary heart disease assessed in primary care. Br J Gen Pract 2010; 60(575):246–57.
12. Knottnerus JA, Muris JW. Assessment of the accuracy of diagnostic tests: the cross-sectional study. In: Knottnerus JA, Buntinx F, editors. The evidence base of clinical
diagnosis. 2nd ed. Oxford, Hoboken NJ: Wiley-Blackwell Pub./BMJ Books; 2009. p. 42–63 . 13. Steyerberg EW, Harrell, F. E., Jr., Borsboom GJ, Eijkemans MJ, Vergouwe Y,
Habbema JD. Internal validation of predictive models: efficiency of some procedures for logistic regression analysis. J Clin Epidemiol 2001; 54(8):774–81.
14. DeLong ER, DeLong DM, Clarke-Pearson DL. Comparing the areas under two or more correlated receiver operating characteristic curves: a nonparametric approach. Biometrics 1988; 44(3):837–45.
15. Rubin DB. Multiple imputations in sample surveys – a phenomenological Bayesian approach to nonresponse. In: U.S. Department of Commerce, editor. Imputation and Editing of Faulty or Missing Survey Data. Washington, DC: U.S. Department of Commerce; 1978. p. 1–23 .
16. Rubin DB. Multiple Imputation for Nonresponse in Surveys. New York: John Wiley & Sons; 1987.
17. van Buuren S, Groothuis-Oudshoorn K. mice: Multivariate Imputation by Chained Equations in R. Journal of Statistical Software 2011; 45(3):1–67.
18. Schafer JL. Analysis of incomplete multivariate data. 1. ed., 1. CRC Press reprint. Boca Raton: Chapman & Hall/CRC; 2000. (Monographs on statistics and applied probability; vol 72).
19. Borenstein M, Hedges LV, Higgins, Julian P. T., Rothstein HR. A basic introduction to fixed-effect and random-effects models for meta-analysis. Research Synthesis Methods 2010 [cited 2013 Jul 31:29:43]; 1(2):97–111.
20. Breiman L. Random Forests. Machine Learning 2001; 45:5–32.
21. Hastie T, Tibshirani R, Friedman J. The elements of statistical learning: Data mining, inference, and prediction. 2. ed., (corr. at 5. print.). New York, NY: Springer; 2011. (Springer series in statistics).
22. Liaw A, Wiener M. Classification and Regression by randomForest. R News 2002; 2(3):18–22.
23. Robin X, Turck N, Hainard A, Tiberti N, Lisacek F, Sanchez JC et al. pROC: an open-source package for R and S+ to analyze and compare ROC curves. BMC Bioinformatics 2011; 12:77.
24. Goldman L, Cook EF, Brand DA, Lee TH, Rouan GW, Weisberg MC et al. A computer protocol to predict myocardial infarction in emergency department patients with chest pain. N Engl J Med 1988; 318(13):797–803.
25. Wasson JH, Sox HC, Neff RK, Goldman L. Clinical prediction rules. Applications and methodological standards. N Engl J Med 1985; 313(13):793–9.
26. Laupacis A, Sekar N, Stiell IG. Clinical prediction rules. A review and suggested modifications of methodological standards. JAMA 1997; 277(6):488–94.
27. Knottnerus JA, Leffers P. The influence of referral patterns on the characteristics of diagnostic tests. J Clin Epidemiol 1992; 45(10):1143–54.
28. Genders TS, Steyerberg EW, Hunink MG, Nieman K, Galema TW, Mollet NR et al. Prediction model to estimate presence of coronary artery disease: retrospective pooled analysis of existing cohorts. BMJ 2012; 344:e3485.
29. Sox, Harold C., Jr., Higgins MC, Owens DK. Medical Decision Making. 2nd ed. Oxford: Wiley-Blackwell; 2013.
30. Peng RD, Dominici F, Zeger SL. Reproducible epidemiologic research. Am J Epidemiol 2006; 163(9):783–9.
Figure 1: Schematic depiction of methods: This figure shows two studies (Study 1 and
Study 2) to represent the process for all five studies. Imputation of within- study data missing at random generates five imputed data sets for each study, each containing all patients in the study but differing because of the randomly imputed values for the missing data. Five imputed meta-data sets are constructed by pooling one of the five imputed data sets from each study (shown here as pooling the first imputed datasets across all five studies, next pooling the second ones, and so on). The predictors were selected as follows. For each imputed data set and for each study: first, the random forest method identified candidate predictors; next, a logistic regression model using these candidate predictors was fitted. All statistically significant predictors (at level ≤0.05) in the logistic regression models from at least one of the imputed datasets across all studies were included as candidate predictors for the analysis of the meta-data. Logistic regression models using these candidate predictors were fitted to each imputed meta-data set. Note that only studies providing data on a particular predictor contribute to the estimation of the effect of that predictor. To account for these study differences as well as for varying pretest probabilities of CAD across the individual studies, study-specific intercepts were used for the logistic regression meta-models. Coefficients and their standard errors from the fits on each imputed meta-data set are combined using the methods of Rubin et al. [15, 16]. All
predictors that were statistically significant (at level ≤0.05) in the combined analysis were used in the chest pain rule I. Further stepwise exclusion until only six predictor remained resulted in a simpler chest pain rule.
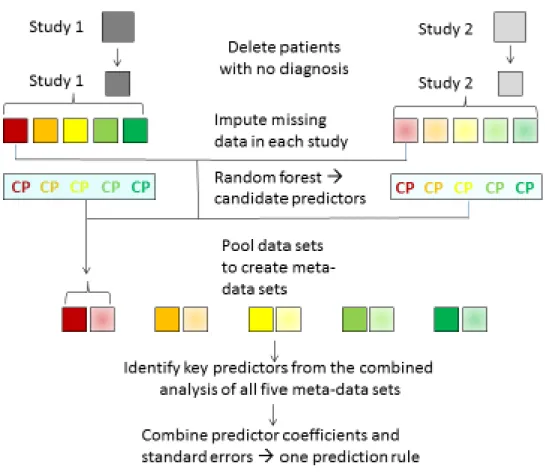
Figure 2 presents counts of patients with each rule score separately for patients with and
without CAD using data of the third imputed data set of the Bösner 2010[11] and Verdon 2008[2] study, respectively. These studies were the only ones that collected data on all six of the parameters appearing in the final rule (chest pain rule III).
Note: In Verdon 2008 [2] the predictor “history of CAD” was not asked in a direct way, but study physicians were asked to report up to 3 main diagnoses. Therefore, the information on the predictor may be less reliable in this sample.
Bösner 2010 (n=1238) Verdon 2008 (n=644) 0 100 200 300 400 -1 0 1 2 3 4 5 -1 0 1 2 3 4 5 Rule score C ount no CAD CAD
Table 1: Characteristics of studies and patients included in analysis.
Sox 1990 [4] Buntinx 1992 [9] Nilsson 2003 [10]
Verdon 2008 [2] Bösner 2010 [11]
Country USA Belgium Sweden Switzerland Germany
Setting 1 Drop-in clinic with multiple PCPs 25 PCPs 3 Health care centres each served by 4 PCPs 58 PCPs in private practice 74 PCPs in private practice N* 395 299 523 644 1238 Age (mean, sd) 41.5 (14.2) 47.1(17.3) 54.2 (14.4) 55.4 (19.0) 59.4 (13.9) Female sex (%) 52.8 48.5 50.3 52.3 56.2 Reference standard Delayed-type reference standard Delayed-type reference standard Delayed-type reference standard Delayed-type reference standard Delayed-type reference standard Duration of follow-up
At least 1 year 2 weeks to 2 months
3 months 12 months 6 months Reference diagnosis established by 2 internist-investigators independently assigned diagnosis. Treating physicians Treating physicians Treating physicians/ diagnoses were reviewed by a group of independent clinicians Independent expert panel (1GP, 1 cardiologist, 1 research fellow) Prevalence of CAD as cause of chest pain (%) 7.4% 10.4% 11.9% 13.2% 14.5%
* Number of patients aged ≥18y with valid reference diagnosis PCP: primary care physicians
25
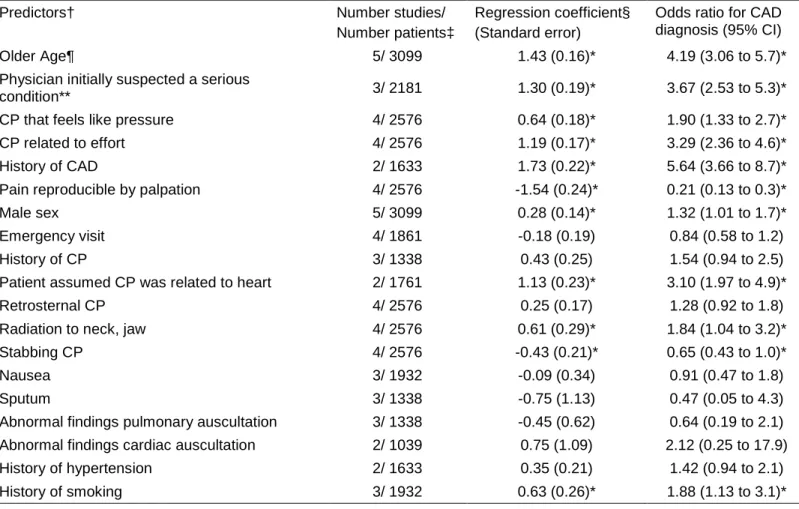
Table 2: Results of the multivariate meta-analysis.
Predictors† Number studies/
Number patients‡
Regression coefficient§ (Standard error)
Odds ratio for CAD diagnosis (95% CI)
Older Age¶ 5/ 3099 1.43 (0.16)* 4.19 (3.06 to 5.7)*
Physician initially suspected a serious
condition** 3/ 2181 1.30 (0.19)* 3.67 (2.53 to 5.3)*
CP that feels like pressure 4/ 2576 0.64 (0.18)* 1.90 (1.33 to 2.7)*
CP related to effort 4/ 2576 1.19 (0.17)* 3.29 (2.36 to 4.6)*
History of CAD 2/ 1633 1.73 (0.22)* 5.64 (3.66 to 8.7)*
Pain reproducible by palpation 4/ 2576 -1.54 (0.24)* 0.21 (0.13 to 0.3)*
Male sex 5/ 3099 0.28 (0.14)* 1.32 (1.01 to 1.7)*
Emergency visit 4/ 1861 -0.18 (0.19) 0.84 (0.58 to 1.2)
History of CP 3/ 1338 0.43 (0.25) 1.54 (0.94 to 2.5)
Patient assumed CP was related to heart 2/ 1761 1.13 (0.23)* 3.10 (1.97 to 4.9)*
Retrosternal CP 4/ 2576 0.25 (0.17) 1.28 (0.92 to 1.8)
Radiation to neck, jaw 4/ 2576 0.61 (0.29)* 1.84 (1.04 to 3.2)*
Stabbing CP 4/ 2576 -0.43 (0.21)* 0.65 (0.43 to 1.0)*
Nausea 3/ 1932 -0.09 (0.34) 0.91 (0.47 to 1.8)
Sputum 3/ 1338 -0.75 (1.13) 0.47 (0.05 to 4.3)
Abnormal findings pulmonary auscultation 3/ 1338 -0.45 (0.62) 0.64 (0.19 to 2.1) Abnormal findings cardiac auscultation 2/ 1039 0.75 (1.09) 2.12 (0.25 to 17.9)
History of hypertension 2/ 1633 0.35 (0.21) 1.42 (0.94 to 2.1)
History of smoking 3/ 1932 0.63 (0.26)* 1.88 (1.13 to 3.1)*
* p≤0.05
† Predictors listed in the predictor candidate list and entered in the model.
‡ Number of studies refers to the number that routinely collected the item. Number of patients refers to number of patients who gave a response to the item.
§ The data are the result of regression analyses of five meta-data sets, each containing all patients in the five studies but differing in the values imputed to missing data in a study. Estimates of regression coefficients and standard errors gained from the five imputed datasets were combined according to the rules proposed by Rubin [16].
¶ Age is included in the model as a binary variable with gender-specific thresholds (male: ≥ 55 y, female ≥ 65 y). CP: chest pain, CAD Coronary Artery Disease
** This assessment was based on a very first impression or gut feeling.
Regression coefficients below ‘0’ and odds ratios below 1 indicate that the presence of the symptom or sign decreases the likelihood of CAD. Regression coefficients above ‘0’ and odds ratios above 1 indicate that the presence of the symptom or sign increases the likelihood of CAD.
26
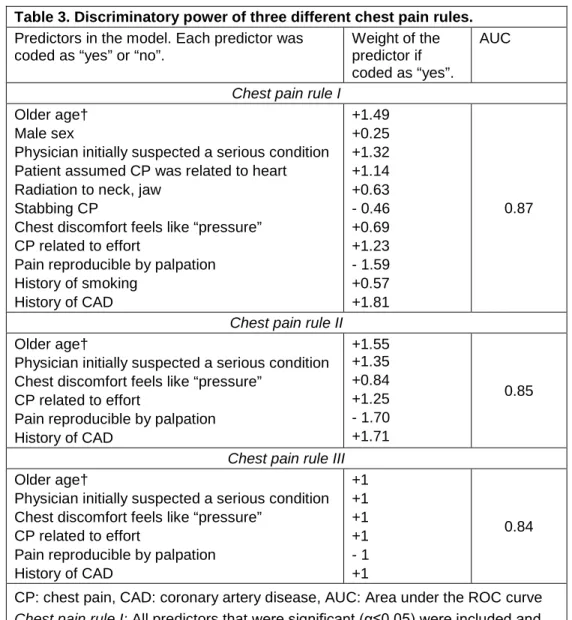
Table 3. Discriminatory power of three different chest pain rules.
Predictors in the model. Each predictor was coded as “yes” or “no”.
Weight of the predictor if coded as “yes”.
AUC
Chest pain rule I
Older age† Male sex
Physician initially suspected a serious condition Patient assumed CP was related to heart Radiation to neck, jaw
Stabbing CP
Chest discomfort feels like “pressure” CP related to effort
Pain reproducible by palpation History of smoking History of CAD +1.49 +0.25 +1.32 +1.14 +0.63 - 0.46 +0.69 +1.23 - 1.59 +0.57 +1.81 0.87
Chest pain rule II
Older age†
Physician initially suspected a serious condition Chest discomfort feels like “pressure”
CP related to effort
Pain reproducible by palpation History of CAD +1.55 +1.35 +0.84 +1.25 - 1.70 +1.71 0.85
Chest pain rule III
Older age†
Physician initially suspected a serious condition Chest discomfort feels like “pressure”
CP related to effort
Pain reproducible by palpation History of CAD +1 +1 +1 +1 - 1 +1 0.84
CP: chest pain, CAD: coronary artery disease, AUC: Area under the ROC curve
Chest pain rule I: All predictors that were significant (α≤0.05) were included and
weighted according to the regression coefficients.
Chest pain rule II: Rule I was simplified by excluding the least significant predictor
stepwise until only six highly significant predictors (p<0.01) were included in the model.
Chest pain rule III: Rule II was simplified by rounding the regression coefficients
estimates.to unity.
* Weights above ‘1’ indicate that the presence of the symptom or sign increases the likelihood of CAD. Weights values below 1 indicate that the presence of the symptom or sign decreases the likelihood of CAD.
27
Table 4: Diagnostic accuracy of chest pain rule III in the two studies that routinely collected all of the predictors using a threshold of 2 points (CAD negative if score < 2; CAD positive if score ≥ 2).
Sample Sensitivity % (95% CI) Specificity % (95% CI) + LR (95% CI) -LR (95% CI) PPV % (95% CI) NPV % (95% CI) Bösner 2010[11] 82.0 (75.1-87.3) 73.8 (70.9-76.4) 3.13 (2.74-3.57) 0.24 (0.17-0.34) 34.7 (30.2-39.5) 96.0 (94.3-97.2) Verdon 2008[2] 88.2 (79.5-93.6) 82.2 (78.7-85.2) 4.95 (4.08-6.02) 0.14 (0.08-0.26) 43,0 (35.8-50.4) 97.9 (96.1-98.9) Predictors and respective score values included in chest pain rule III:
age, physician initially suspected a serious condition, chest discomfort feels like “pressure,” chest pain related to effort, pain reproducible by chest wall palpation, history of CAD; variables were weighted as ‘1’ if regression coefficient > 0 and as ‘-1’ if coefficient < 0.
+LR: positive likelihood ratio; -LR: negative likelihood ratio (the likelihood ratio is the amount that the odds of CAD change if the score is above (LR-positive) or below (LR-negative) the threshold chest pain score); PPV: positive predictive value; NPV: negative predictive value.
Note: In Verdon 2008[2] the predictor “history of CAD” was not asked in a direct way, but study physicians were asked to report up to 3 main diagnoses. Therefore, the information on this predictor may be less reliable in this sample.
![Figure 2 presents counts of patients with each rule score separately for patients with and without CAD using data of the third imputed data set of the Bösner 2010[11] and Verdon 2008[2] study, respectively](https://thumb-eu.123doks.com/thumbv2/5dokorg/4622595.119314/24.892.99.626.167.510/presents-patients-separately-patients-imputed-bösner-verdon-respectively.webp)