GRAPH-BASED VISUALIZATION OF
ONTOLOGY-BASED COMPETENCE
PROFILES FOR RESEARCH
COLLABORATION
Mansoor Afzal
MASTER THESIS 2012
GRAPH-BASED VISUALIZATION OF
ONTOLOGY-BASED COMPETENCE
PROFILES FOR RESEARCH
COLLABORATION
Mansoor Afzal
Detta examensarbete är utfört vid Tekniska Högskolan i Jönköping inom ämnesområdet informatik. Arbetet är ett led i masterutbildningen med inriktning informationsteknik och management. Författaren svarar själva för framförda åsikter, slutsatser och resultat.
Handledare: Vladimir Trasov Examinator: Ulf Seigerroth Omfattning: 30 hp (D-nivå) Datum: November 16, 2012 Arkiveringsnummer:
Abstract
Information visualization can be valuable in a wide range of applications, it deals with abstract, non-spatial data and with the representation of data elements in a meaningful form irrespective of the size of the data, because sometimes visualization itself focuses on the certain key aspects of the data in the representation and thus it helps by providing ease for the goal oriented interpretation. Information visualization focuses on providing a spontaneous and deeper level of the understanding of the data.
Research collaboration enhances sharing knowledge and also enhances an individual’s talent. New ideas are generated when knowledge is shared and transferred among each other. According to (He et al, 2009) Research
collaboration has been considered as a phenomenon of growing importance for the researchers, also it should be encouraged and is considered to be a ―good thing‖ among the researchers.
The main purpose of this thesis work is to prepare a model for the competence profile visualization purpose. For this purpose the study of different
visualization techniques that exist in the field of information visualization are discussed in this thesis work. The study and discussion about the visualization techniques motivates in selecting appropriate visualization techniques for the visualization of Ontology-based competence profiles for research collaboration purpose. A proof of concept is developed which shows how these visualization techniques are applied to visualize several components of competence profile.
Sammanfattning
Information visualisering kan vara värdefulla i ett brett spektrum av tillämpningar, handlar det om abstrakta, icke-geografiska data och med beteckningar för dataelement i en meningsfull form oavsett storleken på de data, för ibland visualisering själv fokuserar på vissa centrala aspekter data i representationen och därmed hjälper genom att ge enkel för målinriktad tolkning. Information visualisering fokuserar på att ge en spontan och djupare förståelse av uppgifterna.
Forskningssamarbetet ökar dela kunskap och också förbättrar individens talang. Nya idéer genereras när kunskap delas och överförs mellan varandra. Enligt (Han et al, 2009) har Forskningssamarbete betraktats som ett fenomen av växande betydelse för forskare, också bör uppmuntras och anses vara en "bra sak" bland forskarna.
Det huvudsakliga syftet med detta examensarbete är att förbereda en modell för kompetensprofil visualisering ändamål. För detta ändamål studiet av olika visualiseringstekniker som finns inom området informationsvisualisering diskuteras i detta examensarbete. Studien och diskussion om
visualiseringstekniker motiverar att välja lämpliga visualiseringstekniker för visualisering av ontologi-baserade kompetensprofiler för forskningssamarbete ändamål. Ett bevis på konceptet utvecklas som visar hur dessa
visualiseringstekniker används för att visualisera flera komponenter i kompetensprofil.
Acknowledgements
First of all I am very thankful to Almighty Allah who gave me the power of patience, consistency and courage to do this thesis work. I am really thankful to my family who supported and encouraged me. I am very much blessed by the prayers of my parents and family.
I am heartily thankful to my supervisor Dr. Vladimir Tarasov, whose valuable guidance and supervision throughout this thesis work encouraged me.
I am really thankful to the prayers, guidance and support of my dear friends in finishing this thesis work.
My heartily thanks to the interviewees, their time and discussion was very important for this thesis work.
I would like to dedicate this work to my brother Muhammad Usman Afzal and my nephew Muhammad Aayan Taimoor.
Key words
Ontology, Ontology visualization, Graph-Based visualization, Human computer interaction, Key concept extraction, Information visualization, Competence profile.
Contents
1
Introduction ... 1
1.1 BACKGROUND ... 1 1.2 PURPOSE/OBJECTIVES ... 2 1.3 LIMITATIONS ... 3 1.4 THESIS OUTLINE... 32
Theoretical Background ... 4
2.1 ONTOLOGY ... 4 2.2 COMPETENCE PROFILES ... 5 2.3 GRAPH ... 5 2.3.1 Directed Graph ... 6 2.3.2 Undirected Graph ... 7 2.4 VISUALIZATION ... 7 2.4.1 Information Visualization ... 82.5 VISUALIZATION TECHNIQUES CATEGORIZATION ... 9
2.6 NON GRAPH-BASED VISUALIZATION TECHNIQUES ... 13
2.6.1 Cluster Map ... 13
2.6.2 KNAVE ... 13
2.6.3 WebTheme ... 13
2.6.4 Matrix Browser ... 15
2.7 GRAPH-BASED VISUALIZATION ... 17
2.8 GRAPH-BASED VISUALIZATION LAYOUTS TECHNIQUES ... 18
2.8.1 Classical Tree Layout ... 18
2.8.2 H-tree layout ... 18
2.8.3 Balloon view ... 19
2.8.4 Radial view ... 20
2.8.5 Tree-map ... 21
2.9 VISUALIZATION ISSUES ... 21
2.9.1 Ontology Visualization Issues ... 21
2.9.2 Graph-based Visualization Issues ... 22
2.10 KEY CONCEPT EXTRACTION (KCE) ... 23
2.11 HUMAN COMPUTER INTERACTION (HCI) ... 24
2.11.1 HCI Factors ... 25
2.12 RELATED WORK ... 26
2.12.1 Harvard Catalyst Profile ... 26
3
Research Methods ... 27
3.1 RESEARCH DESIGN AND STRATEGY ... 27
3.2 RESEARCH METHODS IN IS ... 28
3.2.1 Behavioral Science ... 28
3.2.2 Design Science Research ... 29
3.3 RESEARCH APPROACH ... 32
3.4 QUANTITATIVE AND QUALITATIVE DATA ... 33
3.5 DATA COLLECTION TECHNIQUES ... 34
3.5.1 Secondary Data Collection ... 34
3.5.2 Primary Data Collection ... 35
3.6 DESIGN OPTIONS AND DECISIONS ... 36
4
Empirical Findings and Analysis ... 38
4.1 PRIMARY DATA RESULTS ... 38
4.2 ANALYSIS OF PRIMARY DATA ... 44
4.2.1 Visualization Need ... 45
4.3 SECONDARY DATA RESULTS ... 45
4.3.1 Literature review (Results) ... 45
4.3.2 Prototype Feedback ... 46
4.4 ANALYSIS OF SECONDARY DATA ... 47
4.5 WHY GRAPH-BASED VISUALIZATION ... 47
4.6 COMPETENCE PROFILE STRUCTURE ... 49
4.7 METHOD FOR COMPETENCE PROFILE VISUALIZATION ... 53
4.8 LAYERED MODEL... 55
5
Implementation ... 57
5.1 CLICKPROJECT ... 57
5.2 IMPLEMENTATION LAYERS ... 57
5.2.1 Hierarchal Information ... 57
5.2.2 Application programmable Interface ... 58
5.2.3 Information Extraction ... 58
5.2.4 Data mapping ... 60
5.2.5 Graph-Based Visualization ... 60
5.2.6 User Interaction ... 60
6
Evaluation ... 65
7
Conclusion and Discussion ... 67
8
References ... 69
9
Appendix ... 72
List of Figures
FIGURE 2-1: A SIMPLE GRAPH ... 6
FIGURE 2-2: A SIMPLE DIRECTED GRAPH ... 6
FIGURE 2-3: A SIMPLE UNDIRECTED GRAPH ... 7
FIGURE 2-4: VISUALIZATION OF ONTOLOGY ... 9
FIGURE 2-5: THEME VIEW VISUALIZATION OF WEBTHEME ... 14
FIGURE 2-6: GALAXY VISUALIZATION OF WEBTHEME ... 15
FIGURE 2-7: MATRIXBROWSER APPROACH ... 16
FIGURE 2-8: A SIMPLE NODE-LINK TREE VISUALIZATION ... 17
FIGURE 2-9: CLASSICAL TREE LAYOUT ... 18
FIGURE 2-10: H-TREE LAYOUT ... 19
FIGURE 2-11: BALLOON VIEW OF A SIMPLE TREE ... 19
FIGURE 2-12: BALLOON VIEW OF A COMPLEX TREE ... 20
FIGURE 2-13: RADIAL VIEW LAYOUT ... 20
FIGURE 2-14: TREE MAP LAYOUT ... 21
FIGURE 2-15: TREE VIEW LAYOUT ... 22
FIGURE 2-16: VISUALIZATION PROCESS ... 24
FIGURE 3-2: RESEARCH APPROACH ... 32
FIGURE 4-1: STRUCTURE OF A RESEARCHER’S COMPETENCE PROFILE ... 52
FIGURE 4-2: NAVIGATION PATH ... 53
FIGURE 4-3: FROM ONTOLOGY TO VISUALIZATION ... 53
FIGURE 4-4: METHOD FOR ONTOLOGY-BASED COMPETENCE PROFILE VISUALIZATION ... 54
FIGURE 4-5: LAYERED MODEL ... 55
FIGURE 5-1: INPUT ONTOLOGY TO THE KCE ... 58
FIGURE 5-2: OUTPUT FROM THE KCE ... 59
FIGURE 5-3: KCE SCORING ... 59
FIGURE 5-4: HYPER TREE ... 61
FIGURE 5-5: BAR CHART ... 62
FIGURE 5-6: CONNECTED GRAPH ... 63
List of Tables
TABLE 2-1: INDENTED LIST ... 10
TABLE 2-2: NODE-LINK AND TREE ... 10
TABLE 2-3: ZOOMABLE ... 11
TABLE 2-4: SPACE FILLING ... 12
TABLE 2-5: FOCUS + CONTEXT OR DISTORTION ... 12
TABLE 3-1: INTERVIEWEES DETAILS ... 36
TABLE 4-1: INTERVIEW RESULTS FROM RESEARCHER 1 ... 38
TABLE 4-2: INTERVIEW RESULTS FROM RESEARCHER 2 ... 40
TABLE 4-3: INTERVIEW RESULTS FROM RESEARCHER 3 ... 41
TABLE 4-4: INTERVIEW RESULTS FROM RESEARCHER 4 ... 42
TABLE 4-5: INTERVIEW RESULTS FROM RESEARCHER 5 ... 43
TABLE 5-1: LAYOUT SELECTION WITH RESPECT TO INFORMATION TYPE ... 60
List of Abbreviations
API Application Programming Interface
CLICK Computer Supported Collaborative Work through Dynamic Social Networking between Researchers
DOPE Drug Ontology Project for Elsevier HCI Human Computer Interaction IS Information Systems
KNAVE Knowledge-based Navigation of Abstractions for Visualization and Explanation
SEWASIE Semantic Webs and Agents in Integrated Economies SWAP Semantic Web and Peer-to-Peer
1 Introduction
This chapter mainly focuses on the description of information visualization, research collaboration and competence profiles. In addition, this chapter provides an overview about the background history of the research area, research problem, objective and the limitations that exist, leading to a short thesis outline that describes how the remaining part of the report is organized.
1.1
Background
Information visualization is a large emerging field that deals with the abstract and non-spatial data. When it comes to large and complex data collection then information visualization becomes appealing and useful. Information
visualization deals with the representation of data elements in a meaningful form irrespective of the size of the data, because sometimes visualization itself focuses on the certain key aspects of the data in the representation and thus it helps by providing ease for the goal oriented interpretation. The main goal of the information visualization is to provide with a spontaneous and deeper level of the understanding of the data.
If the data to be visualized is unstructured then the main goal of information visualization is to highlight the relationship between the data elements through the means of visual representation, and for this purpose it provides various techniques that can represent the semi structured data. If the relationship between the data elements is known then data can be easily represented by the help of a graph where edges represent the relationships and nodes represents the data elements [1] [2].
Research collaboration is a form of collaboration between the researchers to share their knowledge and to enhance an individual talent. When researcher’s knowledge is shared and transferred among each other new ideas are generated. Research collaboration has been considered as a phenomenon of growing importance for the researchers; also it should be encouraged and is considered to be a ―good thing‖ among the researchers. Studies have shown that the co-authored or multiple co-authored research papers and articles are more cited than the articles and research papers that are single authored [3].
Competence profile represents the skills, abilities, measurable knowledge and other characteristics that are possessed by a person. So when we talk about the researcher competence profile, this means that the critical skills, abilities and the knowledge of the researcher that he possess in the field of research and one can evaluate the researcher on the basis of his competence profile [4].
1.2
Purpose/Objectives
Information visualization provides beneficial techniques for the better understanding of information to be presented. These techniques provide the viewer an interactive insight and clear understanding of data. For the purpose of research collaboration there are many researcher competence profiles
available over the web that one can look over them in order to collaborate with. In addition there also exist several research collaboration tools that mainly focuses on the textual information of the competence profiles for example, research collaboration platform provided by university of NewCastle, Australian National University, Alzheimer research forum etc. These tools mainly represent the information in the textual form only which is not enough for the human perceiving and research collaboration point of view. Therefore it is difficult for the researchers to perceive relevant information from such tools. To overcome this difficulty graph based visualization helps users to perceive relevant information. The idea behind this thesis work is to provide a graph based visualization of ontology-based competence profiles of researchers that are created based on data source integration. As there exists several tools that visualize ontologies using several visualization techniques but ontology based competence profile visualization is something that has not been done yet [1]. This research work mainly focuses on how ontology based competence profile is visualized for the purpose of research collaboration. The main objective of this thesis work is to present a model that can be used to provide visualization for ontology-based competence profile of researchers for the purpose of research collaboration. This visualization model can be used to display interactive graphical representation of the competence profiles. According to [25]
“Effective and interactive representation of information is equally important as rich descriptions of specific data elements”
This leads to the investigation of general components that are needed for a researcher’s competence profile and how these general components can be visualized so that a researcher profile is sensibly perceivable. This investigation leads to the following research questions.
Which components are needed to be visualized in a competence profile? The main idea is to interrogate about the components that are needed for the visualization of researcher’s competence profiles so that the competence profile is easily perceivable for the purpose of research collaboration. In other words to identify those basic components that are the part of a
competence profile and based on these components a researcher profile can be perceivable easily.
Which are the suitable visualization techniques for visualizing ontology-based competence profiles?
The investigation of suitable visualization techniques for the visualization of different components of a researcher’s competence profile by considering the issues related to the navigation and visualization.
1.3
Limitations
This research work mainly focuses on the graph-based visualization of ontology-based researcher’s competence profile. It is not the focus of this research that how this information related to researcher’s competence is
prepared or gathered. Since the aim of this research is interactive visualization of competence profiles for the purpose of research collaboration, thus it is assumed or supposed that the competence profiles are created and exist in ontology.
1.4
Thesis outline
This thesis work is divided in the following manner. Second part of this report is the ―Theoretical background” which consists of the theories related to the tasks that are going to be performed. This part highlights the technical theories related to the addressed objectives. This part starts with the explanation of Ontology, Information visualization, ontology visualization leading to different visualization techniques such as graph-based and non-graph-based visualization techniques. Some of the problems related to the visualization are also
mentioned in the theoretical background. Third part of this report is the
“Methods” which consist of the approaches that have been used to reach to the solution for the addressed objective. It also contains the decisions made for the selection of a particular algorithm using the literature study. In addition to this the complete process of the implementation is discussed by describing the steps taken in applying the selected visualization technique. In addition to this the developed modules for the proof of the concept are discussed too. Fourth part of this report is the “Empirical Findings and Discussion” which explains the initial results obtained from the research work. This part specifies the answers to the questions that are formalized in the introduction part. Next part is the “Conclusion” which discusses what is concluded from the obtained results.
2 Theoretical Background
This part starts with the brief description of ontology and competence profiles leading to the description of human computer interaction, graph, information visualization, ontology visualization. In addition to this non graph based and graph based visualization techniques are discussed and different layout techniques of graph based are highlighted. In the end issues related to the visualization are mentioned.
2.1
Ontology
According to [5],“Ontology is formal, explicit specification of a shared conceptualization. The term is borrowed from philosophy, where ontology is a systematic account of Existence. For knowledge-based systems, what “exists” is exactly that which can be represented.”
In above definition the term ―conceptualization‖ refers to the occurrence of an abstract model that is related to this world which identifies the relevant
concepts of that phenomenon. The term ―Explicit‖ refers to the fact that restrictions and the concepts on which the restrictions are applied must be defined explicitly. The term ―formal‖ refers to the fact that the ontology should be machine readable [14].
Another definition of ontology from mathematical point of view [19]:
“Ontology is a triple O = (C, S, isa)”
Where “C” is a set of classes, where each class denotes to a set of real world instances “S” is a set of slots, where each slot denotes a property of a class (Integer, String or Date) “isa” is a set of inheritance relationships.
“Ontology provides an explicit conceptualization (i.e., meta-information) that describes the semantics of data”.
The language that defines ontologies is semantically and syntactically richer than any other approach [14].
2.2
Competence Profiles
Competencies are those skills and the knowledge that leads to a superior performance. These competencies can be applied to a person, an organization or a team. Competencies refer to those characteristics that result in effective performance. Similarly competence profile represents the skills, abilities, measurable knowledge and other characteristics that are possessed by a person. So when we talk about the researcher competence profile, this means that the critical skills, abilities and the knowledge of the researcher that he possess in the field of research and one can evaluate the researcher on the basis of his competence profile. The competency assessment is done based on the
competence profiles. Researcher’s competence profile portrays knowledge and skills in the form of researcher’s contribution in the field of research. This can be in the form of publications, knowledge shared with other researchers, knowledge in research area(s) [4].
The main objective of competence profile is:
To represent the knowledge and skills of a researcher in the form of his / her research contribution.
To represent in a way so that assessment on these skills can be done easily by other researchers.
Competencies vary from individual to individual for example: For a research Assistant competency could be
“Technical skills, motivation, conduct research under the supervision of a principal investigator, ability to communicate.”
For an IT consultant it could be:
“analytical approach to work, excellent problem solving skills, interpersonal skills, communication skills, ability to absorb, complex technical information and pass this on clearly, stamina to meet deadlines, ability to work under pressure, project management skills, detailed technical knowledge, motivation.[4]”
2.3
Graph
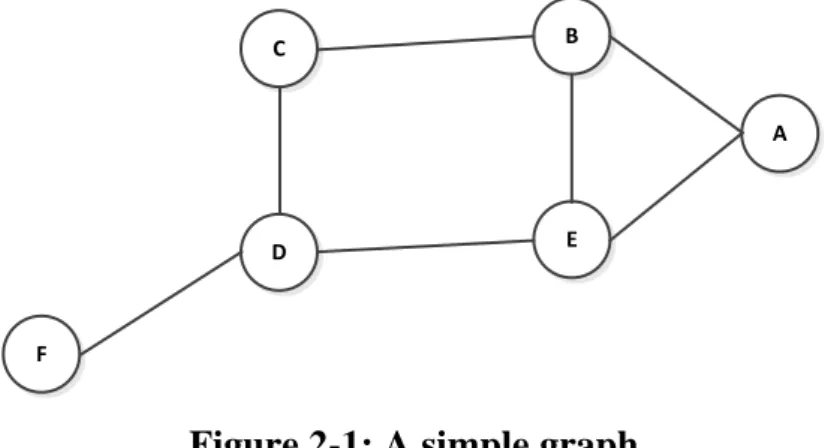
A graph is a collection of objects that are connected together in some way for the representation of a network where each object is a vertex (node). These nodes in the graph are connected with the links that are called as edges as described in the Figure 2-1 [9].
F
E D
C B
A
Figure 2-1: A simple graph
According to [9], mathematically a graph is defined as an ordered pair of G= (V, E) where
V denotes the collection of vertices (nodes)
E denotes the collection of links (edges)
Edge in a graph is an element of a pair of vertices.
2.3.1 Directed Graph
A directed graph is one in which there is distinction between the edges. In a directed graph links are drawn with arrowheads on the edges. A directed graph is represented as (A,B) this shows that the link is directed from A to B and this is different from the link (B,A) as shown in the Figure 2-2 [9].
C B
A
Figure 2-2: A simple directed graph
Vertices = {A, B, C}
2.3.2 Undirected Graph
An undirected (symmetric) graph is one which has no distinction between the two connected vertices with each link (edge). Considering an example where a vertex A is connected to vertex B, this can be represented as {A,B}, this shows that vertex A is connected to vertex B and it is the same thing as B connected to A {B,A} [9].
C B
A
Figure 2-3: A simple undirected graph Vertices = {A, B, C}
Edges = {(A, B), (B, C), (C, A)}
2.4
Visualization
According to [23]―Good writing, good graphical displays of data communicate ideas with
clarity, precision, and efficiency and poor writing, bad graphical displays distort or obscure the data, making it harder to understand or compare."
This shows that to provide a better and clear understanding of data, it must be provided with good graphical displays so that a human can perceive it
efficiently. This also indicates that when data is to be visualized in the form of graphical display, image, or a picture it must be made clear that the presented data is visible to imagination or mind not only visible or presented to sight. There exist various flavors of visualization, below are the examples of some visualization flavors.
Data Visualization
Information Visualization
Scientific Visualization
Software Visualization
For the purpose of this thesis work, Information visualization is going to be discussed below.
2.4.1 Information Visualization
Information visualization is a large emerging field that deals with the abstract and non-spatial data. When it comes to large and complex data collection then information visualization becomes appealing and useful. Information
visualization deals with the representation of data elements in a meaningful form irrespective of the size of the data, because sometimes visualization itself focuses on the certain key aspects of the data in the representation and thus it helps by providing ease for the goal oriented interpretation.
The main goal of the information visualization is to provide with a spontaneous and deeper level of the understanding of the data. [1] [2]
2.4.1.1 Ontology Visualization
According to [10], Ontology is considered to be an explicit specification of conceptualization. In the semantic web ontology plays a vital role in the field of knowledge description, knowledge sharing and other related issues. According to [11] to represent variety of domain knowledge and heterogeneous
information ontologies are used where ontologies range from simple
information to complex relations based knowledge. Ontology is a collection of classes, concepts, attributes and relationships between the classes. The
language that defines ontology is semantically better than any other approach [3]. In order to represent and understand the hierarchal structure of ontologies visualization must be provided. According to [12]
“Visualization is one of the indispensable means for addressing the rapid explosion of data and information.”
There is always a need for effective ontology visualization for browsing,
designing, understanding and navigating the ontologies. There exist many tools for visualization of ontologies which represents the ontology in a variety of visualizations techniques, also these tools helps in creating the ontologies of a domain. Topbraid, Protégé are considered to be one of the known tools for ontology creation and visualization. There are many other tools (ILOG Discovery, Prefuse, Spotfire) also available for ontology visualization that helps the user to understand the structure of an ontology containing the classes, concepts, hierarchy of concepts and the relationships between the classes. No matter the tools currently available are in use for creating and visualizing ontologies but still these tools provides the users with limited support for visualization of complex and large ontologies [13].
Figure 2-4: Visualization of Ontology [14]
Figure 2-4 shows the visualization of an ontology using a top-down approach where the concepts are connected with other concepts with each other based on the
hierarchal structure of the ontology.
2.5
Visualization Techniques Categorization
Ontology visualization can be done in a variety of ways, according to a survey performed by [15] on the categories of visualization techniques and then they categorized the characteristics of these techniques with respect to the set of requirements based on the ontology visualization. Some of the features of one of the techniques may also be present in other techniques. Every visualization technique has different features which lead to several advantages and
disadvantages. Below is the list of categorization of techniques for ontology visualization.
Indented list
Node–link and tree
Zoomable
Space-filling
Focus + context or distortion
In this survey [15] they explored these techniques in a way so that a user can choose one of them that are most suitable for user’s need. This is done by the deep analysis of these techniques and describing the functionalities of these techniques. In addition to this the survey also highlights the base of
visualization and discussed most of the tools that uses above mentioned techniques and in the end a comparison is provided on the basis of advantages and disadvantages of the techniques.
Below is described the advantages and disadvantages of these visualization techniques and the tools that uses these techniques are also mentioned in the table.
Table 2-1: Indented List Indented List Advantages Implementation simplicity
User Familiar
Clear view of the class hierarchy
No label overlap
Interface Simplicity
Quick browsing Disadvantages No graph view
No multiple inheritance
No visual representation of role relations
Needs much of scrolling in browsing
Nodes at same level are not recognized.
User Familiar
Clear view of the class hierarchy No label overlap Used By Tools Protégé OntoEdit Kaon OntoRama
Table 2-2: Node-Link and Tree Node–link and tree
Advantages intuitive way to represent hierarchy
a good overview of hierarchical structures is offered
hierarchy depth or width is easily distinguishable
expansion and retraction of sub hierarchies
Disadvantages leaves the root side of the tree completely empty
hundred nodes often need multiple screens to be completely displayed
cluttered displays in case of large data
Used By Tools 2Dimensional OntoViz IsaViz TreePlus SpaceTree OntoTrack GoSurfer GOBar GOMiner 3Dimensional Cone Tree
Reconfigurable Disk Tree
Tree Viewer
OntoSphere
Table 2-3: Zoomable Zoomable
Advantages Effective for locating specific nodes
Provides comprehensive view of the hierarchy level Disadvantages difference between the biggest and the smallest sub
hierarchies is large
Do not support the user in forming an overall image of the hierarchy Used By Tools 2Dimensional Grokker Jambalaya CropCircles 3Dimensional Information Cube Information Pyramids Gopher VR
Table 2-4: Space Filling Space-filling Advantages Disadvantages Used By Tools 2Dimensional TreeMaps SequoiaView Information Slices 3Dimensional BeamTrees
Table 2-5: Focus + context or distortion Focus + context or distortion Advantages Disadvantages Used By Tools 2Dimensional StarTree OntoRama MoireGraphs TGVizTab Bifocal Tree OZONE 3Dimensional 3D Hyperbolic Tree
2.6
Non Graph-Based Visualization Techniques
According to [1], there are some non-graph-based techniques that are rather unconventional in the case of visualization of ontologies.
Below is the list of these non-graph-based visualization techniques.
Cluster Map KNAVE WebTheme SEWASIE LexoVis Matrix Browser 2.6.1 Cluster Map
This visualization technique is suitable for simple ontologies, without having complex hierarchal structure. Ontology components such as objects that belong to same class are clustered together. This technique focuses on the information about the class instances. It focuses on the class instances and the relationship between these instances, so this technique is best suitable for the ontologies that has less number of relationships between the classes, because more the edges exist more the visualization will be messy. There are number of tools that are using these techniques. Below is the list of tools that are using this technique [1] Autofocus: Spectacle DOPE SWAP 2.6.2 KNAVE
KNAVE is a visualization technique that is domain-independent and it allows the user to discover the time-oriented data prepared in an ontology structure [1].
2.6.3 WebTheme
WebTheme is used for the visualization of HTML-based websites. This technique do not provide the visualization of ontologies but the reason behind discussing this technique here is that it uses an uncommon type of
visualization. It provides two different type of visualization that are named as ThemeView and Galaxy. In ThemeView visualization document space is
shown as a map, where taller peaks represent the leading ones. Figure 2-5 shows the view of the ThemeView technique.
Figure 2-5: Theme View Visualization of WebTheme [16]
Taller peaks can be seen and the height of the peak indicates the leading web pages.
Galaxy view visualization document space is shown as a galaxy where the individual web pages are indicated as stars in the galaxy. The distance between the stars (web-pages) shows the level of similarity among them. [16]
Figure 2-6: Galaxy Visualization of WebTheme [16]
In figure 2-6 Galaxy view can be seen and the stars are indicated as web-pages. The distance among the stars indicates the similarity level among the web-pages.
2.6.4 Matrix Browser
Matrix browser is a technique that visualizes and explores large structured information including structure of meta data and ontologies. The relationship between classes and concepts is displayed in a matrix form. The nodes are shown in the matrix in horizontal and vertical axes.
Figure 2-7: MatrixBrowser Approach
In the figure 2-7the classes are shown in a matrix form and marked cells represents that relationship exists between the nodes. [17]
2.7
Graph-Based Visualization
Graph-based visualization technique is the most simple visualization model that provides a spontaneous and interactive interface, in order to understand the structure of the data to be represented [7].
Figure 2-8: A Simple Node-Link Tree Visualization [15]
Figure 2-8 represents the simple visualization of an ontology that is created by the tool protégé TGVizTab. It shows the nodes and the link between different nodes. Graph-based visualization represents the information using a set of interconnected nodes and presents the knowledge (from ontology) with a left to right or from top to down structure. A user can easily navigate through the presented graph by expanding the nodes [15].
2.8
Graph-Based visualization layouts techniques
Below are presented different layout techniques in the graph-basedvisualization. These layout techniques are discussed and a brief overview is also presented.
2.8.1 Classical Tree Layout
In classical tree layout technique the child nodes are located under their common ancestor. In a tree layout technique nodes can be presented in a top-down way or can be presented in a left-right way.
Figure 2-9: Classical tree layout 2.8.2 H-tree layout
H-tree layout is also the illustration of the binary trees. They are generally constructed by beginning with a line and then by drawing to smaller pieces of lines at right angles to the endpoints and then it are continued in the same way. In other words this formation leads to a shape of a rectangle. Figure 2-10 demonstrates an H-tree layout.
Figure 2-10: H-Tree Layout 2.8.3 Balloon view
In a balloon view or a circular view layout the nodes are formed with the parent node in a circular form. Every parent node is located in the center of the circle and the child nodes are connected to the parent node in a way that they form a circle. Some of the circles are smaller in size where as some can be bigger depending upon the number of child nodes attached to the parent node.
Figure 2-12: Balloon view of a complex tree 2.8.4 Radial view
In a radial view layout the child nodes are placed according to the depth of the tree. The child nodes are connected to the parent node in way that they do not overlap each other as well as two adjacent segments also do not overlap each other. It is not necessary that they form a circle. Figure 2-13 demonstrates the radial view layout technique well.
2.8.5 Tree-map
In a tree map layout technique the rectangles with the same color denotes the same level of the hierarchal structure. So in this type of layout usually there is an order of different colored rectangles. If the tree map layout is used for
representing the file system then the size of the rectangle denotes the size of the different files. Figure 2-14 demonstrates a tree-map layout technique.
Figure 2-14: Tree Map layout
2.9
Visualization Issues
The issues related to visualization occur when data to be visualized is large and complex. In this section it is discussed that what are these issues and when these issues occur.
2.9.1 Ontology Visualization Issues
A major issue that occurs in ontology visualization is that how to visualize complex and large structural ontologies in compact and limited view area, so that user can easily view the data without switching between different views or without being distracted from the main view of the data. [1]. As there exists several methods and techniques that can be selected for the visualizing, representing ontologies but questions arises that among all the methods and techniques which one is better for visualization of ontologies? According to [15] As ontologies are not only a collection of concepts, classes and attributes, they may also be enriched with the relations between the classes and every class may have several attributes or up to hundreds or thousands of attributes. Therefore it is not easy to provide a visualization that can effectively and
visualization technique must be selected that provides the information from the ontology in an efficient way and easy to understand for the user.
2.9.2 Graph-based Visualization Issues
When visualizing complex and large data using the graph-based visualization technique, there exist a major issue that is the size of the graph which brings out the problem that how to incorporate the whole graph into a limited space. Since large data can compromise the performance of the viewing platform. Even if somehow the whole data is incorporated in a limited layout, even this can create issue of viewing and accessibility of the elements of the graph, because it will not be possible to differentiate between edges and the nodes of the graph. It is well recognized that comprehensive analysis of data in graph structures becomes easy when the size of the graph is small. Generally large graphs provide information about overall structure but on the other hand they become difficult to understand. [2]
A layout algorithm may bring out good visualization for fewer nodes but it is not guaranteed that it will be useful for large size data which has thousands of nodes. So a good layout algorithm will become useless if nodes to visualize are thousands. Figure 2-15 shows the tree view of fewer nodes.
Figure 2-15: Tree view layout
The tree view using a Reingold and Tilford algorithm with the fewer nodes the view has become so dense. As the view has become dense and there exist a lot of obstructions so it will be difficult for the user to interact with the graph. As we can easily see that there is not enough space remaining on the screen in the layout, so it is also illogical to display all the nodes on the one screen. There
must be a way for reducing the size of the data, and this is considered to be the first step in the visualization process.
By summarizing following are the key issues in graph-based visualization.
Non-Planarity
One of the critical issue that occurs in the most of the graph layout techniques is non- planarity. A graph is said to be planar if there are no two individual edges intersect at any point except the endpoints. In some of the layout
techniques graphs are made planar by making the edges to go around from the nodes so that the intersection of the edges can be avoid. Smaller graphs can be planar but for the larger and complex graphs planarity can be the issue.
Occlusions
Occlusion in the graphs sometimes makes it difficult to traverse the nodes. This is the case with the 2D graphs; this problem is somehow less in the 3D graphs. Due to less space present on the screen it is not possible to display the larger and complex data; even if it is visualized by any mean occlusion occurs. So when visualizing larger data in less space, the nodes of the graphs must be reduced by any mean so that to avoid occlusion.
Size of graph
Graph size is also one of the issue as the provided area for visualization is often smaller to it is difficult for the large and complex data to be visualized in
provided area. If complete data is to be visualized then this leads to increase in size of the graph and this requires more space on the screen.
2.10
Key Concept Extraction (KCE)
When ontology is large enough then it is very difficult to show the complete hierarchal structure of the ontology in the provided limited area. It is
considered to be beneficial to limit the number of nodes that are going to be visualized, by doing this it improves the clarity and also increases the layout performance. There exist several reduction techniques that have already been used to reduce the size of the data to reduce the graph complexity. Experts have provided a method in which simply those key terms or classes of ontology are emphasized or highlighted that best describes the ontology. In KCE algorithm there is a criterion by which a score is calculated from each of the class in the ontology and one of the aspects for this criterion is to consider those classes which are information rich, it means that those classes in the ontologies are considered which are having richly illustrated with properties and relationship
taxonomies. The concepts with high score will be considered as the key concepts.
In other words this method provides the brief view of complex structural ontologies. This method is known as Key Concept Extraction (KCE) [2].
2.11
Human Computer Interaction (HCI)
Human computer interaction has been used commonly since 1980s. Human computer interaction was known as man-machine interaction and this is
considered to be a particular interest in computers. When we talk about human computer interaction this refers to following terms a user, a computer and the interaction, where the term ―user‖ refers to a single user or a group of users working together in an organization and each of them dealing with some of the work or task to be done using the technology. The term ―computer‖ refers to any technology that ranges from a general desktop computer to a large scale computer system, a control system or an embedded system. The term
―interaction‖ refers to any sort of communication that takes place between a user and a computer. This interaction takes place in order to achieve something [8]. In modern technologies large and complex data is accessed in a variety of areas or domains. Due to the complexity of the data it becomes more
challenging to analyze and examine the data as well as to visualize such type of complex data.
According to [27]
“Visualization is a graphical representation of data or concepts, which is either an internal construct of the mind or an external artifact supporting decision making.”
This reflects that when representing information visually it helps the users to understand and easily perceive, but it is not enough to represent all the data in the form of a graph. As end-user is the essential part of interactive information visualization process, therefore human computer interaction factors must be considered in the visualization process.
2.11.1 HCI Factors
1) Creation of data for displaying purpose must be done using faster techniques.
2) To make the important information noticeable by the user, a compact version of information can be provided.
3) To make the selected element of data to be focused, make it appear sharp where others to be kept blurred.
4) In order to achieve full potential, ease of interaction must be provided to the user.
5) Information to be visualized must be either domain or task dependent. 6) Data to be displayed must be at maximum resolution and with minimum
distortion.
7) To provide multiple visualization of data for different tasks and requirements below mentioned points have to be consider [27].
a. “Changing between representations and views should be easy. b. Continuity should be maintained so the user does not get lost
when switching between representations. For example, use graceful transitions such as animation, maintain formatting consistency across views, and provide features that are easily discernible in all views and thus act as perceptual landmarks.”
8) Other related factors must be considered in information representation as an interactive visualization [27].
a. “The set of data elements (an overview). With volume or fluid flow data, the overview contains the entire object or space being visualized.
b. Relationships between data elements. Relationships may be either explicit or implicit.
c. Method of locomotion. In other words, cues should be present to help the user understand how to navigate through the display and modify display parameters.
d. Details at the current location. e. Details of the local neighborhood.
f. Navigation history. In other words, a list of previously explored display parameters, such as transfer functions in direct volume rendering.”
2.12
Related Work
2.12.1 Harvard Catalyst Profile
Harvard catalyst profile provides a web based tool which helps the researchers to search for the collaborators or mentors. Using this secure web-based
environment helps the researchers to collaborate and share their work. Harvard catalyst profile system contains several researchers’ profiles in different areas of research. Users can search these profiles in many ways e.g. search by key words, by name, by institution etc. By considering the Harvard catalyst profiles following components have been identified [25]:
Personal / Contact Information: This is the information about an identifiable individual that describes about the person, this information may include the title, institution, department, address, phone no, fax no, email etc.
Concepts: Concepts are those terms or keywords that are derived from the researcher’s publications. Concepts provide the general overview of the researcher’s research areas.
Co-Authors: List of the people in profiles who have published with this person. This shows the collaboration of a person with other authors.
Publications: Researcher’s written contribution in the field of research. List showing the publications published by the researcher.
Similar People: Suggested people who share similar concepts with this person.
Same Department: People who are also in the person’s primary department.
3 Research Methods
Research methods are the various steps or procedures that are followed by the researcher to bring out the solution during the research. It is considered to be the most important part of a research, as the results and success of the study is determined by these methods. So an appropriate method has to be followed to bring out the managed research. Below mentioned is the detail of the research method that is going to be followed to bring out the solution for how an
ontology-based researcher’s competence profiles be demonstrated based on the visualization techniques for the purpose of ―research collaboration‖.
3.1
Research Design and Strategy
According to [20] research design is basically an overall plan that is going to be followed to bring out the answers to the identified research problem. Research design provides a way that how to collect the data and to analyze it. Research design relates the research problem to the empirical research. Structure of the research problem varies and based on this variation of problem structure research method is classified in to three main categories, i.e. Exploratory research, descriptive research and causal research [20].
Exploratory Research: An exploratory research is considered to be appropriate when according to [20] the research problem is not properly
understood or in other words real scope of the problem is not clear. Exploratory research provides the researcher with the familiarization of the research
problem. This research depends upon the secondary data sources i.e. literature review or the qualitative data, so literature search is done or in some cases depending on the nature of search focus group is interviewed. This provides the research with better understanding about the problem. This type of research approach might provide the exact answer to the highlighted issues. Exploratory research results by providing important insight into a given problem. Causal or explanatory research [21] basically makes it clear that how a relationship between two variables exist.
Causal Research: Causal research must be undertaken when there is a cause effect relationship between the variables. It also helps in building and
elaboration of the theories. According to [21] cause and effect relationship can be explored by experimentation and simulations.
Descriptive Research: Descriptive research provides a systematic and detailed explanation of a problem. According to [21] this type of research usually
answers the questions starting with ―what‖, ―where‖, ―who‖. When the objective of the research is to provide a precise and realistic description then descriptive research is used. According to [18] descriptive research does not lay exactly under one methodology (qualitative or quantitative approaches) but descriptive research utilizes both of the approaches.
Exploratory research is used to understand and to get familiarize with the research problem that exist in the field of information visualization. By
understanding the problem it is come to notice that there is need for visualizing the competence profile in the form of a graph. The reason for selecting
exploratory research for understanding the problem is that it provides important insight into a problem area.
3.2
Research Methods in IS
In organizations the implementation of information system (IS) is done for enhancing effectiveness and efficiency of organization. To determine that which level the purpose is achieved potential of information system and characteristics of the organization are considered. In IS two paradigms are used, these paradigm are named as Behavioral science and design science [29]. 3.2.1 Behavioral Science
In behavioral science the focus is natural science research which helps in developing and justifying theories. These theories consider analyzing,
designing, implementing, managing and using of IS in an organization. It also helps in relating researchers with technology, organization and people in organization to successfully manage an IS in the organization. According to [29] behavioral science is
―An IT artifact, implemented in an organizational context, is often the object of study
in IS behavioral- science research. Theories seek to predict or explain phenomena that occur with respect to the artifacts use (intention to use), perceived usefulness, and impact on individuals and organizations (net benefits) depending on system, service, and information quality‖
The focus of behavioral science is to evaluate models that are related to management science literature. This type of research includes developing and managing the theories that clearly explain the organization need. Data
collection and empirical analysis is the main focus of several methods provided by behavioral science and this leads to the justification theories that already exist and to build new theories.
3.2.2 Design Science Research
In design science research the focus is creating and evaluating IT artifacts that tends to solve identified organization issues. These artifacts have to be in a structured form but may vary from formal login, software, mathematical to natural language.
According to [29] design science research is
“The design-science paradigm has its roots in engineering and the sciences of the artificial. It is fundamentally a problem solving paradigm. It seeks to create innovations that define the ideas, practices, technical capabilities, and
products through which the analysis, design, implementation, management, and use of information systems can be effectively and efficiently accomplished”
The first step in DSR is to understand the domain problem by gathering the knowledge related to the domain. IT artifact is built after analyzing the domain problem and this IT artifact is later evaluated. This evaluation helps in
providing better understanding of the problem and hence the design process and product quality can be enhanced. The IT artifact is built and evaluate iteratively so that a final artifact may be produced. DSR helps in addressing the unsolved problems in a way so that an artifact can be produced innovatively. After thoroughly analyzing the variance of research methods, DSR is selected after identifying research problem using exploratory research. The selection of DSR is made to fulfill the research focus that is to build a visualization tool for graph-based visualization of researcher’s competence profiles. This research work consists of several IS activities such as developing and evaluating an IT artifact which will provide a solution for the graph-based visualization.
According to [30] design science research methodology is based on three basic objectives. These objectives are
“To provide a nominal process for the conduct of DS research
To build upon prior literature about DS in IS and reference disciplines
To provide researchers with a mental model or template for a structure
Figure 3-1: DSRM Activities [30]
Figure 3-1 mentions the DSRM activities in order to design an artifact. In this thesis work these activities are followed. The explanation of these activities with respect to the research work is explained below.
Problem Identification and motivation
This activity mainly focuses on identifying the research problem. In this thesis work after understanding the problem through exploratory research in the field of information visualization, the problem was defined precisely. This gives better understanding of the problem and helps in finding the ways to discover the solution for the problems in an effective way. The description of problem is mentioned in section 1.1 and objective is mentioned in section 1.2.
Define the objectives of a solution
After defining the problem the need for solving the problem arises. To fulfill the need of problem solving described in section 1.2 existing knowledge of graph-based visualization, HCI and competence profile was used. This existing knowledge is described in section 2.
Design and development
The method followed by using above identified existing knowledge is described in section 4.4. On the basis of this method a model is designed for visualizing ontology-based competence profiles. This model explains the steps
needed to be followed to visualize the competence profiles in the form of a graph. Based on the model various technologies are selected and using these technologies a proof of concept is developed.
Demonstration
This proof of concept demonstrates how several techniques of graph-based visualization are used for visualizing different components of a competence profile. It can be seen that different visualizations can be selected depending on the information to be visualized. The detail description on the selected
technologies of different layers and demonstration of the implementation results are described in section 5.
Evaluation
An evaluation is done on the artifact to observe and measure that how well it supports the solution to the identified problem. This includes the comparison of objectives with the observed results. The evaluation section 6 shows that the model presented is implementable and it also shows that how much this provided solution is effective and efficient.
Communication
In this last step of DSR the discussion on how the identified problem is solved and how well solution provided is effective and related to the problem. This discussion is needed to be conveyed to the relevant audience. This discussion is mentioned in the conclusion and discussion section 7 in detail.
3.3
Research Approach
Figure 3-2: Research Approach
Figure 3-2 represents deductive research approach, as deductive research approach works from more general to more specific and often it is called as top-down approach. In this deductive approach relevant literature study is done and based on this literature study problem is understood and this problem understanding is narrowed down to the identification of research questions. Research method is selected and based on the problem area data is collected and analyzed and a model specific to the problem is proposed and tested. This research approach is characterized into three stages: problem definition, research design and execution. In problem definition stage firstly literature is studied so that to identify the general problem. Once the general problem is
known a hypothesis is made and on the basis of this hypothesis a more specific problem is identified through exploratory research and based on the problem definition research questions are formulated. Where as in the second stage suitable research methods are studied and based on the relevancy a research method is selected and data is collected. Once data is collected it is analyzed to identify the relevant data. In the third stage using the relevant data a model is proposed which helps in providing solution for the identified problem in stage 1. This proposed model is later evaluated based on identified research
problems. The mentioned approach is deductive because in this approach general theory is studied to bring out the specific problem and proposed solution for the identified problem.
3.4
Quantitative and Qualitative Data
Data that focuses on the numbers, measures of values or counts, frequencies instead of the meaning of the data is called quantitative method. In this method data is collected from experiments, surveys etc. Quantitative data is associated with experimental and scientific concerns. Researchers use this type of data to make generalization of population. In addition to this it helps the researchers to analyze in a logical and consistent way.
In qualitative methods data is collected from case studies or interviews and the concern of such type of data is to describe the meaning instead of to draw statistical inference. Qualitative data provides an in depth and rich description. It helps in seeking answers to the questions, collects evidence. In addition to this it helps in producing findings that cannot be determined in advance. It helps in studying and providing rich findings about the topic.
As this research work mainly focuses on how ontology based competence profile be visualized for the purpose of research collaboration, so to get the in depth knowledge of the topic and to produce findings later, qualitative data is collected. This approach is used because it helps to get results richer and informative. The data collected is using interviews with the researchers based on the semi-structured questions.
3.5
Data collection Techniques
According to [20] there are two sources of data collection. These two data sources are named as primary data and secondary data. Primary data collection is the data collected for the research problem that is at hand this data collection is collected by the researcher him/her self. Whereas secondary data collection is the data that is collected by others and it can be for different purposes. Depending on the nature of the problem researchers use both type of data collection techniques. In this research work I use both data collection
techniques to get the better understanding of the problems and to get broader view of problem in hand.
3.5.1 Secondary Data Collection
According to [20] secondary data is useful for the better understanding and the explanation of the research problem. Secondary data collection begins with the literature review which includes data sources like articles, research papers, journal articles, books etc. Secondary data is the data that is collected by others and can be for other purposes. It is not necessarily in line with the problem in hand, so necessary care should be taken when adapting secondary data. According to [20] secondary data is sometimes is not sufficient to get the complete understanding of the problem in hand therefore primary data collection is also need to be collected.
3.5.1.1 Literature Review
Detailed literature has been studied to maintain the background knowledge of the area and depending upon the literature study different visualization
techniques are studied and discussed. By doing literature review knowledge was gathered that gave the motivation for the thesis work.
3.5.1.2 Prototype Feedback
As discussed in the introduction section of the report that CLICK project is taken as a case study for this thesis work and as a secondary data feedback interviews are consider too for this thesis work. These feedback interviews are in the response of one of the Click project release. These interviews mainly focus on the interaction issues with the system. There are several suggestions for the enhancement in the system. The feedback gathered from these
3.5.2 Primary Data Collection
If the secondary data is not enough to answer the research questions then researcher must collect the relevant data as well. Such type of data is called as primary data. According to [20] there are several options for collecting primary data. These options includes surveys, interviews etc. Primary data is considered to be useful source of data for answering the research questions and for
empirical findings. In this thesis work I conducted interviews for the purpose of primary data.
3.5.2.1 Interviews
Interviews are conducted with different researchers to get the better understanding about how visualization can be improved for the research collaboration and which are the aspects that affects the research collaboration. The main idea of conducting these interviews is to know how researchers want the information visualization to be and to highlight the factors based on which a researcher like to collaborate for research purpose. These interviews are semi-structured and based on the questionnaire that is mentioned in the section 9.1. In addition to this some question might be brought up during the interview session.
Table 3-1: Interviewees Details
S. No Name Designation Date, Time /
Duration
Medium
1 Pär Höglund Postdoc at The
Jönköping Academy for Improvement of Health and Welfare 04-Jun-12, 10:00 / 30 Minutes Face to Face
2 Fahd Omair Zafar Phd Student at Chalmers University, Göteborg, Sweden 05-Jun-12, 21:30 / 50 Minutes Skype 3 Sara Södergren Riggare Doctoral student at
Karolinska Institutet 07-Jun-12, 1:30 / 15 min Skype
4 Julia Kaidalova Phd Student at
Jönköping University, Sweden 07-Jun-12, 2:00 / 15 min Face to Face
5 Paul de Roos MD 07-Jun-12, 20:30 /
60 min
Face to Face
3.6
Design Options and Decisions
There are several tools that have already been developed and are in use for the graph-based visualization of ontologies. But these tools are mostly used to just visualize the whole ontology irrespective of its size which leads to the issue of viewing and accessibility of a complex form of the ontology. When we talk about visualizing ontology-based competence profiles by any of the tool, then such visualization by the tool provides the user with a complete complex hierarchal structure of the profile. This issue highlights the point of having a form of visualization of the competence profile of researcher so that it fits within the visualization area and selected visualization technique must portray the complete, meaningful and ordered profile. From literature study it has been observed that there are several methods and technique but there is no specific method that appears to be the most suitable for the visualization purpose. According to [4] it will be better to provide the user with multiple
Furthermore it is also observed from one of the survey [15] that visualization is not enough for the representation of information but there must be some sort of search or query mechanism so that it will be easy for the user to navigate in the complex ontologies. Mostly users like to view the information representation in an ordered manner and dislike the messy information. So searching mechanism helps the user to find the relevant information as well. So the combination of a proper visualization technique with searching mechanism provides a user with easy to use navigation.
4 Empirical Findings and Analysis
This section describes the empirical results obtained from the primary and secondary data, analysis on the collected data. This is done by figuring out the necessary factors for the visualization in context of competency profiles from the literature study, researcher’s interviews and the feedbacks on the prototypes of the CLICK project. It is also explained why it is needed to have graph-based visualization. A description of a competence profile structure and a method for visualizing the competence profile and an implementation model is also
described in this section.
4.1
Primary Data Results
4.1.1 Interview ResultsBelow are the interview results about how different researchers perceive
information when viewing other researcher’s competence profile, in addition to this how a researcher want the information to be in context of information visualization, navigating information. These interview results also show what are the factors based on which a researcher is attracted for research
collaboration.
As mentioned in the method section that interviews are going to be conducted from different researchers, below are the results of the interviews.
Researcher 1:
―When viewing a researcher profile, I would like to try different setups like to
see which researcher you are connected to, link to the publications etc. As it is hard to understand the user pattern so it is better to provide with different navigation solutions so it is helpful for the researcher. Also I would like to see what researches have been done by the researcher and a word cloud provides me a better understanding of the areas of a researcher. List of recent
publication would provide a better understanding for researcher work too. Geographical location also matters in some contexts for me for research collaboration. Publication grouped by research area provides more understanding for me when viewing researcher profile.‖
Table 4-1: Interview results from Researcher 1
Interview Questions Replies
1) What is your preference for the navigation path of information when viewing a researcher
Different setups e.g. research areas, area of
![Figure 2-4: Visualization of Ontology [14]](https://thumb-eu.123doks.com/thumbv2/5dokorg/4535443.115085/21.892.137.812.108.480/figure-visualization-of-ontology.webp)


![Figure 2-5: Theme View Visualization of WebTheme [16]](https://thumb-eu.123doks.com/thumbv2/5dokorg/4535443.115085/26.892.181.712.179.547/figure-theme-view-visualization-webtheme.webp)
![Figure 2-6: Galaxy Visualization of WebTheme [16]](https://thumb-eu.123doks.com/thumbv2/5dokorg/4535443.115085/27.892.158.740.107.584/figure-galaxy-visualization-of-webtheme.webp)

![Figure 2-8: A Simple Node-Link Tree Visualization [15]](https://thumb-eu.123doks.com/thumbv2/5dokorg/4535443.115085/29.892.136.817.246.699/figure-a-simple-node-link-tree-visualization.webp)

