J
Ö N K Ö P I N GI
N T E R N A T I O N A LB
U S I N E S SS
C H O O L JÖNKÖPING UNIVE RSITYFDI Impact on Gross Profit,
Wages and Labour Productivit y
A Study of Swedish Firms in the Industrial Goods and Services Sector
Bachelor Thesis in Economics Author: Andreas Blick
David Mårtenson
Tutor: Börje Johansson
Bachelor’s Thesis in Economics
Title: FDI Impact on Gross Profit, Wages and Labour
Productivity
Author: Andreas Blick, David Mårtenson
Tutor: Börje Johansson, Tobias Dahlström
Date: June 2007
Abstract
This thesis analyses what effects foreign direct investments (FDI) has on a firm’s gross profit, wages and labour productivity. Focus is on the Swedish industrial goods and service sector which has shown on a rapid growth of offshore produc-tion. We use a theoretical framework with FDI and productivity theories. As a re-sult of cost efficient alternatives to domestic production, a firm’s productivity should fall in the case of increased foreign production. Although, the increase in gross profit should rule out the negative affect that a decrease in productivity cause.
There is a positive relationship between offshore production and gross profits, and expanded foreign production leads to a decreased wage rate. However, in-creased foreign employment showed a boost the labour productivity, which is wrong from a theoretical point of view.
Kandidatuppsats inom Nationalekonomi
Titel: Utländska direktinvesteringars påverkan på
vinst, löner och produktivitet
Författare: Andreas Blick, David Mårtenson
Handledare: Börje Johansson, Tobias Dahlström
Datum: Juni 2007
Sammanfattning
I den här uppsatsen analyseras hur utländska direktinvesteringar påverkar företags vinster, löner och arbetsproduktivitet. Fokus är ställt på svenska företag inom sektorn industriella varor och tjänster. Den teoretiska delen tar upp utländska direktinvesteringar och arbetsproduktivitet. Som ett resultat av kostnadseffektiva alternativ utomlands, borde arbetsproduktiviteten falla om den utländska produktionen ökar. Den väntade vinstökningen efter utlandslokalisering borde dock ge en generell positiv effekt.
Den empiriska delen visar ett positivt samband mellan utlandslokalisering och vinst. Bevis finnes också för att medellönen sjunker när utlandslokaliseringen ökar. Empiriska resultat visar också att ökad utlandslokalisering ökar arbetsproduktiviteten, vilket ur teoretisk ståndpunkt inte stämmer.
Table of Contents
1
Introduction ... 1
1.1 Problem ...1 1.2 Limitations ...2 1.3 Purpose ...2 1.4 Previous Studies...2 1.5 Outline ...32
Theoretical Framework... 3
2.1 Foreign Direct Investment...3
2.1.1 Horizontal versus Vertical FDI ...3
2.1.2 Theories of Foreign Direct Investments ...4
2.1.3 Eclectic Theory ...5
2.2 Productivity Theory...5
2.2.1 Wages Effect on a Firms Productivity...6
2.2.2 Productivity and Cost Minimization...7
3
Descriptive Statistics... 8
3.1 Data...8
3.2 Offshore Production...8
3.3 Growth in Productivity, Wages and Gross Profits...9
4
Empirical Framework... 11
4.1 Empirical Models ...12 4.2 Regression Results ...135
Analysis ... 15
6
Conclusion... 17
6.1 Future Studies ...18References ... 19
Appendix I ... 21
Appendix II ... 26
Figures
Figure 1 Foreign Employment 2001-2005...9
Figure 2 Labour productivity 2001-2005...10
Figure 3 Gross profit & Wage 2001-2005...11
Tables Table 1 Companies divided by size and fraction of foreign employment...9
Table 2 Labour productivity 2001-2005, descriptive statistics ...10
Table 3 Econometric test results data. Regression 1.A and 1.B ...14
Table 4 Econometric test results data. Regression 2.A and 2.B ...14
Table 5 Econometric test results data. Regression 3. ...15
Table 6 Cross tabulation model...15
Table 7 Econometric test results data, model 1.1 ...21
Table 8 Econometric test results data, model 1.2. ...21
Table 9 Econometric test results data, model 2.1. ...22
Table 10 Econometric test results data, model 2.2. ...22
Table 11 Econometric test results data, model 3.1. ...23
Table 12 Econometric test results data, model 3.2. ...23
Table 13 Econometric test results data, model 3.3. ...24
Table 14 Econometric test results data, model 3.4. ...24
Table 15 Econometric test results data, model 3.5. ...25
Table 16 List of companies ...26
Equations Equation 1...6 Equation 2...6 Equation 3...6 Equation 4...7 Equation 5...7 Equation 6...12 Equation 7...12 Equation 8...13
1 Introduction
Maximizing profits is the most fundamental aim for every operational firm (Var-ian, 2006). How to reach the goal is moreover a much more complex task. Dur-ing the last decades, FDI has become a revolutionary path to stimulate firm growth. The expression multinational enterprise has lately become a craze in economics literature. Due to stronger competition in western markets, corpora-tions have been stimulated to find new ways to stay competitive and gain market shares. Offshore production has grown rapidly and the global sales of multina-tional firms ruled out the global exports in the beginning of the 90’s (Dunning, 1998). This thesis focus on vertical integration as an attempt to minimize produc-tion costs. This type of off shoring has put more pressure on domestic producers, to increase their productivity. Furthermore focus will be on the labour side of vertical integration and how wages tend to affect the gross profits of firms with high rates of foreign employment and low rates respectively.
The large increase in FDI the last decades makes it a very hot topic in this era of internationalisation and globalisation. The Swedish approach is indeed interest-ing, especially due to high labour costs and taxes which firms in Sweden are faced with. The tax of labour is heavily debated in the Swedish and the conserva-tives want to decrease them to give incenconserva-tives for firms to expand their busi-nesses and to stay in Sweden (Brors, 2006, Isaksson 2007 & Erlandsson, 2006). On the other hand several firms in our data set still keep more than half of their employees in Sweden. In this sense we found the topic of offshore production among Swedish firms interesting; particularly what implications it has on produc-tivity, wages and gross profits. If labour costs decrease and gross profits increase when the fraction of foreign employment increases, one can argue that produc-tion abroad is the best path to follow for Swedish firms.
1.1 Problem
FDI has increased for several decades and it has reduced the incentive of export-ing and licensexport-ing different products (Dunnexport-ing, 1998). Vertical integration or cost efficient foreign solutions are closely related to the standardization phase in the product lifecycle theory. When the product has gone through its innovative pe-riod and the demand has grown strong on the home market, more firms have adapted the new product and produced similar ones. Due to falling prices and decreasing market shares in the home market, firms need to locate new demand-ing markets (Vernon, 1966). Simultaneously as the price and quantity sold fall so does the profit. Therefore, one reason for why firms seek cost effective solutions in foreign countries is the ambition to generate higher profits during the whole product lifecycle. More multinational firms have R&D units and product devel-opment in many countries (Buckley 1998).
The discussion about FDI has lately become a discussion about different advan-tages instead. This theory is called the eclectic theory. In order to succeed with a foreign investment, a firm need an ownership, location or internationalisation ad-vantage. The outsourcing of production has been an intentional breakthrough for the single firm, but the national governments have not been as positive. Gov-ernmental criticism of offshore production has been that jobs are becoming shipped out of the countries, leaving more people unemployed. Instead, there has been promotion for domestic production and spending resources on increas-ing productivity in the domestic markets.
Despite more resources spent on productivity development, smaller firms in par-ticular have had problems to compete with the cost-efficient firms, partly located outside Sweden. There are however positive results for the industry. High com-petition forces firms to increase their own productivity (Baldwin 1992). Data from the annual reports of large Swedish firms shows an increasing level of foreign occupation. The nationality of ownership plays a much smaller role nowadays when the focus has been drawn more towards competence, attractive markets and competitive alternatives. The Swedish weakness during the growing out-sourcing period has been the taxes and the labour market. The Swedish indus-trial goods and services sector is on of the sectors with the highest rates of out-ward FDI.
1.2 Limitations
This thesis does not try to explain why a firm undertakes FDI, (although empiri-cal results can give a hint of that) neither does it try to explain where FDI is di-rected or the ownership nationality. Instead the focus is laid on how the fraction of offshore production affects gross profits, wages and labour productivity. Al-though interesting, a research of why FDI is made must be carried out with quali-tative research as well and not purely quantiquali-tative as this study.
1.3 Purpose
The purpose of this thesis is to analyse if the fraction of firms’ workforce em-ployed outside the Swedish boarders affects the gross profit, wages and the la-bour productivity.
1.4 Previous
Studies
There have been extensive studies of FDI, especially since the foreign invest-ments exploded during the last decade. One of the first known modern theorists on the subject was Raymond Vernon, who came up with the still used product life cycle theory of foreign investments. John Dunning is another known author in the field. He constructed the eclectic theory during the 1970s. These two
theo-ries of foreign investments are the once mostly used when explaining why com-panies are undertaking foreign investments. As for the previous studies of labour productivity, the studies on FDI mostly concern the in- and outward investments of countries. The firm-specific studies are very few.
1.5 Outline
This thesis continues with the theoretical framework, which is chapter two. The third chapter discusses the data and is labelled descriptive statistics. The empiri-cal framework is chapter four and is followed by analysis in chapter five. Conclu-sions and further studies are given in chapter six.
2 Theoretical
Framework
2.1 Foreign Direct Investment
Buckley (1998) defines FDI as “the acquisition abroad of physical assets, such as plant and equipment, with operational control ultimately residing with the parent company in the home country” (Buckley p. 110, 1998). Many authors believes FDI has a positive effect for the host country of the investment, see for example Bende-Nabende (2002), Seid (2002) and Kjeldsen-Kragh (2002). The positive ef-fects of FDI are the important transfer of technology, the transfer of knowledge and the transfer of managerial skills from one country to another (Bende-Nabende, 2002). The inflow of capital to a developing country increases the total savings and the tax revenue in the country. Economic activity and overall social well-being increases as well with the inflow of FDI (Seid, 2002). During the last couple of decades FDI has increased a lot. In 1992 the global sales of multina-tional firms for the first time was larger than the world wide exports. FDI there-fore plays a very important role in the international economy. Investments by multinational firms increase competition and productivity everywhere (Dunning, 1998).
2.1.1 Horizontal versus Vertical FDI
There are two main types of FDI activities by firms; horizontal integration and vertical integration. The differences between them are how and where a firm produce and their objective of expansion (Bora, 2002). Horizontal investments take place when a production facility is duplicated in the host country of the in-vestment. The objective of this form of FDI is to get market access in another country. A reason for horizontal FDI can for example be an import barrier, which more or less rule out exports and FDI then is more efficient. Vertical FDI per-formed by a multinational firm is used for minimizing production costs and to produce more efficiently. Different stages in the production of a good are spread
over several countries and production facilities, and trade within the firm is nec-essary (Bora, 2002).
2.1.2 Theories of Foreign Direct Investments
In the literature about FDI there are especially two theories that explain why firms make investments abroad, instead of export and use licenses. The theories are the product life cycle of international investment and the eclectic theory (OLI paradigm). The product life cycle theory of international investment was first constructed by Vernon 1966, who aimed to explain why international production existed (Bende-Nabende, 2002). The theory is different from traditional trade theory due to four key assumptions:
• Taste is different in different countries • Economies of scale in production
• Flows of information between countries are restricted
• Over time the production process changes (Buckley 1998)
The original product life cycle theory consists of three phases; the new product phase, the maturing or growth phase and the standardization phase. The stage in which the product is situated is crucially in explaining where the product will be produced and sold (Kjeldsen-Kragh, 2002). The theory is based on the fact that new products will be innovated in advanced countries where the consumers are rich and able to acquire new products. The demand is greater, the speed of knowledge is faster and the communication between producers and consumers is better in advanced countries (Vernon, 1966).
The products that Vernon used to construct his theory are R&D and skill intense products. Because of this, the production will first only take place in the domes-tic market of the innovator, about which the innovator is assumed to possess greatest knowledge of. Another reason for this is that the flexibility of inputs is small; all the possible inputs need to be close to the production facility in order to not interrupt the production process. Moreover, for those products the em-ployees needs to be highly skilled, which also contributes to the theory of why production first will take place in an advanced country. Later in the product life cycle, when the product becomes more standardized, firms will choose to build production plants in low wage countries to keep their costs down (Vernon 1966). The theory of the product life cycle in international investment is not fully ac-cepted by economists, for example because it is not explaining why FDI is cho-sen instead of exporting or licensing and because of the theory cannot predict the trade of raw materials. The theory was more accurate a couple of decades
ago, and has less relevance today when multinational firms has R&D offices and new product development in many countries (Buckley 1998).
2.1.3 Eclectic Theory
The eclectic theory of FDI, developed by John Dunning, explains why FDI takes place at all. If a firm decides to perform FDI, there must be some advantage of this instead of exporting or licensing a product. Those advantages are what the eclectic theory explains. There are three advantages: ownership advantage, loca-tion advantage and internaloca-tionalisaloca-tion advantage (Bora, 2002 & Bende-Nabende, 2002).
• Ownership advantage: this advantage consists of advantages in production technology, managerial resources and marketing techniques. Those three assets give an advantage over national firms in the host country of the in-vestment. More effective production, ownership skills and marketing are the core of ownership advantage.
• Location advantage: the host country of the investment has to be attractive in some way. Low labour costs, large domestic market and tax incentives are a few location advantages.
• Internationalisation advantage: the internationalisation advantage is the in-centives that the firm may possess to perform FDI instead of licensing or exporting. Included here is for example the desire to erase the risk of losses due to fluctuations in exchange rates. (Bora, 2002 & Bende-Nabende 2002)
In summary, the theory explains that a firm start its production in the domestic country, when the demand for the product increases abroad exporting and maybe licensing will be the first international experience for the firm. When ex-ports gets sufficiently large and production, managerial and marketing techniques are well developed, FDI are considered. If the firm, at the same time, possess the three advantages mentioned above, FDI is a better option than licensing and ex-porting (Bora, 2002 & Bende-Nabende, 2002).
2.2 Productivity
Theory
The discussion about productivity has been more and more present during the last decades. Whether a study of the subject should focus on total factor produc-tivity (TFP) or labour producproduc-tivity differ in economic papers and literature.
The literature separates labour productivity from TFP. It is claimed that increasing TFP is a result of technological progress while labour productivity growth is a phenomena build on the connection between capital and labour inputs. The
most recent examined factors of productivity growth are assets such as manage-rial skills, technology, human capital and regulation. Hence, there is lacking knowledge of their relative importance and how they interact. One commonly used function of labour productivity is the Bartelsman and Dooms theory which is stated as follows: Equation 1 ) / ( it it it Y l LP =
In the equation above Y denotes the output for firm i during period t. l is an ex-pression of the amount labour input of firm i in period t. Moreover, labour pro-ductivity is usually expressed as the average output produced by each input of labour each working hour. Labour productivity can be calculated on a national level or within industries, but when it comes down to the firm level it becomes more complex. The lack of information of working hours on firm level makes this theory difficult to use when one analyses annual report data.
The other measurement of productivity, TFP, is expressed as follows: the extra output produced when one hold the input of labour and capital fixed. Instead it is technological progress that results in a growing rate of TFP. Adapting this on a firm level showed to be difficult as well because data on technological process are not to be found on firm level. One reason is that one cannot measure the skills of a firm’s labour with a numerical angle of approach. We therefore suffer some setbacks when we try to use TFP as a measurement of the chosen firms. Since we do not have any data on working hours either we cannot use none of the Bartelsman and Domms theory or TFP in our analysis. Instead we have to narrow it down and focus on the wages.
2.2.1 Wages Effect on a Firms Productivity
A partly off shored firm with the aim to be cost-effective have two different wage levels. The foreign wages have to be lower than the domestic wages in order for a successful investment. W/L1 is a firm’s average wage rate in Sweden, while W/L2
expresses the average wage rate in the foreign country: Equation 2
2
1 /
/L W L
W >
The total wage is the sum of W1 and W2:
Equation 3
2
1 W
W +
When a firm chooses offshore production, it results in that foreign employment increases while the home employment has an opposite effect. Moreover it is a
relative decrease in the amount of home employment. As an effect of the off-shored production the total wages paid will fall.
Equation 4 ↓ ↓⇒Total wages 2 / 1 U U
According to microeconomic theory, labour productivity increases with the wages. Higher wages has a positive effect on labour productivity (Neil & Sollow, 2001). The other factor that can boost productivity is technological progress. Al-though in this thesis we focus on labour and the price of labour as the only shift-ing factor. Therefore we consider the rate of technology to be equal among the firms. Moreover, when we look at wage as a factor of productivity we reach the following labour productivity formula based on gross profits and wages.
Equation 5
B W
F= +
In this equation F denotes labour productivity as a function of the total wage and the gross profit. There are several reasons why corporations move parts of their production abroad. Thus, since we believe that the Swedish industrial goods and service sector is relatively labour intensive, the probable reason of the offshoring is to minimize cost.
From this model we assume that a higher rate of foreign production will lead to lower total wages (W). Furthermore, the gross profit (B) will boost because of a declining production costs. The wages will decrease faster than the boost of the gross profits which will cause the labour productivity (F) to fall. Therefore, com-panies with higher rates of foreign employment gain higher gross profits despite a lacking annual labour productivity. Thus, it might be lags in the statistical re-sults from the observations. An increase in foreign employment may not show an immediate increase in the gross profit. We therefore use a lag of two and three years respectively for the gross profits, to analyze if we can find evidence of an increasing effect. We also test if there are evidence of a positive correlation be-tween gross profit (B) and wage per employee. A high rate of foreign employ-ment will most likely generate a high gross profit per employee despite the nega-tive effect on labour productivity. Thus, F will drop slower than B/W will in-crease.
2.2.2 Productivity and Cost Minimization
Stefan Tangen (2003) discusses different endogenous and exogenous factors which influence productivity. In order to compete with firms with high rates of FDI, the firms with low rate need to improve factors such as speed, reliance, flexibility, and quality. The fifth factor which is cost may be difficult to adjust in
shorter perspectives when keeping the amount of capital and labour constant. In order to increase productivity this put pressure on technological progress.
It is the cost advantage which many outsourced firms possess that is the greatest treat to domestic production. Furthermore, when discussing costs, Tangen (2003) means that a firm can keep their prices low or have a high value added. The other path is cost efficient operations which is one reason to invest in foreign countries. An effective cost efficient operation such as FDI, put pressure on the domestic firms the increase their other factors. Although, there is a start-up proc-ess of a new factory or entering a new market abroad and it will most likely re-sult in a competitive advantage for the investing firm. Moving production to a low cost country is one way to minimize the firm’s costs and thereby be able to keep a high profit margin. Moreover, since we believe that the industrial goods and service sector is a relatively labour intensive sector, cost minimization is the probable reason of the outsourcing in the first place.
3 Descriptive
Statistics
3.1 Data
Data for the empirical analysis has been collected for the years 2001 to 2005 for Swedish companies within the sector industrial goods and services. The main sources are Largest Companies database and the Osiris database. Annual reports from the companies have also been used in the search for the data. The data in-clude: number of employees, fraction of employees working abroad, total wages and gross profit. In the Osiris database we searched for Swedish, publicly quoted companies in the industrial goods and services sector. 77 companies were listed, and a “single out” process started. Companies younger than five years and com-panies that lacked data were, for obvious reasons, taken away. After this process, 46 random sized companies were left. One advantage with using companies from only one sector is that the market trend is the same for all companies, which is why no market trend deflator is used in our models. Another advantage is that the firms have similar production and costs so that they can be compared in the first place.
3.2 Offshore
Production
Between 2001 and 2005 the foreign employment among the companies in our data set increased by 12 percent. The mean for the years can be seen in figure 1.
Figure 1 Foreign Employment 2001-2005 Foreign Employment 2001-2005 2001 2002 2003 2004 2005 36 38 40 42 44 46 48 Year F o re ig n E m plo y m e n t, %
Source: Constructed by authors with data from Largest Companies and Annual Reports from 2002-2006
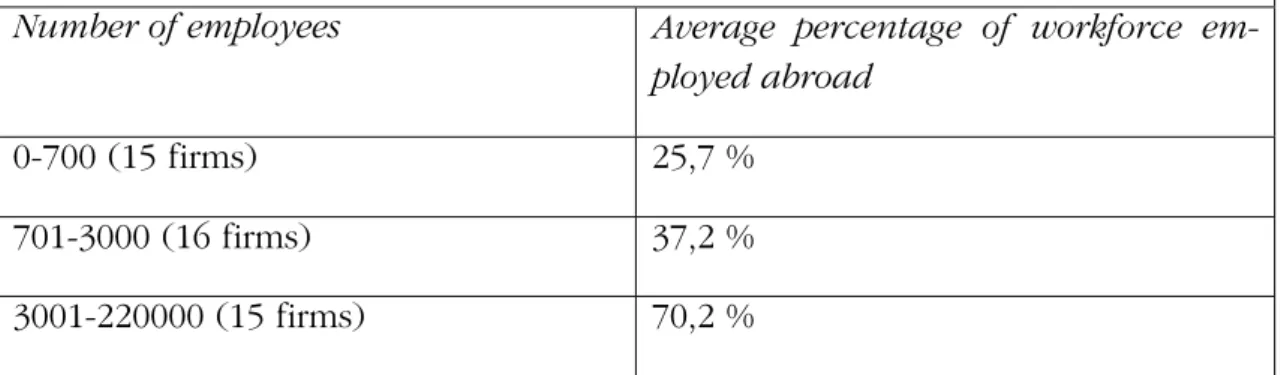
There is a downturn in 2002, but from 2003 and forward the fraction of the work-force employed abroad has increased on a yearly basis. The companies in the in-dustrial goods and services sector raise their fractions of the workforce employed abroad, which is an evidence of more offshore production. The data also shows that the more employees in a company, the larger is the fraction of foreign em-ployment. A large company tends to have more foreign production than a smaller one, which is showed in table one.
Table 1 Companies divided by size and fraction of foreign employment
Table 1. Companies divided by size and fraction of foreign employment.
Number of employees Average percentage of workforce
em-ployed abroad
0-700 (15 firms) 25,7 %
701-3000 (16 firms) 37,2 %
3001-220000 (15 firms) 70,2 %
Source: Constructed by authors with data from Largest Companies and Annual Reports from 2002-2006
3.3 Growth in Productivity, Wages and Gross Profits
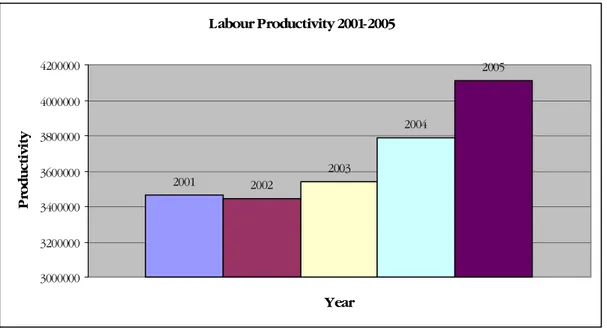
The labour productivity has increased with almost 16 percent over the time span. The average productivity level among the companies can be seen in figure two.
There is a small downturn from 2001 to 2002, but since 2002 the productivity level has increased every year. Both 2000 and 2001 were relatively bad years on the stock market and for the overall economy activity (see for example the An-nual Report from Second Swedish National Pension Fund 2001) which is one rea-son for the decrease in 2002.
Figure 2 Labour productivity 2001-2005
Labour Productivity 2001-2005 2001 2002 2003 2004 2005 3000000 3200000 3400000 3600000 3800000 4000000 4200000 Year P roduc ti vi ty
Source: Constructed by authors with data from Largest Companies and Osiris Database
Below, in table two, descriptive statistics for the labour productivity show that there is a great difference between the maximum and the minimum productivity level among the companies. One interesting point is that the minimum productiv-ity level has more than doubled between 2001 and 2005, whereas the maximum decreased between 2001 and 2004 before returning in 2005 to a slightly higher level than 2001.
Table 2 Labour productivity 2001-2005, descriptive statistics
Table 2. Labour productivity 2001-2005, descriptive statistics.
Year Mean Median Maximum Minimum Std. Dev.
2001 3465654 401600 46131387 23772 8489441
2002 3444905 391134 44863660 24548 8302041
2003 3538571 394309 40086969 32253 8472144
2004 3785989 414950 40405999 35925 8810690
Source: Constructed by authors with data from Osiris database
The wage level has encountered a moderate increase of seven percent within the group of companies from 2001 to 2005. The cost of employees in the total manu-facturing sector in Sweden grow with 5,2 percent yearly between 2001 and 2003, and is expected to grow with 4,0 percent between 2004 and 2006 (Facken inom industrin, 2006). The lower increase among the companies in our investigation can be explained by the increase in foreign employment. As the labour produc-tivity and the foreign employment, the average gross profit also faced a downturn in 2002. Since 2002, however the average gross profit for the companies has quadrupled. The development of the average gross profit and wage level can be seen in figure three.
Figure 3 Gross profit & Wage 2001-2005
Gross profit & Wage 2001-2005
0 200000 400000 600000 800000 1000000 1200000 2001 2002 2003 2004 2005 Year Th S E K Gross profit Wage
Source: Constructed by authors with data from Largest Companies and Osiris Database
4 Empirical
Framework
The aim in this thesis is to see if the labour productivity, wages and the gross profit are related to the fraction of the workforce employed outside Sweden. Since there must be underlying reasons for foreign investments, this empirical chapter will see if the labour productivity, wages and the gross profit in some way are affected by the fraction of the workforce employed abroad. There are of course many other variables affecting FDI than labour productivity, wages and gross profit. However, they are not taken into account in this thesis.
4.1 Empirical
Models
Three main regressions will be tested and analyzed. Cross tabulation is also used to explain the findings in the research. Below the three main regressions are stated and explained in detail.
Equation 6 t t c Ut Wt F = +β1* +β2* +µ 1.A t t c avgU avgW F = +β +β +µ ∆ − 1* 2* 1.B (2001 2005)
Where the variables are the following:
Ft = labour productivity
Ut = the percentage of the workforce employed abroad
Wt = wage per employee
avgU = average percentage (2001-2005) of the workforce employed abroad avgW = average (2001-2005) wage per employee
µt = error term
t = 2001, 2002, 2003, 2004, 2005
Besides the nominal labour productivity, the change in the variable will also be tested against foreign employment and wages. The expectation, as explained in the theoretical framework, is that the labour productivity, F, will decrease when U increases, and increase when W increases.
Equation 7 t t t c B U = +β1* +2+µ 2.A t t t c B U = +β1* +3+µ 2.B Where:
Ut = the percentage of the workforce employed abroad
Bt = gross profit µt = error term
t = 2001
In regression number two we believe that the fraction of foreign employment can have a lagged effect towards the gross profits. If a firm increases their fraction of workforce employed abroad in year t,the result of this may not be observed
di-rectly. Start up and training costs abroad will probably be high, which lower the profit margin in the beginning. After year t, however, those costs disappear or fall. This may imply that the profit margin increase again. We will test if the per-centage of the workforce employed abroad in 2001 has a positive relationship with the gross profit a couple of years later, which also is our prediction. The re-gressions include lead terms, Bt+2 and Bt+3, which are used as indicators of future expectations of the gross profit (Gujarati, 2003).
Equation 8 t t t c U W = +β1* +µ 3. Where:
Wt = wage per employee
Ut = the percentage of the workforce employed abroad µt = error term
t = 2001, 2002, 2003, 2004, 2005
Firms may invest in foreign countries due to the possibility to decrease costs. In this regression we test if the wages decrease when foreign employment in-creases, and the five years are tested separately. We expect the relation between wage per employee and foreign employment to be negative. If this relation holds, we can draw the conclusion that the companies try to decrease costs when they decide to undertake foreign investments.
According to our expectations, the gross profit will increase and wages decrease when foreign employment increases. The result from this test is showed in a cross tabulation model (table six). We choose a cross tabulation here to stress the relationship between the two variables. On the left hand side the ratio gross prof-its divided by wage per employee is used, and on the right hand side the fraction of the workforce employed abroad. Since the ratio gross profits divided by the wages increases if either W decreases or B increases, the expectations of the re-sults is that a high fraction of the workforce employed abroad is correlated with a high B/W ratio.
4.2 Regression
Results
Complete results of all tests performed are found in appendix I.
The first regression states that the percentage of the workforce employed abroad and the wage level will affect the labour productivity. For the change in the la-bour productivity over our time period following model is esti-mated:∆(2001−2005)Ft =c+β1*avgU+β2* avgW+µt. An average of the fraction of
the workforce employed abroad is calculated and then tested against the change in labour productivity. The results can be seen below:
Table 3 Econometric test results data. Regression 1.A and 1.B
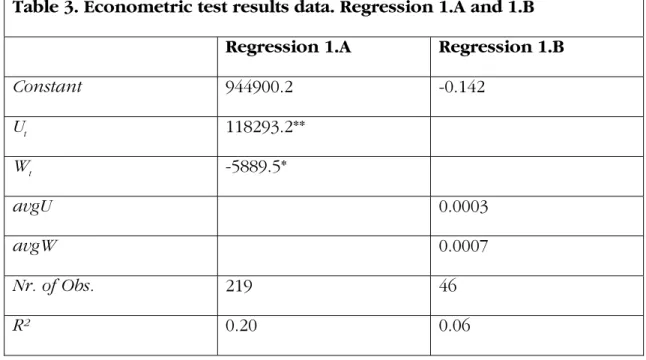
Table 3. Econometric test results data. Regression 1.A and 1.B
Regression 1.A Regression 1.B
Constant 944900.2 -0.142 Ut 118293.2** Wt -5889.5* avgU 0.0003 avgW 0.0007 Nr. of Obs. 219 46 R² 0.20 0.06
Note: ** Significant at 1 % level, * Significant at 5 % level
Table number four presents the regressions with the fraction of foreign workforce for the year 2001 as the dependent variable with gross profit in 2003 and 2004 as independent variables. The results are as follows:
Table 4 Econometric test results data. Regression 2.A and 2.B
Table 4. Econometric test results data. Regression 2.A and 2.B
Regression 2.A Regression 2.B
Constant 34.97** 36.55**
Bt+2 0.011**
Bt+3 0.005**
Nr. of Obs. 45 45
R² 0.23 0.15
Note: ** Significant at 1 % level
As stated above, regression three is tested for the five years separately. The re-sults are presented in the table below:
Table 5 Econometric test results data. Regression 3.
Table 5. Econometric test results data. Regression 3.
2001 2002 2003 2004 2005
Constant 518.59** 513.12** 516.13** 518.28** 511.74**
Ut -2.25** -1.89* -1.78** -1.63** -1.11
Nr. of Obs. 45 45 40 46 46
R² 0.14 0.10 0.12 0.15 0.05
Note: ** Significant at 1 % level, * Significant at 5 % level
The result of the cross tabulation is presented below. The reasoning is that a high per-centage of the workforce employed gives a higher gross profit per wages paid out. The cross tabulation are for the years 2001, 2002, 2004 and 2005.
Table 6 Cross tabulation model
Table 6. Cross tabulation model. U High Low Total High 65 26 91 B/W Low 26 65 91 Total 91 91 182 Chi-square 33.42**
Note: ** High significance U= percentage of the workforce employed abroad, B/W= gross profit di-vided by wage per employee.
5 Analysis
The labour productivity, F, is positively correlated with the fraction of the work-force employed abroad (denoted U). The variable U is significant at the one per-cent level; the relationship cannot be rejected. The wage per employee is nega-tively related with labour productivity. The R²-squared is not very high in the first regression and the constant is insignificant. The opposite relationship was ex-pected; that F would be negatively related to foreign employment and positively related to wages. But in our set of data the labour productivity increases when the fraction of the workforce employed abroad increases, keeping everything else
constant. An explanation might be the fact that there are different wage levels in different countries. If we assume that a company pays the sector average wage to its employees in Sweden, those employees can find another job in the same sec-tor with the same wage. Further, suppose that this Swedish company pays a wage higher than the sector average wage in a low income country. In India, for example, it is usual that foreign companies pay a higher wage than the average. The employees in the foreign country also know that it is difficult to find a work with a higher wage than the average wage. This makes the employees to work harder, which increase the labour productivity.
The regression result also shows a negative relation between the wage per em-ployee and the labour productivity. This result makes no sense according to eco-nomic theory. The productivity of a worker is not likely to decrease if the worker receives a higher wage. One explanation for this can be omitted variables. From the change in productivity over the chosen years the conclusion is that the change in F is not correlated with the average foreign employment level. Neither is F correlated with the average wage per employee over the selected years Re-gressions on particular years give similar results as the one presented in table two. A change-on-change regression with the two variables also gave insignifi-cant results.
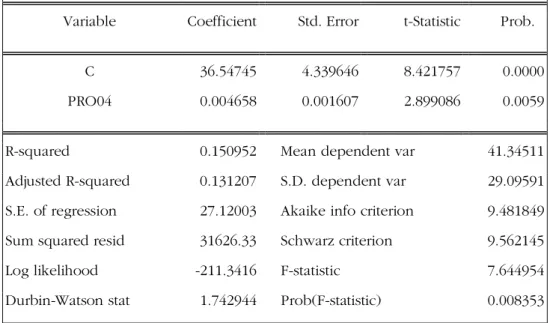
As discussed in the theory part, time lags are used to see how the gross profits are related to foreign employment. The percentage of workforce employed abroad in the year 2001 is positively related to gross profits in 2003 and 2004 for our group of companies. The results are significant at the one percent level. The relation can’t be rejected; cost minimization can therefore be a reason for foreign investments. It is interesting no significant relationship between the percentage of workforce employed abroad in the year 2001 and the gross profit in 2002 is found. This is clearly an evidence of the high start up costs related to FDI. The gross profits probably increase due to lower costs, the result in regression one shows however that labour costs is not one of them. Similar regressions for the years 2002, 2003 and 2004 also are significant.
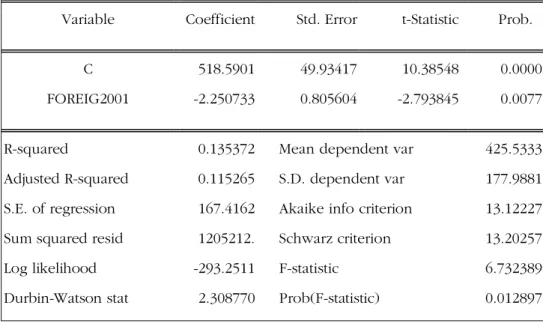
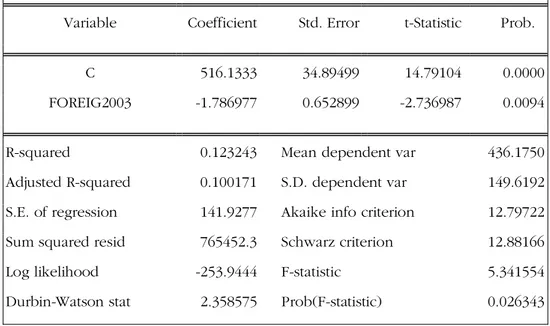
The result from regression number three, that wage per employee and foreign employment are negatively correlated, is in line with the expectations. For all the years the coefficient for the fraction of the workforce employed abroad is nega-tively correlated with the wage per employee. All the results, except for the year 2005, are significant at the one or the five percent level. When the fraction of the workforce employed abroad increases the wage per employee decreases. Swe-den is a country with relatively high costs of labour, so when firms place more production abroad, those costs can be expected to decrease. This is especially true if FDI is preformed in low wage countries, such as India or Mexico. The in-dustrial goods and services sector is a labour intensive sector, which give further evidence for the cost minimization reason for foreign investments.
The B/W ratio, the gross profit divided by wage per employee is tested against foreign employment in a cross tabulation table. The relation that this ratio hold is interesting because, as results shows, a high percentage of the workforce em-ployed abroad gives a higher gross profit per wages paid out. The chi-square value of 33.42 is significant, so we cannot reject the relationship. All the regres-sions presented have relatively low R². As stated in the first paragraph of this chapter, there are many variables that affect productivity, wages and gross profit. Exact figures to calculate the total factor productivity for a single firm are hard to find, and at the firm level the exact output produced per hour of labour is also hard to calculate. Even though the R² are low in the regressions, almost all of them show significant relationships.
6 Conclusion
The purpose of this thesis was to analyse if gross profit, wage and the labour productivity are related to the fraction of firms workforce employed outside Swedish boarders. Both the productivity and the labour employed abroad have increased the last couple of years in the industrial goods and service sector. The cost efficient choice of investments can be a form of location advantage over firms in the target countries. Risk averse behaviour of investments in production plants abroad, instead of exports or licenses, can be a further reason of growing FDI.
The results show that there is a positive relationship between offshore production and gross profits, and that expanded foreign production leads to a decreased wage rate. In the case of labour productivity we found that it was positively related with the fraction of the workforce employed abroad, and negatively cor-related with the wage rate. Opposite results were expected in this regression and the negative correlation between productivity and the wage rate might be a result of either omitted variables or a possible misspecification of the labour productiv-ity formula. Theoretically higher wages stimulate productivproductiv-ity. Therefore the la-bour productivity should decrease with foreign direct investments in low wage countries.
We found evidence of a time lag of two years and forward in the boost of gross profits when the FDI rate is increased. The time lag can be connected to factors such as high start up costs, delays and other problems in the start of the process. The escalated levels of gross profits after a couple of years can be evidence of an efficient cost investment. If the increased profit level of one company is visible to others in the sector they might choose to increase their foreign investments as well. Market leaders are in general better scouts of new target markets, than the market followers. As a result, the followers will most likely face higher start up costs due to market failures. The avoidance of those market failures can explain
the short time lag of our results. A sample of smaller and younger firms will probably show a more delayed effect.
There was a negative connection between the wage rate and the share of foreign employment as we expected. When the foreign workforce increases, it results in a lower average wage. Furthermore, Sweden’s powerful labour unions, high taxes and relatively high minimum wages drive up the price of labour. This is one motive to why low wage countries are targeted.
6.1 Future
Studies
Since the focus in this thesis has been on how offshore labour affects the gross profits, wage and labour productivity, the aim has been kept quite narrow. It would be interesting to try other industries and compare if one can find similar or completely opposite effects of FDI flows.
In addition, one can look at the exact geographical direction of the investments. Are there for example differences in regions where there are more MNE’s gath-ered, which can benefit from spill over effects and thereby result in a higher total growth for the region. Furthermore, an interesting study would be to analyze how Swedish firm with a home concentrated production approach the tough competition from foreign direct investors, and what strategies they choose and what they need to improve to increase their own productivity and competitive-ness even more. To compare foreign regional growth rates where there is high rates of Swedish investments, can thereby be a way to estimate the productivity and efficiency of Swedish industries. Another approach could be to research about if companies move production abroad, to avoid bankruptcy for example, or if they open up a plant abroad and keep the same number of employees in Sweden.
References
Baldwin, R. (1992). On the growth effect of important competition. Working pa-per no.4045, National Bureau of Economic Research.
Bende-Nabende, A. (2002). Globalisation, FDI, Regional Integration and
Sustain-able Development: Theory, Evidence and Policy. United Kingdom: Ashgate.
Bora, B. (2002). Foreign Direct Investment, Research Issues. United Kingdom: Routledge.
Brors, H. (2006, August 23). Morot och piska för att få fler människor i arbete.
Dagens Nyheter. Retrieved 2007-06-15, from
http://www.dn.se/DNet/jsp/polopoly.jsp?a=567410
Buckley, A. (1998). International Investment: Value Creation and Appraisal, a
Real Options Approach. Denmark: Copenhagen Business School Press.
Companies Annual Reports 2002-2006
Dunning, J. (1998). Globalization, trade and foreign direct investment. Netherlands: Elsevier.
Erlandsson, L. (2006, May 26). Politiker sover medan jobben flyttar utomlands.
Aftonbladet. Retrieved 2007-06-15, from
http://www.aftonbladet.se/vss/debatt/story/0,2789,830986,00.html Facken inom industrin (October, 2006). Ekonomiska Bedömningar inför
avtalsrörelsen 2007. Retreived 2007-07-04, from
http://www.ifmetall.se/ifmetall/home/home.nsf/docs/Ekonomiska%20bed%C3%B 6mningar%202006.pdf/$FILE/Ekonomiska%20bed%C3%B6mningar%202006.pdf Gujarati, D. (2003). Basic Econometrics (4th
ed.). United States of America: McGraw-Hill.
Isaksson, A.. (2007, June 16). Hyckleri om skatten. Dagens Nyheter. Retrieved 2007-06-18, from http://www.dn.se/DNet/jsp/polopoly.jsp?a=661590
Kjeldsen-Kragh, S. (2002). International Economics: Trade and Investment. Den-mark: Copenhagen Business School Press.
Largest Companies. (2007). Retrieved in May 2007, from http://www.largestcompanies.com/
Neil, M. & Sollow, R. (2001). Journal of Economic Perspectives, 15(3), 151-172. Osiris Database (2007). Retrieved in May 2007, from
Second Swedish National Pension Fund. Annual Report 2001. Retrieved 2007-06-16, from http://www.ap2.se/upload/2001_ar_eng_ap2.pdf
Seid, S. (2002). Global Regulation of Foreign Direct Investment. United Kingdom: Burlington, VT, Ashgate.
Tangen, S. (2003). “Produktivitet i fokus del 3 – Hur kan man mäta produktivitet?” Bättre Produktivitet 2/2003.
Tangen, S. & Grünberg, T. (2003). ”Produktivitet i fokus del 1 – Ett forskningsprojekt för bättre produktivitet i svensk industri”. Bättre produktivitet 2/2003
Varian, H. (2006). Intermediate Microeconomics (7th ed.). United States of Amer-ica: W.W. Norton & Company.
Vernon, R. (1966). International Investment and International Trade in the Prod-uct life Cycle. Quarterly Journal of Economics, 80(2), 190-207.
Appendix I
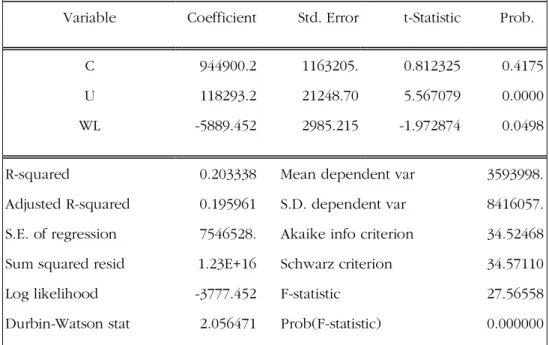
Model 1.1 µ β β + + + =c Ut Wt Ft 1* 2*Table 7 Econometric test results data, model 1.1
White Heteroskedasticity-Consistent Standard Errors & Covariance
Variable Coefficient Std. Error t-Statistic Prob.
C 944900.2 1163205. 0.812325 0.4175 U 118293.2 21248.70 5.567079 0.0000 WL -5889.452 2985.215 -1.972874 0.0498
R-squared 0.203338 Mean dependent var 3593998. Adjusted R-squared 0.195961 S.D. dependent var 8416057. S.E. of regression 7546528. Akaike info criterion 34.52468 Sum squared resid 1.23E+16 Schwarz criterion 34.57110 Log likelihood -3777.452 F-statistic 27.56558 Durbin-Watson stat 2.056471 Prob(F-statistic) 0.000000
Model 1.2
t
t c avgU avgW
F = +β +β +µ
∆(2001−2005) 1* 2*
Table 8 Econometric test results data, model 1.2.
White Heteroskedasticity-Consistent Standard Errors & Covariance
Variable Coefficient Std. Error t-Statistic Prob.
C -0.141744 0.169699 -0.835263 0.4082 AVGU 0.000327 0.002235 0.146121 0.8845 AVGW 0.000746 0.000423 1.764452 0.0848
R-squared 0.061533 Mean dependent var 0.201120 Adjusted R-squared 0.017884 S.D. dependent var 0.409719 S.E. of regression 0.406039 Akaike info criterion 1.098258 Sum squared resid 7.089308 Schwarz criterion 1.217517 Log likelihood -22.25994 F-statistic 1.409712 Durbin-Watson stat 2.375150 Prob(F-statistic) 0.255273
Model 2.1 µ β + + = 1* t+2 t c B U
Table 9 Econometric test results data, model 2.1.
White Heteroskedasticity-Consistent Standard Errors & Covariance
Variable Coefficient Std. Error t-Statistic Prob.
C 34.97143 4.100360 8.528869 0.0000 PRO03 0.011332 0.002809 4.033852 0.0002
R-squared 0.231983 Mean dependent var 41.34511 Adjusted R-squared 0.214122 S.D. dependent var 29.09591 S.E. of regression 25.79346 Akaike info criterion 9.381545 Sum squared resid 28608.01 Schwarz criterion 9.461842 Log likelihood -209.0848 F-statistic 12.98831 Durbin-Watson stat 1.689810 Prob(F-statistic) 0.000809
Model 2.2 µ β + + = 1* t+3 t c B U
Table 10 Econometric test results data, model 2.2.
White Heteroskedasticity-Consistent Standard Errors & Covariance
Variable Coefficient Std. Error t-Statistic Prob.
C 36.54745 4.339646 8.421757 0.0000 PRO04 0.004658 0.001607 2.899086 0.0059
R-squared 0.150952 Mean dependent var 41.34511 Adjusted R-squared 0.131207 S.D. dependent var 29.09591 S.E. of regression 27.12003 Akaike info criterion 9.481849 Sum squared resid 31626.33 Schwarz criterion 9.562145 Log likelihood -211.3416 F-statistic 7.644954 Durbin-Watson stat 1.742944 Prob(F-statistic) 0.008353
Model 3.1-3.5 t t t c U W = +β1* +µ Model 3.1: 2001
Table 11 Econometric test results data, model 3.1.
White Heteroskedasticity-Consistent Standard Errors & Covariance
Variable Coefficient Std. Error t-Statistic Prob.
C 518.5901 49.93417 10.38548 0.0000 FOREIG2001 -2.250733 0.805604 -2.793845 0.0077
R-squared 0.135372 Mean dependent var 425.5333 Adjusted R-squared 0.115265 S.D. dependent var 177.9881 S.E. of regression 167.4162 Akaike info criterion 13.12227 Sum squared resid 1205212. Schwarz criterion 13.20257 Log likelihood -293.2511 F-statistic 6.732389 Durbin-Watson stat 2.308770 Prob(F-statistic) 0.012897
Model 3.2: 2002
Table 12 Econometric test results data, model 3.2.
White Heteroskedasticity-Consistent Standard Errors & Covariance
Variable Coefficient Std. Error t-Statistic Prob.
C 513.1245 44.83319 11.44519 0.0000 FOREIG2002 -1.898528 0.792845 -2.394575 0.0211
R-squared 0.099979 Mean dependent var 435.8000 Adjusted R-squared 0.079048 S.D. dependent var 172.8000 S.E. of regression 165.8297 Akaike info criterion 13.10323 Sum squared resid 1182478. Schwarz criterion 13.18352 Log likelihood -292.8226 F-statistic 4.776641 Durbin-Watson stat 2.307525 Prob(F-statistic) 0.034342
Table 13 Econometric test results data, model 3.3.
White Heteroskedasticity-Consistent Standard Errors & Covariance
Variable Coefficient Std. Error t-Statistic Prob.
C 516.1333 34.89499 14.79104 0.0000 FOREIG2003 -1.786977 0.652899 -2.736987 0.0094
R-squared 0.123243 Mean dependent var 436.1750 Adjusted R-squared 0.100171 S.D. dependent var 149.6192 S.E. of regression 141.9277 Akaike info criterion 12.79722 Sum squared resid 765452.3 Schwarz criterion 12.88166 Log likelihood -253.9444 F-statistic 5.341554 Durbin-Watson stat 2.358575 Prob(F-statistic) 0.026343
Model 3.4: 2004
Table 14 Econometric test results data, model 3.4.
White Heteroskedasticity-Consistent Standard Errors & Covariance
Variable Coefficient Std. Error t-Statistic Prob.
C 518.2837 25.13432 20.62056 0.0000 FOREIG2004 -1.631616 0.545263 -2.992347 0.0045
R-squared 0.149328 Mean dependent var 442.6087 Adjusted R-squared 0.129995 S.D. dependent var 121.9697 S.E. of regression 113.7661 Akaike info criterion 12.34867 Sum squared resid 569479.7 Schwarz criterion 12.42818 Log likelihood -282.0194 F-statistic 7.723818 Durbin-Watson stat 2.225212 Prob(F-statistic) 0.007985
Table 15 Econometric test results data, model 3.5.
White Heteroskedasticity-Consistent Standard Errors & Covariance
Variable Coefficient Std. Error t-Statistic Prob.
C 511.7402 29.81263 17.16522 0.0000 FOREIG2005 -1.112266 0.757112 -1.469090 0.1489
R-squared 0.051915 Mean dependent var 459.5217 Adjusted R-squared 0.030368 S.D. dependent var 140.8263 S.E. of regression 138.6715 Akaike info criterion 12.74460 Sum squared resid 846110.4 Schwarz criterion 12.82410 Log likelihood -291.1257 F-statistic 2.409338 Durbin-Watson stat 2.227179 Prob(F-statistic) 0.127777
Appendix II
Table 16 List of companies AB ANGPANNEFORENINGEN AB WESTERGYLLEN ADDTECH AB ALFA LAVAL AB ATLAS COPCO AB B&B TOOLS AB BEIJER ALMA AB BEIJER ELECTRONICS AB BROSTROM AB BTS GROUP AB CARDO AB CASH GUARD AB CONSILIUM AB DUROC AB ELEKTRONIK GRUPPEN BK AB FIREFLY AB G & L BEIJER AB HEXAGON AB HL DISPLAY AB INTELLECTA AB INVESTMENT AB LATOUR KAROLIN MACHINE TOOL AB LAGERCRANTZ GROUP AB
LINDAB INTERNATIONAL AB MICRONIC LASER SYSTEMS AB MIDWAY HOLDING AB MUNTERS AB NEFAB AB OEM INTERNATIONAL AB PARTNERTECH AB POOLIA AB PRICER AB PROFFICE AB PROFILGRUPPEN AB REDERI AB TRANSATLANTIC SAAB AB SANDVIK AB SCANIA AB SECO TOOLS AB SECURITAS AB SEMCON AB SKF AB TRELLEBORG AB VOLVO AB XANO INDUSTRI AB XPONCARD GROUP AB