Rapport 10 − 2007
Risk Assessment of Methylmercury
in Fish
Produktion:
Livsmedelsverket, Box 622 SE-751 26 Uppsala, Sweden Teknisk redaktör:
Merethe Andersen Tryck:
Livsmedelsverkets rapportserie är avsedd för publicering av projektrapporter, metodprövningar, utredningar m m. I serien ingår även reserapporter och konferensmaterial. För innehållet svarar författarna själva.
Rapporterna utges i varierande upplagor och tilltrycks i mån av efterfrågan. De kan rekvireras från
Livsmedels-Contents
Preface... 3 Introduction ... 4 Concentrations in food ... 5 Fish... 5 Other foods... 8 Cooking... 8 Exposure... 9 Fish consumption ... 9 Intake calculations... 11Concentrations in the body... 15
Effects in humans... 20
Effects of prenatal exposure on the central nervous system ... 20
Cardiovascular effects... 23
Immune system ... 25
Risk assessments ... 27
Risk characterisation ... 30
Comparisons between intake/exposure and tolerable intake... 30
Comparison between exposure on the Faroe Islands and in Sweden... 31
Comparisons between exposure in Sweden and effect levels ... 32
Conclusions... 34
References ... 40
Preface
During 2006 and 2007, the National Food Administration has been working with the scientific data for a revision of the dietary advice on fish containing high concentrations of methyl mercury (MeHg) and persistent halogenated and organic environmental pollutants. This report summarises current knowledge on
concentrations of MeHg in consumption fish. It also describes the exposure to which the Swedish consumer is subjected and the epidemiological studies that have been carried out on various population groups in the world. The most important risk assessments are also summarised. Finally, the exposure of the Swedish population is compared against the various risk levels that have been produced in the risk assessments.
The National Food Administration’s advice on fish consumption has so far been based on separate nutritional and toxicological evaluations. However, in the revision of the advice as regards polluted fish, a health-based risk-benefit analysis of such consumption will be carried out before the revised advice is formulated. Knowledge of the beneficial aspects of fish consumption have been summarised within the project "Risk-Benefit Analysis of Fish Consumption".
Many experts, both within the National Food Administration and externally, contributed to the content of this report. We would like to express particular gratitude to the participants in the National Food Administration’s expert meeting "Environmental pollutants in fish - a health risk?", which was held at the end of March 2006. Particularly warm thanks also go to Professor Staffan Skerfving, University of Lund, who examined the scientific basis of the relationship between exposure to methyl mercury and the risk of cardiovascular disease.
The project group comprised Emma Ankarberg (F/TO), Marie Aune (F/K2), Gabriela Concha (F/TO) Per Ola Darnerud (F/TO), Anders Glynn (project leader, F/TO), Sanna Lignell (F/TO), Kierstin Peterson-Grawé (F/TO) and Anna
Introduction
Mercury is a metal that occurs naturally in the environment, but humans have considerably increased the amount of mercury in circulation. In soil, water and sediment, inorganic mercury is converted to methyl mercury (MeHg). In the middle of the 1960s, high mercury concentrations were found in fish caught in Sweden in areas of water situated downstream from sources of emission of mercury compounds to water. To prevent fish with high concentrations of methyl mercury being sold commercially, blacklisting of certain waters with high
concentrations was introduced in 1967. This blacklisting included a ban on the sale or transfer of fish from these waters. In the 1960s, bans on the use of mercury within the paper pulp industry began to be introduced. In 1996, a ban on mercury dipping of seed was also introduced.
It has been estimated that the mercury concentration in a one-kilo pike exceeds 1 mg/kg in approx. 10 000 inland lakes in Sweden, which bears witness to the fact that the decline in mercury concentrations in fish proceeds very slowly. In 1991 blacklisting of lakes and water courses in Sweden ceased, while in the same year the maximum level for mercury in fish was lowered from 1 mg/kg to 0.5 mg/kg, although with certain fish species excepted (for example pike and eel).
A number of metals are mentioned in the national environmental targets, in
particular within a Toxin-free Environment. The environmental target requires e.g. that the concentration of MeHg in nature be near the background concentrations, which means that the concentration in fish should be 0.2 mg/kg or up to 0.5 mg/kg for certain nutrient-poor forest lakes.
As early as 1967, the authorities introduced dietary advice on consumption of certain fish that could contain high concentrations of mercury. According to these recommendations, fish with mercury concentrations between 0.2-1.0 mg/kg should not be eaten more than once a week. The dietary advice on fish that can contain high concentrations of mercury has since been revised a number of times, and has become increasingly clear in terms of recommendations that women who are pregnant, breastfeeding or planning to have a baby should avoid certain fish that can have high concentrations of methyl mercury (pike, perch, pike-perch, burbot, eel and giant halibut).
Concentrations in food
Fish
The major source of exposure to methyl mercury (MeHg) is fish. The majority of the mercury in fish, 75-100 %, occurs as MeHg and the remainder as inorganic Hg [1-3]. Usually, the concentration of total-mercury (total-Hg) is measured in fish muscle, while in calculations of exposure to Hg a common assumption is that 100 % of total-Hg in fish consists of MeHg. The mercury concentration varies greatly in indigenous fish species that are particularly interesting for calculation of mercury exposure and depends e.g. on catch site [4]. Fish in nutrient-poor forest lakes have higher mercury concentration than fish in nutrient-rich plains lakes. Other factors that affect the mercury concentration include e.g. the amount of mercury in circulation and a range of chemical, physical and biological factors in the water area [4]. In Skåne, for example, it is reported that the mercury
concentration in pike varies at least 10-fold between lakes, from <0.1 mg/kg to over 1 mg/kg in one-kilo pike [5]. Predatory fish have higher Hg concentrations than other species, but the concentration also increases with fish size. For Swedish conditions, it is pike, pike-perch, perch, burbot and eel in particular that can accumulate MeHg, but other species can also exhibit elevated Hg concentrations depending on catch site, e.g. salmonids caught in Lakes Vänern and Vättern [6, 7]. The concentrations of Hg in fish in inland waters are generally markedly elevated as a result of emissions of Hg to air and long distance spread. Local emissions of Hg also affect the Hg concentrations in fish, which can be seen e.g. in the north of Lake Vänern [8]. Coastal pike in areas without local influences have relatively low Hg concentrations [9].
As a basis for review of the dietary advice, the National Food Administration in collaboration with the Swedish Board of Fisheries and the Environmental Protection Agency has mapped the Hg concentrations in consumption fish. Sampling within the framework of the National Food Administration’s monitoring activities is not carried out at national level, with the exception of certain checks at border stations. A small number of samples were taken in retail outlets on behalf of the National Food Administration in this mapping project. A summary of the mercury concentrations in consumption fish used in intake calculations carried out at the National Food Administration is shown in Table 1.
Table 1. Mercury concentrations in consumption fish. Revised table from [13].
Fish species Catch site (n) Hg conc. mg/kg fresh
wt. (mean)
Sampling yr Reference
Perch Coast-caught (39)
Lake Vättern (5) 0.24 0.32 2001-2002 National Food Administration Pike Coast-caught, Norrland coast
Lake Vänern 0.22 0.46 1999 1996/97 [9] [6] Pike-perch Coast-caught (27)
Lake Mälaren 0.11 0.23 2001-2002 2001 National Food Administration [14]
Burbot Coast-caught (30)
Lakes Vättern and Vänern (15) 0.25 0.6 2001-2002 2001-2002 National Food Administration Salmon Farmed Norwegian, bought in
Swedish shops (10) Norrland rivers (30) River Mörrumsån (10) Baltic salmon Lake Vänern (20) Lake Vättern (20) 0.02 0.09 0.06 0.09 0.26 0.29 2001-2002 2001-2002 2001-2002 2001-2002 2001-2002 2001-2002 National Food Administration
Mackerel West coast (20) 0.03 2001-2002 National Food Administration Char Northern Lake Vättern (3) 0.34 2001 National Food
Administration Plaice Skagerack (20) 0.04 2001 National Food
Administration North sea
herring
Southern Norway 0.03 1995-1996 [15]
Baltic herring Baltic Sea 0.03 2004 Finnish National Food Administration Tuna Fresh, bought in Swedish
shops (6)
Canned, bought in Swedish shops (14) 0.46 0.06 2001 2001 National Food Administration National Food Administration Cod Fladen 0.05 1979-2002 [12]
Eel Median value, inland lakes and coast (178)
0. 06 0.005-0.9
1994-2004 National Food Administration Trout Norrland rivers (30)
River Mörrumsån (10) Lake Vänern (20) Lake Vättern (20) 0.15 0.07 0.48 0.42 2000-2001 National Food Administration Crab Prawns Crayfish Mussels Ireland West coast West coast 0.14 0.04 0.03 0.02 1999-2002 National Food Administration
The mean concentration for the most common marine fish species consumed (for example cod, plaice, mackerel, farmed salmon) was < 0.05 mg/kg, while the mean concentration for some species that accumulate MeHg was in the range 0.2-0.5 mg/kg. This applies in the first instance to species such as pike, perch, pike-perch and burbot, but also trout, char and salmon from Lakes Vänern and Vättern. Note that eel, which is one of the species mentioned in the consumption-restricting dietary advice, has lower Hg concentrations than other fish species mentioned in the dietary advice. In 178 samples analysed, mainly samples from the year 2000 onwards, of eel from a total of 18 catch sites, the median concentration was 0.06 mg Hg/kg and the mean concentration 0.13 mg Hg/kg (SD 0.18; variation 0.005-0.9 mg Hg/kg). Approx. 5 % of the samples exceeded 0.5 mg Hg/kg and those eels were caught in Lakes Vänern and Bolmen, plus one sample from a large eel
caught in Kalmarsund. Other fish species that can contain high concentrations of Hg include certain marine predatory fish, for example halibut, certain species of tuna, swordfish, shark and ray, for which the mean concentrations have been reported to be in the range 0.7-1.8 mg/kg [3, 10, 11]. Canned tuna has lower Hg concentrations than the tuna that can be bought fresh or frozen. In a minor investigation at the National Food Administration, the median concentration was 0.06 mg/kg.
Studies on Hg concentrations in fish are also carried out by other actors (for example local or county authorities, water protection associations), often within the framework of the national and regional environmental monitoring programme. IVL Swedish Environmental Research Institute Ltd. is the database host for
reporting on the studies on Hg concentrations in fish that are carried out within the framework of national and regional environmental monitoring. Appendix 1 presents a summary of the mercury concentrations in pike and perch from 16 and 17 counties respectively, mainly during the 1990s and later. The data were obtained from the IVL database (mercury in Biota,
http://www.ivl.se/db/plsql/dvsb_hg$.startup) and from 11 county authorities. In each municipality, the mercury concentration in pike and perch from 10-20 lakes was analysed. This summary only provides an overview of the mercury situation in each county in total, and not in individual lakes. Information on concentrations in individual lakes can be found in the IVL database and at the respective
county/municipality. The summary shows that the concentrations vary greatly. The EU maximum level for Hg is frequently exceeded in the case of pike (1.0 mg/kg fresh weight), and sometimes exceeded in the case of perch (0.5 mg/kg fresh weight). The mean concentration in pike varies from 0.1 to 2.2 mg/kg (median concentration 0.1-1.6) and in perch from 0.1 to 1.1 mg/kg (median concentration 0.0-0.9). Exceedence of maximum levels in pike and perch vary between 2,7 and 100 %. The summary shows that continued mapping of the local mercury situation in the counties is important.
Since pike is one of the species encompassed by the consumption-restricting dietary advice, it is very important that more recent data are included in the supporting data. Pike was therefore sampled on behalf of the National Food Administration during the Swedish Board of Fisheries fishing tests in 2005. The Hg concentration was analysed in 68 samples of pike with mean weight 1.1 ± 0.9 mg/kg from a total of 27 different lakes in 16 counties. These lakes are included in various series of the environmental monitoring programme and include nine limed lakes. The mean concentration was 0.6 ± 0.4 mg Hg/kg, the median 0.5 mg Hg/kg, and the total variation 0.06-2.1 mg Hg/kg. These values were only somewhat lower when the limed lakes were removed from the calculations. The maximum level for commercial pike is 1.0 mg/kg and this was exceeded in 10 samples (15 %), while the Hg concentration in 25 of the samples (37 %) was in the range 0.5-1.0 mg/kg.
No general continuous temporal trend monitoring regarding the mercury concentration in consumption fish has been carried out. In the Environmental Protection Agency’s programme for environmental monitoring of freshwater, there are temporal trend data on mercury concentrations in pike from Storvindeln, perch from Skärgölen and Bälgsjön and char from Abiskojaure. The concentration in perch from Skärgölen increased by 5 % annually up to 2002, while no trends were observed in fish from the other lakes [12]. Fish are collected annually from 18 stations around Sweden, and this is going to be expanded to 30 stations.
Other foods
The contribution to MeHg exposure from other foods is estimated to be negligible, although a certain contribution can derive from fish meal in animal feed intended for pigs and poultry (Swedish Board of Agriculture, personal communication).
Cooking
Mercury is concentrated in protein-rich tissues such as muscles, liver and kidneys in fish [16]. During cooking, the Hg concentrations can become higher than in raw fish, since the relativeconcentration increases in cooked fish due to the loss of water and oils that occurs during cooking [17].
Exposure
Fish consumption
A compilation of existing data on fish consumption has been carried out recently [13] and in the National Food Administration’s ongoing project "Risk-Benefit Analysis of Fish Consumption". The following provides a summary of both of these reports.
Adults
According to the latest national dietary investigation Riksmaten 1997-98, consumption of fish and shellfish among adults amounts to an average of 30-35 g/d [18]. However, fish consumption increases with age, from an average of approx. 25 g fish per day in younger people (18-34 years) to approx. 45 g per day in older people (35-74 years). These figures were based on the results of 7-day recording (menu diaries) of food intake. Details of consumption frequency were also collected through surveys. On average, fish and shellfish were consumed 6.5 times per month. Approximately 73 % of individuals in the age range 17-49 years and somewhat more (81 %) in the age range 50-74 years reported that they ate at least one fish meal per week.
Cod and similar fish plus processed fish (fish fingers, fish balls) were consumed most, followed by other sea fish, shellfish and canned fish. Older people reported higher consumption of oily fish such as herring products, salmon and salmonids, than younger people, while younger people preferred lean fish and processed fish products, for example fish fingers and fish balls.
Approximately half of all subjects (51-59 %) reported that they never eat pike, pike-perch, burbot or perch. This group also included approx. 5 % who did not answer the question or who answered that they did not know. Just over one-third, 38-42 %, reported that they consume pike, pike-perch, burbot or perch a few times per year.
Approximately 2-3 % of all subjects reported that they ate pike, pike-perch, burbot or perch 1-3 times per month, while 1 % of older women and men ate eel 1-3 times per month.
While 3.3 % of men and 1.7 % of older women responded that they ate these fish species 1 time/week, 0.7 % and 1.1 % responded that they ate pike, pike-perch,
burbot and perch a few times per week, in other words they deviated from the dietary advice. For women of childbearing age, 1.1 % reported that they consumed these fish species 1 time/week. No women of childbearing age consumed these fish species more often than 1 time/week, which means that the people in this group follow the dietary advice.
Consumption of eel was somewhat less than for pike, pike-perch, burbot and perch. Approx. three-quarters of individuals responded that they never eat eel. Most of those who eat eel do so a few times per year (20-42 %), while approx. 1 % of the men and older women replied that they eat eel 1-3 times per month. In several Swedish studies, pregnant women reported a lower fish consumption than other adults; < 4-5.8 fish meals per month compared with 6.5 fish meals per month in Riksmaten [19-22].
In Swedish studies aimed at individuals who eat large amounts of fish (for
example sport anglers, professional fishermen and their families), 5-12 fish meals per month have been reported [23-28].
Consumption of self-caught fish
The survey Fishe 2005 [24, 29] indicates that of the approx. 1.8 million Swedes who fish, over 160 000 (9 %) of these individuals eat the fish they have caught at least 1 time/week, of which approx. 10 000 are women of fertile age. In total, this would correspond to approx. 1-2 % of the entire population eating self-caught fish at least 1 time/week. However, these figures are somewhat uncertain due to some skewedness in drop-out.
Among the population of Norrland, both in the interior and along the coast, and on the plains of Götaland and Svealand, it is common for people to eat large amounts of self-caught fish. Most women of fertile age who eat large amounts of this kind of fish can also be found in Norrland. Most catches by recreational anglers are made in small lakes and tarns and not in the great lakes or in sea areas. Perch and pike were the species caught to the absolute greatest extent.
Children and young people
In a nation-wide dietary investigation "Riksmaten – barn 2003" [30, 31] that included 590 four-year-olds, 889 children in school year 2 (8-9 years old) and 1016 children in school year 5 (11-12 years old), data on fish consumption have been collected. Freshwater fish (for example perch, pike, burbot, pike-perch) were seldom consumed. Twenty-six per cent of four-year-olds (148 of 574), 27 % of 8-9-year-olds (232 of 852) and 30 % of 11-12-year-olds (289 of 978) reported that
they consumed freshwater fish 1-4 times/year, while 66 % (4-year-olds), 59 % (8-9-year-olds) and 56 % (11-12-year-olds) never consumed freshwater fish. Fish fingers/fish balls and lean sea fish were the most frequently consumed types, with a mean daily consumption of 10 g (4-year-olds), 12 g (8-9-year-olds) and 14 g (11-12-year-olds). Approx. 20 % and 4.5 % of children reported that they eat fish fingers once and twice a week respectively. Between 11 and 18 % reported that they consume lean sea fish once a week. After fish fingers and lean sea fish, farmed salmon was the next most consumed fish type, with a mean daily consumption of between 2 and 3 g. The National Food Administration dietary recommendation to consume perch, pike, pike-perch and burbot at most once a week is followed by most children (girls and boys). Only 0.2 % of the 4-year-olds (1 of 574), 0.1 % of the 8-9-year-olds (1 of 852) and 0.4 % of the 11-12-year-olds (4 of 978) reported that they eat freshwater fish more than one time per week. A total of 245 17-year-olds in Uppsala and Trollhättan were involved in a study of the dietary habits of young people that was carried out in 1995/96 [32].
Approximately 95 % of these young people reported that they ate fish and the mean consumption was 4.4 times per month (min-max 0.2-14.2).
Intake calculations
Adults
An intake calculation for MeHg has recently been made based on the National Food Administration’s investigation of dietary habits Riksmaten [13]. Several scenarios were included in the calculations with different assumptions about Hg concentrations in fish. The median value for MeHg exposure in women of childbearing age (17-40 years) varied between 0.1-0.2 µg/kg body weight/week, depending on scenario. The highest exposure was observed in the worst-case scenario, where the pike consumed was assumed to have a mercury concentration of 1.0 mg/kg (i.e. corresponding to the maximum level), and the salmon a mercury concentration of 0.33 mg/kg, corresponding to measured concentrations in
salmonids from Lake Vänern/Vättern. For women in the age range 17-40 years who ate large amounts of fish (95th percentile), intake varied between 0.3-0.8 µg/kg body weight/week depending on scenario.
Children and young people
Calculations of MeHg intake in children [31] were carried out based on the National Food Administration’s investigation on children [30]. Exposure to mercury was assessed with the aid of questionnaires and concentration data from investigations carried out previously at the National Food Administration (Table 1). With the help of the questionnaires, where fish type and the estimated
consumption frequency during the past year were recorded, it was possible to estimate fish consumption. Consumption frequency was reported as one of the following options: Never, 1-4 times/year, 5-8 times/year, 9-12 times/year, 2-3 times/month, 1 time/week, 2 times/week or 3-6 times/week. Portion size was estimated with the help of the Food Formula, a folder with diagrammatic
illustrations of foods and photographs of portion sizes. Fish types/dishes included in the intake calculations were lean sea fish (for example cod, coley, haddock), fish fingers/fish balls (50 % fish), farmed salmon, wild salmon from the Baltic Sea, freshwater fish (for example pike, perch, pike-perch, burbot), flat fish (for example plaice, halibut, turbot), canned tuna, North Sea herring/mackerel,, Baltic herring, and shellfish.
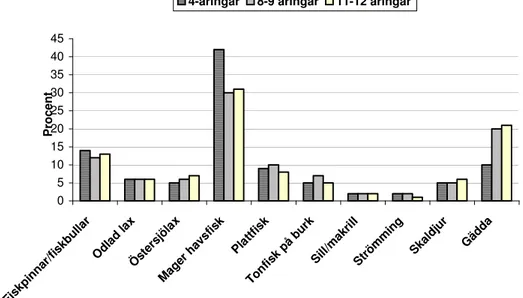
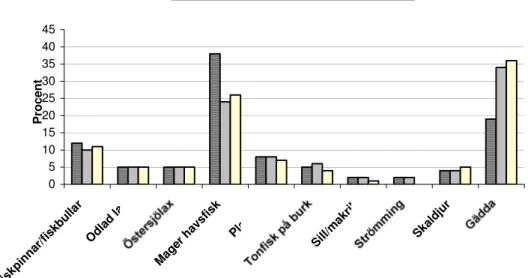
Since the Hg concentration in pike can vary greatly, the intake calculations were made according to two consumption options. In one of these(Figure 1b), the Hg concentration in pike with moderately elevated Hg concentrations (0.46 mg/kg fresh weight) caught in Lake Vänern was used for calculation of MeHg intake via fish (pike, perch, pike-perch, burbot). In the other option (Figure 1a), the Hg concentration in coastal pike with low Hg concentrations (0.22 mg/kg fresh weight) was used for calculation of MeHg intake via fish.
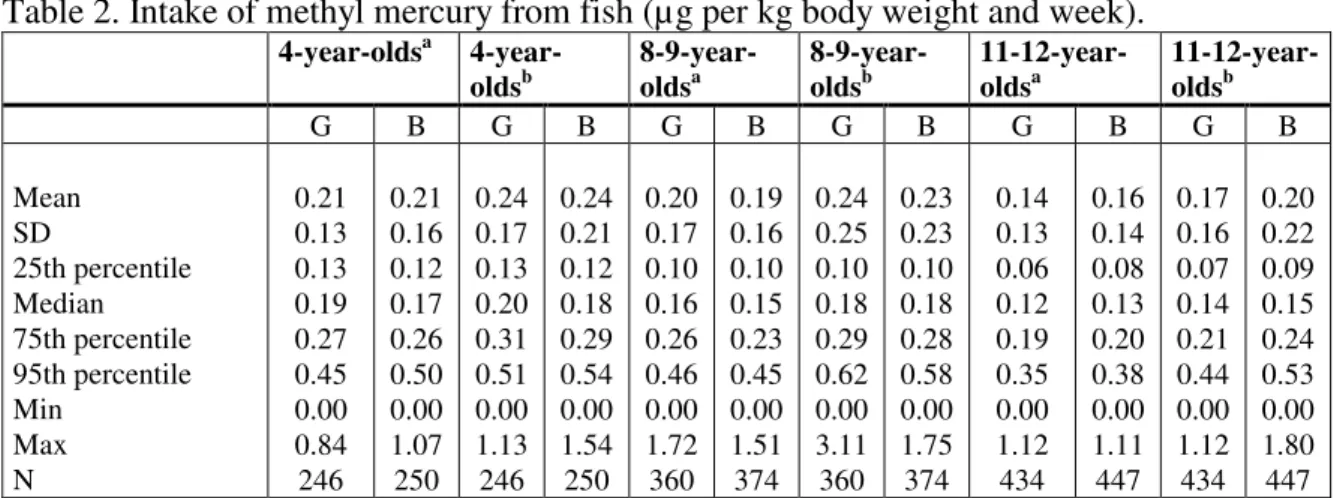
Median intake of MeHg per kg body weight was lower in the 11-12-year-olds compared with the 4-year-olds and 8-9-year-olds. Median intake among the 4- and 8-9-year-olds was 0.15-0.20 µg/kg body weight and week, while the 95th
percentile varied between 0.45 and 0.62 µg/kg body weight and week (Table 2). Among the 11-12-year-olds, the median intake of MeHg was 0.12-0.15 µg/kg body weight and week and the 95th percentile was 0.35-0.53 µg/kg body weight and week. The highest intake among children in all age groups was 0.84-3.1 µg/kg body weight and week (Table 2). No major differences were observed between boys and girls.
Since mean intake of MeHg from the respective fish type was calculated, it was found that the contribution from pike to the total MeHg intake was almost as great as the contribution from lean sea fish (10-36 % vs. 24-42 %; Figure 1 a,b). This was despite the fact that pike was one of the least consumed fish in all age groups (1.8-6.2 g/week). Consumption of lean sea fish, however, was almost as high (32-41 g/week) as consumption of fish fingers (35-56 g/week), but since fish fingers consist of approx. 50 % cod or similar fish the contribution to total MeHg intake was lower than that from lean sea fish (10-14 %). Median intake of mercury in the children was at the same level as in adults according to a similar study [13].
0 5 10 15 20 25 30 35 40 45 Fisk pinn ar/fi skbu llar Odla d la x Öste rsjö lax Mag er h avsf isk Plat tfisk Tonf isk på bur k Sill/ mak rill Strö mm ing Skal djur Gädd a P ro ce n t
4-åringar 8-9 åringar 11-12 åringar
Figure 1a. Percentage contribution to total Hg exposure from different fish types/dishes in the different age groups; 4-year-olds, 8-9-year olds, and 11-12-year-olds (based on mean intake of MeHg from the respective fish type; with consumption of coastal pike with a concentration of 0.22 mg/kg fresh weight). Note to Figure 1a:
Fiskpinnar/fiskbullar: fish fingers/fish balls Odlad lax: farmed salmon
Östersjölax: Baltic salmon
Mager havsfisk: lean fish or lean sea fish Plattfisk: flat fish
Tonfisk på burk: canned tuna Sill/makrill: herring/mackerel Strömming: Baltic herring Skaldjur: seafood
0 5 10 15 20 25 30 35 40 45 Fisk pinn ar/fi skbu llar Odla d la x Mag er h avsf isk Plat tfisk Sill/ mak rill Skal djur P ro ce n t
4-åringar 8-9 åringar 11-12 åringar
Figure 1b. Percentage contribution to total Hg exposure from different fish types/dishes in the different age groups; 4-year-olds, 8-9-year olds, and 11-12 year-olds (based on mean intake of MeHg from the respective fish type; with consumption of Lake Vänern pike with a concentration of 0.46 mg/kg fresh weight).
Note to Figure 1b:
Fiskpinnar/fiskbullar: fish fingers/fish balls Odlad lax: farmed salmon
Östersjölax: Baltic salmon
Mager havsfisk: lean fish or lean sea fish Plattfisk: flat fish
Tonfisk på burk: canned tuna Sill/makrill: herring/mackerel Strömming: Baltic herring Skaldjur: seafood
Table 2. Intake of methyl mercury from fish (µg per kg body weight and week).
aFor consumption of coastal pike with a concentration of 0.22 mg/kg fresh weight. bFor consumption of Lake Vänern pike with a concentration of 0.46 mg/kg fresh weight.
G=girl, B=boy.
Concentrations in the body
Established markers for MeHg exposure via fish consumption are Hg in red blood cells and hair, or MeHg in whole blood [33]. MeHg is predominantly bound to the haemoglobin in the red blood cells and the average half-life in humans is approx. 50 days, but half-life periods of up to 100 days have been reported [34]. The MeHg concentration in blood is therefore a measure of recent exposure, while the Hg concentration in hair can also provide information on exposure further back in time since Hg is incorporated into the hair as it grows. The ratio of
MeHg-concentration in blood to Hg MeHg-concentration in hair is generally reported to be 1:250, but the individual variation is very large (1:140-370). In most studies, the frequency of fish meals is positively correlated to the MeHg concentration in blood and hair. It is important to distinguish between different forms of Hg in exposure studies since exposure to inorganic Hg, e.g. via amalgam tooth fillings, results in an increased concentration of inorganic Hg in plasma [33]. Total concentration of Hg in whole blood of individuals who are not occupationally exposed to inorganic Hg therefore provides a measure of MeHg exposure via fish consumption and Hg exposure via dental amalgam.
Adults
The relationship between fish consumption and risk of heart attack was studied in a Swedish case control study that comprised 78 cases and 156 controls [35]. The Hg concentration in red blood cells of individuals who ate fish less than once a week was 3.3 ng Hg/g (80 % variation area 1.8-6.6 ng Hg/g), compared with 5.2 ng Hg/g (80 % variation area 2.1-10 ng Hg/g) in those who ate fish 1 time per
4-year-oldsa 4-year-oldsb 8-9-year-oldsa 8-9-year-oldsb 11-12-year-oldsa 11-12-year-oldsb G B G B G B G B G B G B Mean SD 25th percentile Median 75th percentile 95th percentile Min Max N 0.21 0.13 0.13 0.19 0.27 0.45 0.00 0.84 246 0.21 0.16 0.12 0.17 0.26 0.50 0.00 1.07 250 0.24 0.17 0.13 0.20 0.31 0.51 0.00 1.13 246 0.24 0.21 0.12 0.18 0.29 0.54 0.00 1.54 250 0.20 0.17 0.10 0.16 0.26 0.46 0.00 1.72 360 0.19 0.16 0.10 0.15 0.23 0.45 0.00 1.51 374 0.24 0.25 0.10 0.18 0.29 0.62 0.00 3.11 360 0.23 0.23 0.10 0.18 0.28 0.58 0.00 1.75 374 0.14 0.13 0.06 0.12 0.19 0.35 0.00 1.12 434 0.16 0.14 0.08 0.13 0.20 0.38 0.00 1.11 447 0.17 0.16 0.07 0.14 0.21 0.44 0.00 1.12 434 0.20 0.22 0.09 0.15 0.24 0.53 0.00 1.80 447
week or more . In individuals who reported that they had not eaten any fish in the past 2 years, the median concentration in blood was 0.10 µg MeHg/L (min-max 0-1.0 µg MeHg/L ) and T-Hg in hair was 0.06 µg/g (min-max 0.04-0.32 µg/g) [36].
Pregnant women
Several studies of exposure to MeHg in pregnant women in Sweden have been carried out during the period 1994-2004. Figure 2 shows a summary of the MeHg concentrations measured in blood. The median concentrations varied between 0.3-0.9 µg/L, and the highest MeHg concentrations recorded varied between 1.7-6.8 µg/L in the different studies.
The concentration was higher in umbilical cord blood than in maternal blood [37]. The median concentration of MeHg in umbilical cord blood was 1.4 µg/L (max 4.8 µg/L) for women in Solna 1994-96 [37], and 1.3 µg/L (min-max 0.10-5.7 µg/L) for women in Uppsala 1996-99 [38].
The Hg concentrations in the hair of pregnant women are shown in Figure 3. The median concentrations varied between 0.19-0.43 µg/g and the highest
concentrations in hair varied between 0.83-1.8 µg/g in the different studies. In a study from 1989-1991, the concentration in hair of pregnant women was on average 0.27 µg/g (min-max 0.07-0.96 µg/g) [39], i.e. at the same level as in the later studies.
Figure 2. MeHg concentration in the blood of pregnant women from Solna 1994-96 [37], the west coast (Västkusten) 2001-02 [19], Skåne 2002-03 [20] and Västerbotten 2003-04 [21]. The bars show the median value and the lowest and highest concentrations recorded.
0 2 4 6 8
Solna Västkusten Skåne Västerbotten
B -M eH g , µ g /L
Figure 3. Hg concentration in the hair of pregnant women from Uppsala 1996-99 [38], Västkusten 2001-02 [19], Skåne 2002-03 [20] and Västerbotten 2003-04 [21]. The bars show the median value and the lowest and highest concentrations recorded.
High consumers of fish
High consumers of fish, professional fishermen and individuals who eat large amounts of fish from contaminated waters have a higher average Hg load than the average fish consumer in Sweden (Figure 4). It is important to notethat the variation in MeHg exposure is considerable in these groups. In women who reported high consumption of fish the median concentration of MeHg in blood was 1.7 µg/L (min-max 0.30-14 µg/L) [40], while in women with high
consumption of fish from Lake Vättern the blood concentration was 7.9 µg/L (min-max 0.9-31 µg/L) [23], and in older sport anglers with high consumption of fish it was 8.6 µg/L (min-max 4.4-24 µg/L) [26]. In professional fishermen the median concentration in blood was 4.3 µg/L [28].
0 0,5 1 1,5 2
Uppsala Västkusten Skåne Västerbotten
H -H g µ g /g
Figure 4. MeHg concentration in the blood of groups of individuals who eat large amounts of fish [40], [23], [26], [28]. The bars show the median value and the lowest and highest concentrations recorded.
Note to Figure 4:
kvinnor. storkonsumenter: women, high consumers kvinnor. Vättern: women, Vättern
män.sportfiskare: men, sport anglers
män.yrkesfiskare: men, professional fishermen
The median concentration in the hair of women who ate fish 8 times per month was 0.7 µg/g (variation 0.08-6.6 µg/g) [41]. The median concentration of Hg in the hair of sport anglers with connections to Värmland was 0.9 µg/g (min-max 0.1-18.5 µg/g), while the median value for concentration in hair in those who reported consumption of freshwater fish at least once a week was 1.8 µg/g [25]. The average Hg concentration in fish in the area was 0.7 mg/kg. The calculated median value for Hg concentration in the hair of women who ate large amounts of fish from Lake Vättern was approx. 2 µg/g, based on MeHg concentration in blood and a blood/hair ratio of 1:250 [23]. In an investigation from 1985, the Hg concentration in hair in individuals with high consumption of freshwater fish was on average 3.2 ± 2.3 (SD) (min-max 0.3-10.8 µg/g) [42]. 0 10 20 30 40 k v innor , s tor k ons um enter k v innor , V ätter n m än, s por tfi s k ar e m än, y rk es fi s k ar e B -M eH g , µ g /L
Children and young people
The average Hg concentration in blood in 245 Swedish 17-year-olds from Uppsala and Trollhättan, sampling years 1995/96, was 1.1 µg/L (min-max <0.7-5.8) [32]. No correlation was found between amalgam fillings and Hg concentration in blood, despite the fact that 39 % of these young people had such fillings.
Temporal trends
Blood samples collected from 600 randomly selected adult individuals (25-74 years) in Västerbotten and Norrbotten during the period 1990-1999 were analysed with respect to mercury [43]. The concentration of Hg in red blood cells was positively correlated to fish consumption, age and alcohol consumption. Linear regression showed an annual decrease in Hg concentration in the blood cells of men and women of 5.8 % (CI 4.4-7.0 %) after correction for age and fish
consumption. However, this decrease in Hg concentration could have been due to a lower concentration in locally caught fish or to a change in the type of fish eaten.
Effects in humans
The scientific documentation on the effects of MeHg in humans and in animal models is very extensive. Comprehensive reviews have been published in the international risk assessments carried out recently [44-47]. The following
describes the studies that have had the greatest significance for the final evaluation in the international risk assessments. For a more detailed description see the above-mentioned risk assessments. In Japan and Iraq, events occurred during the 1950s, 1960s and 1970s that led to a large number of people being affected by MeHg poisoning [48, 49]. The effects reported were in many cases very serious. In adults the symptoms appeared as damage to the central and peripheral nervous system. At lower exposure effects were also observed on the central nervous system of foetuses without any effects being observed in the pregnant women.
Effects of prenatal exposure on the central nervous
system
A lowest exposure level that did not cause effects on the central nervous system (CNS) of the foetus could not be established and it was considered important to identify such a level. Therefore, during the 1980s and 1990s a number of epidemiological studies were carried out world-wide on population groups that consume large amounts of fish and therefore have higher chronic exposure to MeHg than other population groups. Indications that increased prenatal exposure to MeHg leads to effects on neurological status (for example muscle reflexes, muscle tension, fine motor activity) have been observed in some studies [50-52], while others have not found any such correlation [53-55]. In neurophysiological studies of children on the Faroe Islands and Madeira, a correlation has been reported between increased MeHg exposure and depressed activity in the brain in response to visual or aural stimuli [56, 57]. However, it should be noted that measurement of depressed activity in the brain (so-called brain auditory evoked potential or visual evoked potential) is an area that is relatively unexplored. Nevertheless, an advantage with such parameters is that they are not affected by e.g. socioeconomic factors, as is the case with many neuropsychological empirical methods. Sight and hearing were not correlated to exposure to MeHg in children on the Faroe Islands [51], while indications of a slight hearing impairment effect were observed in a smaller study of children in Ecuador [58]. A correlation between early exposure to MeHg and delayed motor development (sitting,
while no such correlation has been reported in children in the Seychelles [60, 61] and in Peru [62].
The epidemiological studies that have had the greatest significance in the risk assessment of MeHg have been carried out in New Zealand, the Faroe Islands and the Seychelles. In New Zealand, development was compared in 74 children whose mothers had high exposure to MeHg (> 6 µg/g in hair) during pregnancy
(variation 6-86 µg/g, most in the concentration range 6-10 µg/g) and children who had lower prenatal exposure to MeHg [63]. At 4 years of age, the group with high prenatal MeHg exposure had worse test results in terms of motor, neurological and cognitive functions than the group with low prenatal MeHg exposure. At 6 years of age extensive tests were carried out on the children’s development but with more children in the control group than in the previous study [64]. The outcome varied somewhat depending on the choice of statistical method used for analysis, but in general a correlation was found between increased prenatal exposure to MeHg and impaired general cognitive and linguistic ability [64, 65]. However, the study in New Zealand has received criticism because e.g. it was not subjected to external scientific review and the number of mother-child pairs was small. In the Faroe Islands, a prospective study was carried out on 917 mother-child pairs, which were followed from birth of the babies in 1986-87 onwards [51]. Approximately half the women ate fish three times or more per week, mostly consisting of fish species with low concentrations of Hg. However, they often ate whale meat in particular and this can contain high concentrations of Hg, which had greater significance for MeHg exposure than consumption of fish [66]. They also ate whale blubber, which contains elevated concentrations of PCBs [67]. The Hg concentration in maternal hair at parturition was on average 4.3 µg/g, and the interquartile spread (25th–75th percentile) was 2.6-7.7 µg/g [51]. In 15 % of the mothers the Hg concentration in hair was < 10 µg/g, and the highest concentration recorded in hair was 351 µg/g. The concentration of MeHg in umbilical cord blood was used as a measure of foetal exposure, and the mean concentration in umbilical cord blood was 22.8 µg/L. At 7 years of age the neurophysiological function and neurological status of the children was measured, and also their cognitive abilities. A correlation was found between MeHg exposure and impaired test results in terms of concentration, language and memory, and also to a certain extent motor and visuospatial function. These differences remained when children whose mothers had a hair content over 10 µg Hg/g were excluded from the
calculations. A potential source of error in the study is that there was simultaneous exposure to PCBs in whale blubber, which could itself have affected the test results. However after correction for PCB exposure in approx. half the children studied, it was found that the statistical differences in test results between the groups with low and high MeHg exposure remained [68]. In a later analysis of the material it was concluded that MeHg is probably a more important factor in
explaining the central nervous system effects observed than PCB, but that
simultaneous PCB exposure could possibly enhance the MeHg-induced effects at high MeHg exposure, although it is emphasised that interpretation is difficult [69]. The effects of simultaneous exposure to MeHg and PCBs have also been studied in a group of 212 children in the USA [70]. The median Hg concentration in maternal hair during pregnancy was 0.50 µg/g, and in the American children a weak interaction was found between prenatal exposure to MeHg and PCB, but the relationship was difficult to interpret. Fish consumption was low, with those who ate large amounts of fish reporting on average 15 fish meals per year. The
interaction effects observed at 38 months of age were not observed at 54 months of age. Further studies are probably required to clarify any interactions between PCB and MeHg in prenatal exposure.
In a similar longitudinal study on the Seychelles group of islands, 779 mother-child pairs were monitored [71]. Approximately 85 % of the population on the Seychelles eat marine fish every day, and the women who took part in the study reported that they ate fish approx. 12 times per week. The median concentration of Hg in fish varied between 0.5-0.25 mg/kg depending on fish species. The
concentration of Hg in maternal hair during pregnancy was selected as a measure of exposure to MeHg, and the mean concentration was 6.8 µg/g ± 4.5 (variation 0.9-25.8 µg/g). This study was preceded by a pilot study that encompassed 804 children whose mothers had median Hg concentrations in hair of 6.6 µg/g during pregnancy [72]. The pilot study found that the results in a development test carried out between 1 and 25 months of age were more often abnormal or doubtful in children whose mothers had Hg concentrations in hair above 12 µg/g than in children whose mothers had lower Hg concentrations in hair [72]. At 9 years of age, 87 of the children from the pilot study were tested with regard to cognitive ability, vision and motor ability [73]. No negative relationship was observed between children’s cognitive ability/neurological function and prenatal MeHg-exposure, although there was a positive relationship in boys. In the so-called main study no correlation was found between prenatal exposure to MeHg and mental and psychomotor development in approx. 740-780 children at 6.5, 19 and 29 months of age [55, 74]. At approx. 5 years of age, 711 of the children were tested with regard to e.g. general cognitive ability, social behaviour, language,
mathematical and spatial ability [75]. No negative correlation was found between early exposure to MeHg and child development, but there was a positive
correlation between prenatal MeHg exposure and the results of language ability and problem solving, and in boys also spatial ability. At 9 years of age, 21 different parameters for development of the central nervous system in children were investigated [76]. Improved test results for hyperactivity index with
increasing prenatal MeHg exposure and a negative relationship with the outcome of one of the tests in boys were reported, but overall the results were deemed not
have recently been published [77]. No relationship was observed between prenatal MeHg-exposure and intelligence quotient, reading, mathematical ability, social behaviour and memory.
The results from a large number of animal studies on both rodents and primates also show that the effects on the central nervous system during development after prenatal or early postnatal exposure, similar to those observed in humans, are sensitive parameters.
Cardiovascular effects
The first publication reporting a correlation between MeHg-exposure and risk of heart attack/mortality came from Finland and was based on a cohort of 1833 men in eastern Finland [78]. Fish consumption was high, on average 46.5 g/day (min-max 0-619 g/day) and some of the most common fish species were vendace, rainbow trout, pike and perch. The Hg concentration in hair was on average 1.92 (min-max 0-15.67 µg/g) and was correlated to fish consumption. Individuals who ate >30 g fish per day had a risk ratio (RR) for heart attack of 1.87 (CI 1.13-3.09) compared with individuals with lower fish consumption, and similarly the risk of heart attack was significantly elevated in those who had a Hg concentration in hair > 2 µg/g compared with those with < 2 µg/g (RR 1.69; CI 1.03-2.76). Mortality from heart attack and total mortality were also correlated to Hg concentration in hair. Two follow-up studies were later carried out on the cohort. These
investigated the relationship between serum concentrations of n-3-fatty acids and morbidity in heart disease (197 cases of ‘coronary events’ according to the authors) [79]. In the group that had the 20 % highest serum concentrations of n-3-fatty acids, the risk of contracting disease was significantly lower (47 %) than in those who had the 20 % lowest serum concentrations of the fatty acids
docosahexaenoic acid (DHA) and docosapentaenoic acid (DPA). In the one-third who had a Hg concentration in hair that exceeded >2 µg/g there was no clear protective effect of the n-3-fatty acids. However in the others the relationship between serum concentrations of n-3-fatty acids and the risk of heart disease was dose-related, with a protective effect with increasing serum concentrations. In a later follow-up study [80] similar results were reported. In total, 282 cases of acute coronary events being contracted were included in the study. The risk of
contracting the disease was 1.07 (CI 0.77-1.49) in the one-third whose Hg
concentrations in hair were in the range 0.84-2.03 µg/g compared with the risk in those with the lowest Hg concentrations in hair (< 0.84 µg/g). The one-third who had Hg concentrations in hair > 2.03 µg/g had a risk of 1.66 (CI 1.20-2.29) of contracting the disease. At Hg concentrations in hair < 2.03 µg/g a decreased risk of contracting the disease was found with increasing serum concentrations of
DHA+DPA (RR=0.69; CI 0.52-0.91), while no such correlation was observed at Hg concentrations in hair > 2.03 µg/g.
A Swedish prospective case-control study investigated the relationships between fish consumption, MeHg exposure and plasma levels of long-chain
polyunsaturated fatty acids (P-PUFA), and the risk of suffering an acute heart attack [35]. The study included 78 cases and 156 matched controls. Those who ate fish less than once a week had a median Hg concentration in red blood cells (Ery-Hg) of 3.3 ng/g, while those who ate fish once a week or more often had a median value of 5.2 ng/g. Compared with the risk of morbidity in those who had Ery-Hg < 3 ng/g, the risk was 0.91 (CI 0.49-1.69) in those who had Ery-Hg 3-6 ng/g, while it was 0.43 (CI 0.19-0.95) for Ery-Hg > 6 ng/g. Ery-Hg and P-PUFA co-varied. A strong positive correlation was found between both P-PUFA and MeHg exposure and decreasing risk of suffering acute heart attack.
In a cross-sectional study of men who had suffered a heart attack and matched controls from several countries in Europe (Sweden not included), a correlation was found between Hg concentration in nails (N-Hg) and concentration of DHA in fatty tissue biopsies [81]. The risk of acute heart attack increased with
increasing N-Hg, and decreased with increasing fatty tissue DHA.
A prospective study of 1014 men from eastern Finland found a significant relationship between thickening of the carotid artery over a 4-year period (a measure of progressive arteriosclerosis) and Hg concentration in hair [82]. The effect was observed in the group that had Hg concentrations in hair of > 2.81 µg/g compared with others. The Hg concentration in hair was on average 1.8 µg/g and the highest concentration 23.3 µg/g.
Effects on blood pressure have been reported in a study of 917 seven-year-old children from the Faroe Islands who were exposed to MeHg to varying degrees during the foetal stage [83]. The Hg concentration in umbilical cord blood was on average 31.77 µg/L (SD 29.02; min-max approx. 1-300 µg/L). Systolic and diastolic blood pressure increased by 14.6 and 13.9 mm Hg, respectively, when the Hg concentration in umbilical cord blood increased from 1 to 10 µg/L, i.e. in those with the lowest exposure levels; the effect was strongest in children with a birth weight < 3700 gram. No such effect was observed at higher exposure levels. The Hg concentration in maternal hair at parturition was also correlated to
increasing blood pressure, but not as strongly as the Hg concentration in umbilical cord blood. In Swedish studies no relationship has been observed between MeHg exposure and blood pressure [35]. Cardiac rhythm variability at 7 years of age was also correlated to prenatal MeHg exposure and Hg concentration in hair at 7 years of age in children on the Faroe Islands [83]. At 14 years of age a similar
exposure [57, 84]. These changes were considered to be an effect of changes to the brain stem.
Epidemiological data indicate that there is a relationship between high MeHg exposure and increased risk of acute heart attack, but the conclusions regarding the shape of the dose-response curve are partly uncertain. However, the Finnish studies indicate the risk of contracting cardiovascular disease can increase if the Hg concentration in hair exceeds 2 µg/g. In the Swedish studies that have been carried out no such relationship has been found, and this can probably be
explained by the MeHg exposure having been considerably lower compared with e.g. that in the Finnish studies. On the contrary, the Swedish studies have found a positive relationship between MeHg exposure and decreasing risk of heart attack. This can be interpreted as the protective effect of the long-chain polyunsaturated fatty acids (and possibly also selenium) dominating up to a certain intake level after which the MeHg-induced negative effects take over.
There is extremely limited data support for evaluating whether a relationship exists between MeHg and stroke. Swedish data, based on a study population with low MeHg-exposure, do not indicate any positive relationship between MeHg and the risk of stroke. There are certain indications that exposure to MeHg during the foetal stage or childhood is correlated to increased blood pressure and minor changes in cardiac rhythm variability. The significance of these findings is
unclear, but could be related to incidence of acute heart attack. In Swedish studies on adults no such relationship between exposure to MeHg and blood pressure was observed, but the exposure levels were low. More studies are needed to clarify this.
Immune system
Studies on humans
Knowledge of effects of exposure to methyl mercury on the immune system in humans is very limited. In a study of neonates in Quebec who had been exposed prenatally to both PCBs and MeHg, changes were found in the composition of T-, B- and NK-cells in umbilical cord blood and in cytokine response [85, 86].
Animal studies and in vitro models
The effects of MeHg on the immune system have been studied in a number of in vivo studies on rats and mice and in in vitro experiments. These studies vary in design and in the immunological parameters studied. It was not possible in any of the in vivo studies to identify a NOAEL (no observed adverse effect level), i.e. a dose at which no effects could be observed, while otherwise only one dose was
used. The effects reported after exposure of adult animals to MeHg include decreased thymus weight, reduced NK-cell activity, decreased resistance to virus infection, changes in the composition of T- and B-cells, and changes in mitogen response and autoimmunity [87-93]. Effects on development of the immune system from exposure to MeHg during the foetal period or immediately after birth have also been reported in some studies. Effects on thymus and spleen weight, changes in number of lymphocytes in the blood, NK-cell activity, mitogen response and composition of T- and B-cells have been reported [88, 94, 95]. Altered levels of essential trace elements such as iron, calcium, manganese and zinc have also been observed in mice exposed to MeHg in a virus infection model [96]. The sensitivity of the immunological response varies between different strains of mice, which could perhaps be explained by differences between
different strains in demethylation of methyl mercury to inorganic mercury, which then affects the immunological system [97]. The studies on rodents that have been reported show that MeHg has the potential to affect the immune system in adults and foetuses. However these studies do not provide an unequivocal answer
regarding the most sensitive immunological parameters, or regarding the direction in which MeHg influences the respective parameters. The extent to which MeHg exerts effects on the immune system at lower exposure levels and also the highest exposure level that does not give rise to effects are still unclear.
Risk assessments
Up until 2003, the provisional tolerable weekly intake (PTWI) for MeHg was set at 3.3 µg/kg body weight and week by the Joint FAO/WHO Expert Committee on Food Additives and Contaminants (JECFA) [45]. This assessment was based on neurotoxic effects in adults but it was considered that PTWI was not regarded as protecting pregnant women (i.e. the foetus) from effects. Based on new
epidemiological studies from the Faroe Islands and the Seychelles on the effects on child development, JECFA has revised its risk assessment and now specifies a PTWI of 1.6 µg/kg body weight and week [46]. At this exposure level pregnant women and their foetuses are considered not to be at risk of any neurotoxic effects. In 2000, the American National Research Council (NRC)carried out an assessment of the risks of effects from exposure during the foetal stage based on the study from the Faroe Islands [44], which resulted in a reference dose (RfD) of 0.1 µg/body weight/day, which is equivalent to 0.7 µg/kg body weight and week. The assessments by NRC and JECFA thus resulted in highest tolerable exposure levels of 0.7 and 1.6 µg/kg body weight and week respectively, which corresponds to a mercury concentration in hair of 1.2 and 2.2 µg/g respectively, and in blood of 4.8 and 8.8 µg/L respectively.
PTWI and RfD are stated as amount of MeHg/kg body weight, but are based on epidemiological studies in which the measure of exposure was Hg concentration in hair or umbilical cord blood. To convert from concentration in hair or blood, a kinetic formula has been used, which means that a range of assumptions have been made [44, 46]:
d = C × b × V / (A × f × bw) where:
C = concentration of mercury in blood (µg/L), poss. via conversion of hair/blood ratio
b = elimination constant (0.014/day) V = blood volume
A = dose absorbed (0.95)
f = fraction of dose absorbed distributed in blood (0.05) bw = body weight
d = dose (µg/day)
The PTWI produced by JECFA has been calculated on the basis of the exposure level at which effects were not observed in the Seychelles and Faroe Islands
studies. On the Seychelles, no effects were observed in children at a maternal hair concentration of 15.3 µg/g during pregnancy in the group with the highest
exposure level [75], while the study on the Faroe Islands reported a so-called benchmark dose1 (BMDL) of 12 µg/g [44, 98]. The mean value of these two studies is 14 µg/g, which has been used in calculation of PTWI [46].
NRC has calculated separate BMDLs for the Seychelles and Faroe Islands and a study from New Zealand, plus an integrated BMDL for all three studies, but elected to base the RfD on the Faroe Islands study alone (BMDL 12 µg/g) [44]. The fact that different assessments have arrived at different conclusions on the tolerable level is mainly due to a use of different uncertainty factors. NRC has applied an uncertainty factor of 10 in total, in order to take account of variation in kinetics between individuals and the indications of cardiovascular-related,
immunotoxicological and late neurological effects. JECFA on the other hand has used a safety factor of 2 for variation in hair/blood ratio between individuals and a factor of 3.2 for other variation in kinetics between individuals, i.e. a total
uncertainty factor of 6.4.
During 2006, JECFA investigated whether the current PTWI should include others in the population in addition to pregnant women, i.e. children and the elderly. For adult individuals apart from women of childbearing age, it has been estimated that exposure can be in the order of twice PTWI without any danger of health effects arising [47]. For children up to around 17 years of age, it is assumed that
sensitivity is not greater than in the foetus but the possibility cannot be ruled out that the sensitivity is greater than in adults and therefore a PTWI of 1.6 µg/kg body weight and week is recommended for this age group.
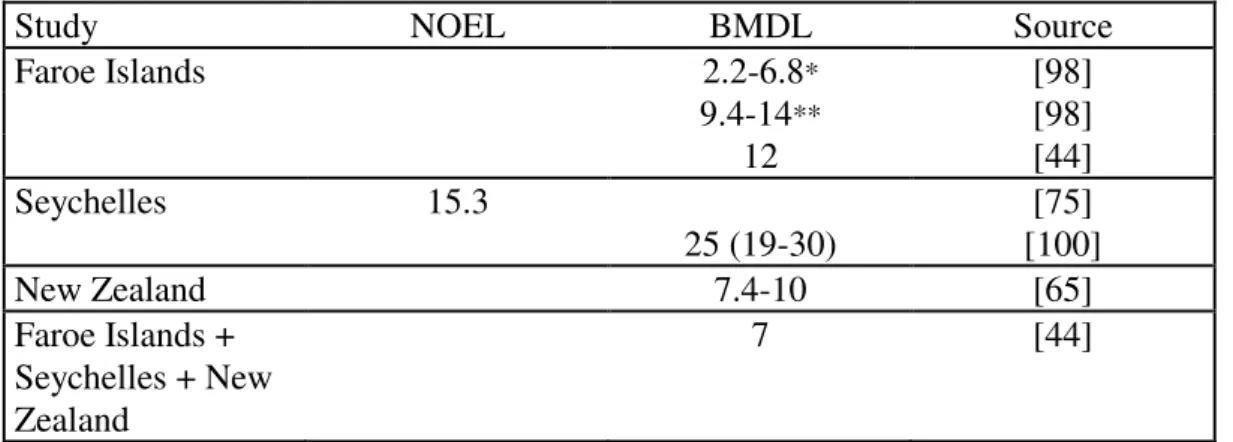
Table 3 shows NOEL and BMDL values for the three studies in the Faroe Islands, Seychelles and New Zealand based on Hg concentration in maternal hair during pregnancy. The researchers who carried out the study on the Faroe Islands have reported benchmark calculations on their data and determined a lowest BMDL at a Hg concentration of ~5 µg/L in umbilical cord blood, which corresponded to a T-Hg concentration in maternal hair of ~1 µg/g [98]. The BMDL varied between 1.6–12.7 µg Hg/L in umbilical cord blood for five different test parameters (e.g. motor ability, concentration, language) on assumption of a logarithmic dose-response model. With the starting point of concentrations measured in hair, the BMDL is instead 2.2-6.8 µg/g on assumption of a logarithmic dose-response model and 9.4-14 µg/g on assumption of a linear dose-response model.
The authors point out that the BMDL varies depending on the dose-response model used in the analysis. In the NRC assessment a different dose-response model (linear) was assumed for the Faroe Islands study, which resulted in a representative BMDL for a Hg concentration in hair of 12 µg/g [44]. The choice of dose-response model and other assumptions made that were important for the outcome, has been discussed [44, 99].
Table 3. Summary of NOEL and BMDL in the most important epidemiological studies of the relationship between prenatal exposure to MeHg and effects on the CNS during childhood. The measure of exposure is maternal Hg concentration in hair (µg/g) during pregnancy.
Study NOEL BMDL Source Faroe Islands 2.2-6.8* [98] 9.4-14** [98] 12 [44] Seychelles 15.3 [75] 25 (19-30) [100] New Zealand 7.4-10 [65] Faroe Islands + Seychelles + New Zealand 7 [44]
Note: the BMDL corresponds to a 5 % response (BMDL05), except for the Seychelles study where
the BMDL corresponds to a 10 % response (BMDL10).
* logarithmic dose-response. ** linear dose-response.
Risk characterisation
The risk assessment from NRC [44] and that from JECFA [46] report tolerable intakes that differ by a factor of 2.3. The difference consists of the assumptions regarding uncertainty and variability made by both expert committees in their assessments. With the uncertainties occurring in these assessments, it is not unreasonable to assume that the tolerable intake lies somewhere in the range between the PTWI and the RfD. Therefore in the risk characterisation below, comparisons are made of exposure against both PTWI and RfD.
Comparisons between intake/exposure and tolerable
intake
The most sensitive group in the population is pregnant women, due to the greater sensitivity of effects in the foetus. In the latest investigations of exposure in a random selection of pregnant women in Sweden, the blood and hair
concentrations corresponding to the JECFA PTWI value of 1.6 µg/kg body weight/week were not exceeded, while 0-4 % exceeded the American reference dose of 0.7 µg/kg body weight/week. When this is translated to the entire population, according to the calculations there may be up to approx. 2400-8500 pregnant women/year who exceed the reference dose somewhat [19]. Theoretical calculations of intake indicate that the JECFA PTWI value can be exceeded by pregnant women with high consumption of fish with elevated concentrations of MeHg [13].
On the basis of the JECFA and NRC assessments, it is not likely that any negative effects will arise in the foetus at these actual exposure levels, but the safety margin is smaller for those with higher MeHg exposure.
For men and older women, PTWI can be exceeded by a factor of 2 according to the JECFA assessment. In targeted studies of exposure in high consumers of fish the average exposure has been below such a level, but the individual variation is very great and some cases of PTWI being exceeded have been reported. No supporting data are available for establishing how frequently it is exceeded at present. In theoretical calculations, a value twice the PTWI is exceeded by 0-0.3 % of men and older women [13]. For the vast majority of men and older women the MeHg exposure is at a safe level.
Calculations based on the National Food Administration study on children indicate that 0.5-3 % and 0.1-0.4 % of children in the ages 4, 8-9 and 11-12 years can exceed the American reference dose and the JECFA PTWI. This can occur in children who eat fish daily, 40-150 g, or who regularly eat pike or other fish with elevated MeHg concentrationsseveral times a week.
Comparison between exposure on the Faroe Islands and
in Sweden
The study from the Faroe Islands is the most complete study that reports the relationship between prenatal exposure to MeHg and effects on development of the nervous system. It can therefore be interesting to compare the exposure levels in Sweden with those reported from the Faroe Islands. Table 4 shows the Hg concentrations in umbilical cord blood in pregnant women on the Faroe Islands [101] and in Sweden [38]. The concentrations are approx. 20 times lower in the Swedish women compared with the concentrations in the women from the Faroe Islands. Table 5 presents the Hg concentrations in the hair of pregnant women on the Faroe Islands [38, 101] and in Sweden [38], and those in high consumers of fish [41]. The average Hg concentrations in hair are 10-20 times lower in pregnant women in Sweden compared with the Faroe Islands. Women in Sweden who eat large amounts of fish or fish with high mercury concentrations have on average approx. 2-6 times lower Hg concentration in hair than women on the Faroe Islands.
Table 4. Comparison between reported MeHg concentrations in umbilical cord blood from women on the Faroe Islands 1986-1987 [102] and Sweden 1996-1999 [38]. MeHg in umbilical cord blood (µg/L) Pregnant women, Faroe Islands Pregnant women, Sweden 25th percentile 13.4 Median 22.9 1.3 75th percentile 41.3 Max 351 5.7
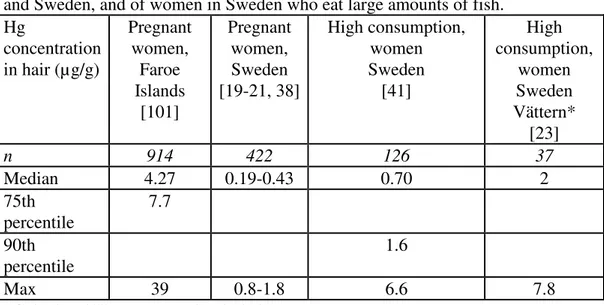
Table 5. Mercury concentration in hair of pregnant women in the Faroe Islands and Sweden, and of women in Sweden who eat large amounts of fish.
Hg concentration in hair (µg/g) Pregnant women, Faroe Islands [101] Pregnant women, Sweden [19-21, 38] High consumption, women Sweden [41] High consumption, women Sweden Vättern* [23] n 914 422 126 37 Median 4.27 0.19-0.43 0.70 2 75th percentile 7.7 90th percentile 1.6 Max 39 0.8-1.8 6.6 7.8 *Calculated Hg concentration in hair.
Comparisons between exposure in Sweden and effect
levels
From the three studies in New Zealand, the Faroe Islands and the Seychelles, several benchmark doses have been calculated (Table 3). The BMDL varies between studies and also depending on the dose-response model used. The lowest BMDL values reported from the Faroe Islands are in the range 2.2-6.8 µg/g in maternal hair, as well as the NRC’s combined BMDL of 7 µg/g for all three studies. The NRC assessment was based on a BMDL of 12 µg/g in maternal hair based only on the Faroe Islands study. The highest BMDL of 25 µg/g in maternal hair is based on the Seychelles study. Comparing the average Hg concentrations (0.19-0.43 µg/g; Table 5) reported in recent studies on pregnant Swedish women, the margin to the BMDL is 5- to 36-fold based on the most conservative
modelling of data from the Faroe Islands study. With a different assumption of the dose-response model according to NRC, the margin is 27-63-fold between
exposure in pregnant women in Sweden and the BMDL based on data from the Faroe Islands. The margin to the BMDL from the Seychelles study is in the range 58-130-fold.
Table 6. Margin between the BMDL, based on the Faroe Islands and Seychelles studies, and average exposure in pregnant women in Sweden. Data taken from Tables 3 and 5. Hg in hair (µg/g) Pregnant women, Sweden* BMDL** Margin Median 0.19-0.43 2.2-6.8 5-36 12 27-63 25 58-130
*see Table 5 for references to the exposure studies. **see Table 3 for references to BMDL.
The limited data that are available on exposure in women in Sweden who eat large amounts of fish indicate that there may be groups that lie close to or at the level of the most conservative BMDLs.
The average Hg concentrations in hair reported in recently performed Swedish studies targeting high consumers of fish with elevated concentrations [23, 25] lie close to the level in the Finnish studies in which a correlation has been observed between exposure to MeHg and morbidity from heart attack [79, 80, 103]. The supporting data are very limited but the possibility cannot be excluded that there are groups in the Swedish population with high consumption of fish with elevated Hg concentrations who have such a high MeHg intake that the risk of MeHg-induced cardiovascular disease may be elevated. It is currently not possible to quantify the size of this group, but it is probably limited to those who very frequently eat self-caught fish with elevated MeHg concentrations.
Against the background of these studies and the calculations of MeHg exposure that have been made, it can be concluded that under Swedish conditions there is a certain risk of elevated intake of MeHg if the consumption pattern is altered in favour of fish with higher concentrations of MeHg.
Conclusions
Concentrations in fish
The major source of exposure to methyl mercury (MeHg) is fish. Mercury in fish occurs mainly, 75-100 %, as MeHg and the remainder as inorganic Hg. The mercury concentration varies greatly in the domestic fish species that are of particular interest for calculation of mercury exposure and depends e.g. on catch site. Fish in nutrient-poor forest lakes have higher mercury concentrations than fish in nutrient-rich plains lakes. Predatory fish have higher Hg concentrations than other fish species, but the concentration also increases with fish size. For Swedish conditions, it is primarily pike, pike-perch, perch, burbot and eel that can accumulate MeHg, but other species can also exhibit elevated Hg concentrations depending on catch site, for example salmonids caught in Lakes Vänern and Vättern. The concentrations of Hg in fish in inland waters are generally markedly elevated as a result of emissions of Hg to the air and long-distance transport. Local emissions of Hg also affect the Hg concentrations in fish, as can be seen e.g. in northern parts of Lake Vänern. Coastal pike in areas without local influences have relatively low Hg concentrations.
Exposure
Current exposure
Around 2-3 % of the adult population report that they eat pike, perch, pike-perch or burbot 1-3 times per month. Further, 1-3 % state that they eat such fish once a week, while 1 % of men and older women each such fish a few times per week. Others eat such fish never or only a few times per year.
Among children, 1-2.7 % and 0.1 % (4-12 year-olds) report that they eat pike, perch, pike-perch or burbot 2-3 times a month and once a week respectively, while only 0.1-0.4 % state that they eat such fish more than once a week. Others never eat such fish (56-66 %) or only a few times per year (1-4 times/yr, 26-30 %; 5-8 times/yr, 4-7 %; 9-12 times/yr, 3-6 %).
Calculations of MeHg intake indicate that mean intake for adults and children is approx. 0.1-0.2 µg/kg body weight and week. Lean sea fish that has low average Hg concentrations is the dominant source of MeHg exposure for most individuals. For those who eat pike the intake is considerably higher and for these individuals pike is a very large source of MeHg exposure, particularly if the catch site is such that the Hg concentration in fish is greatly elevated. If the Hg concentration in
intake is 0.8 µg/kg body weight and week for an adult individual. In children who eat large amounts of fish (95th percentile) MeHg exposure varied between approx. 0.4-0.6 µg/kg body weight and week.
The exposure studies carried out among pregnant women in Sweden point in the same direction as the theoretical intake calculations; exposure to MeHg is generally low. Studies directed at groups who eat large amounts of fish show a higher exposure to MeHg than in pregnant women, and with considerable inter-individual variation.
A survey of recreational fishing from 2005 indicates that 1-2 % of the population eat self-caught fish at least once a week. Perch and pike caught in small lakes and tarns represent the greatest catch out-take among recreational anglers.
Effects of MeHg
Based on observations from early environmental disasters and later studies on the effects in children exposed to prenatal MeHg exposure, it has been concluded that the critical effect of exposure to MeHg is the impact on central nervous system during the foetal stage. The effects that have been observed in some studies consist of delayed development of the central nervous system in the form of impaired cognitive ability. These effects are so small that they cannot be distinguished at an individual level.
Pregnant women are therefore a risk group in the population. Furthermore, the possibility cannot be ruled out that children up to teenage years can be more sensitive to effects than adults. At high exposures to MeHg in adults, effects are also observed on the nervous system but higher levels than in the foetus are required before these occur. Results from epidemiological studies indicate a correlation between high exposure to MeHg in adults and incidence of cardiovascular disease, while no such effects are observed at low exposure to MeHg. Animal models and in vitro systems indicate that MeHg has an
immunotoxic effect, but the significance of this from a risk assessment perspective has still not been fully investigated.
Risk assessments
Tolerable intake
The FAO/WHO expert group JECFA specifies a provisional tolerable weekly intake (PTWI) of 1.6 µg/kg body weight. This is considered to protect the most sensitive group, i.e. pregnant women and their foetuses, from effects. This assessment is based on epidemiological studies on the Faroe Islands and the Seychelles. The PTWI applies in principle to all groups in the population, but for adults other than pregnant women JECFA considers a value twice the PTWI, i.e.
![Table 1. Mercury concentrations in consumption fish. Revised table from [13].](https://thumb-eu.123doks.com/thumbv2/5dokorg/3243804.14173/8.892.123.781.174.1020/table-mercury-concentrations-consumption-fish-revised-table.webp)
![Figure 2. MeHg concentration in the blood of pregnant women from Solna 1994- 1994-96 [37], the west coast (Västkusten) 2001-02 [19], Skåne 2002-03 [20] and Västerbotten 2003-04 [21]](https://thumb-eu.123doks.com/thumbv2/5dokorg/3243804.14173/18.892.132.591.696.952/figure-mehg-concentration-pregnant-solna-västkusten-skåne-västerbotten.webp)
![Figure 3. Hg concentration in the hair of pregnant women from Uppsala 1996-99 [38], Västkusten 2001-02 [19], Skåne 2002-03 [20] and Västerbotten 2003-04 [21]](https://thumb-eu.123doks.com/thumbv2/5dokorg/3243804.14173/19.892.174.639.170.465/figure-concentration-pregnant-women-uppsala-västkusten-skåne-västerbotten.webp)
![Figure 4. MeHg concentration in the blood of groups of individuals who eat large amounts of fish [40], [23], [26], [28]](https://thumb-eu.123doks.com/thumbv2/5dokorg/3243804.14173/20.892.131.634.173.489/figure-mehg-concentration-blood-groups-individuals-large-amounts.webp)