Proficiency Testing
Food Microbiology
April 2018
Edition
Version 1 (2018-06-15)
Editor in chief
Hans Lindmark, head of Biology department, National Food Agency
Responsible for the scheme
Jonas Ilbäck, microbiologist, Biology department, National Food Agency PT April 2018 is registered as no. 2017/03177 at the National Food Agency.
Proficiency Testing
Microbiology – Food
April 2018
Quantitative analyses Aerobic microorganisms, 30 °C Psychrotrophic microorganisms Enterobacteriaceae Escherichia coli Presumptive Bacillus cereus
Coagulase-positive staphylococci
Lactic acid bacteria
Clostridium perfringens
Anaerobic sulphite-reducing bacteria
Aerobic microorganisms in fish products, 20-25 ºC
H2S-producing bacteria in fish products
Yeasts
Abbreviations
Media
BA Blood agar
BcsA Bacillus cereus selective agar
BP Baird-Parker agar
BP + RPF Baird-Parker agar with rabbit plasma fibrinogen
CBC Oxoid Brilliance™ Bacillus cereus agar
CPC CP ChromoSelect agar
DG18 Dichloran glycerol agar
DRBC Dikloran Rose-Bengal chloramphenicol agar
EC E. coli broth
EMB Eosin methylene blue agar
IA Iron agar
ISA Iron sulphite agar
LTLSB Lactose tryptone lauryl sulphate broth
mCP Membrane Clostridium perfringens agar
MEA Malt extract agar
MPCA Milk plate count agar
MRS de Man, Rogosa and Sharpe agar
MRS-aB de Man, Rogosa and Sharpe agar with amphotericin MRS-S de Man, Rogosa and Sharpe agar with sorbic acid
MSA Mannitol salt agar
MYP Mannitol egg yolk polymyxin agar
OGYE Oxytetracyclin glucose yeast extract agar
PAB Perfringens agar base
PEMBA Polymyxin pyruvate egg yolk mannitol bromothymol blue agar
PCA Plate count agar
PDA Potato dextrose agar
RBC Rose-Bengal chloramphenicol agar
SC Sulphite cycloserine agar
SFP Shahidi-Ferguson Perfringens agar
TBX Tryptone bile X-glucuronide agar
TGE Tryptone glucose extract agar
TS Tryptose sulphite agar
TSA Tryptone soya agar
TSC Tryptose sulphite cycloserine agar
VRB Violet red bile agar
VRBG Violet red bile glucose agar
YGC Yeast extract glucose chloramphenicol agar
Organisations
AFNOR French National Standardization Association
AOAC AOAC INTERNATIONAL
ISO International Organization for Standardization
NMKL Nordic Committee for Food Analyses
Contents
General information on results evaluation... 4
Results of the PT round April 2018 ... 5
- General outcome ... 5
- Aerobic microorganisms, 30 °C... 6
- Psychrotrophic microorganisms ... 8
- Enterobacteriaceae ... 10
- Escherichia coli ... 12
- Presumptive Bacillus cereus ... 14
- Coagulase-positive staphylococci ... 16
- Lactic acid bacteria ... 18
- Clostridium perfringens.. ... 20
- Anaerobic sulphite-reducing bacteria ... 22
- Aerobic microorganisms in fish products, 20-25 ºC ... 24
- H2S-producing bacteria in fish products ... 26
- Yeasts and moulds ... 28
Outcome of the results of individual laboratory – assessment ... 32
- Box plot ... 33
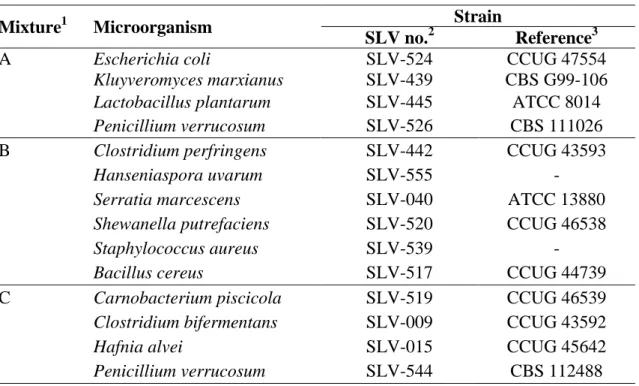
Test material and quality control ... 39
- Test material ... 39
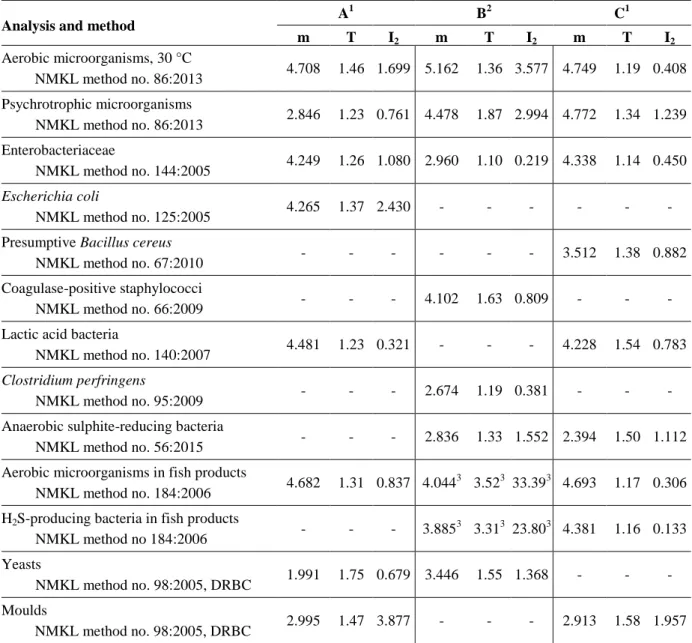
- Quality control of the mixtures ... 40
References ... 41
Annex 1: Results obtained by the participants
General information on results evaluation
Statistical evaluation of the results
Highly deviating values that did not belong to a strictly normal distribution after log10
transformation were identified as statistical outliers (Grubbs’ test modified by Kelly (1)). In some cases, subjective adjustments were made to set limits, based on knowledge of the mixture’s contents. Outliers and false results were not included in the calculations of means and standard deviations. Results reported as “> value” were excluded from the evaluation. Results reported as “< value” were interpreted as being zero (negative result). All reported results are presented in Annex 1.
According to EN ISO/IEC 17043, for which the proficiency testing programme is accredited, it is mandatory for the participating laboratories to report method information for all their analyses. Method information is sometimes difficult to interpret, since many laboratories report a medium that that is not included in the standard method that they refer to. Results from laboratories that report contradictory data on methods/media have either been excluded from the method analysis, or been added to the group of “Others”, together with results from methods and media that are only used by 1-2 laboratories.
Mean values and standard deviations are normally provided for the different analyses. When the total number of reported results for an analysis is fewer than 20, the median is provided instead of the mean value. For method groups with fewer than 5 results, only the number of false results and outliers are provided. Results for such method groups are only displayed in tables and histograms when it is considered relevant.
Uncertainty of measurement for the assigned values
The uncertainty of measurement for an assigned value is calculated as the standard deviation divided by the square root of the number of correct results (”standard error”). The assigned value of evaluated parameters is the mean value of the participants results. Table and figure legends
Tables
N number of laboratories that performed the analysis n number of laboratories with satisfactory result
m mean value in log10 cfu/ml (false results and outliers excluded) s standard deviation (false results and outliers excluded)
F number of false positive or false negative results < number of low outliers
> number of high outliers global results for the analysis values discussed in the text
Figures
Histograms of the analytical results for each mixture and parameter are presented. The mean value of the analysis results is indicated in each histogram.
values within the interval of acceptance (Annex 1) outliers
false negative results
Results of the PT round April 2018
General outcome
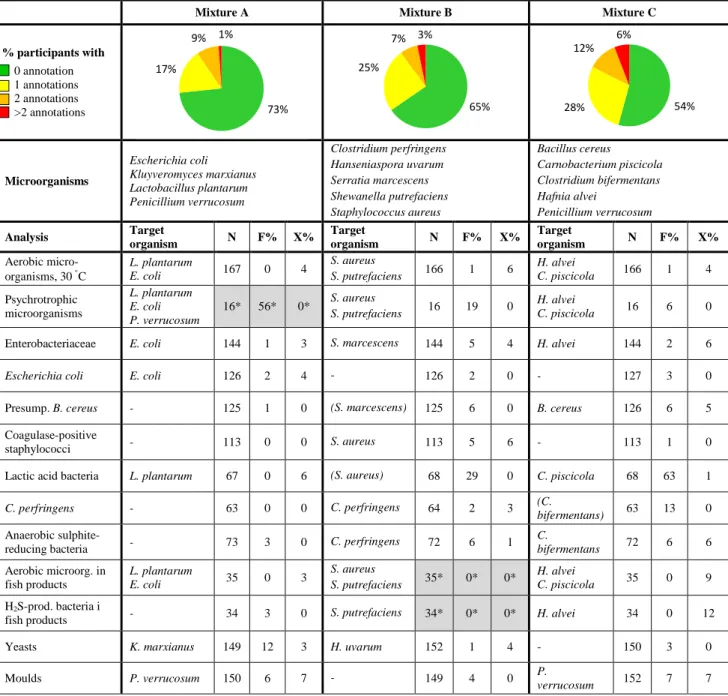
Samples were sent to 195 laboratories, 44 in Sweden, 135 in other European countries, and 16 outside of Europe. Of the 188 laboratories that reported results, 117 (62 %) provided at least one result that received an annotation. In the previous round with similar analyses (April 2017), the proportion was 53 %.
Individual results for each analysis in the PT round are listed in Annex 1 and are also available on the website after logging in: www2.slv.se/absint.
Table 1. Composition of the test material and proportion of deviating results (N:
number of reported results, F%: false positive or false negative, X%: outliers).
Mixture A Mixture B Mixture C
% participants with 0 annotation 1 annotations 2 annotations >2 annotations Microorganisms Escherichia coli Kluyveromyces marxianus Lactobacillus plantarum Penicillium verrucosum Clostridium perfringens Hanseniaspora uvarum Serratia marcescens Shewanella putrefaciens Staphylococcus aureus Bacillus cereus Carnobacterium piscicola Clostridium bifermentans Hafnia alvei Penicillium verrucosum Analysis Target organism N F% X% Target organism N F% X% Target organism N F% X% Aerobic micro-organisms, 30 C L. plantarum E. coli 167 0 4 S. aureus S. putrefaciens 166 1 6 H. alvei C. piscicola 166 1 4 Psychrotrophic microorganisms L. plantarum E. coli P. verrucosum 16* 56* 0* S. aureus S. putrefaciens 16 19 0 H. alvei C. piscicola 16 6 0
Enterobacteriaceae E. coli 144 1 3 S. marcescens 144 5 4 H. alvei 144 2 6
Escherichia coli E. coli 126 2 4 - 126 2 0 - 127 3 0
Presump. B. cereus - 125 1 0 (S. marcescens) 125 6 0 B. cereus 126 6 5 Coagulase-positive
staphylococci - 113 0 0 S. aureus 113 5 6 - 113 1 0 Lactic acid bacteria L. plantarum 67 0 6 (S. aureus) 68 29 0 C. piscicola 68 63 1
C. perfringens - 63 0 0 C. perfringens 64 2 3 (C.
bifermentans) 63 13 0
Anaerobic
sulphite-reducing bacteria - 73 3 0 C. perfringens 72 6 1
C. bifermentans 72 6 6 Aerobic microorg. in fish products L. plantarum E. coli 35 0 3 S. aureus S. putrefaciens 35* 0* 0* H. alvei C. piscicola 35 0 9 H2S-prod. bacteria i
fish products - 34 3 0 S. putrefaciens 34* 0* 0* H. alvei 34 0 12 Yeasts K. marxianus 149 12 3 H. uvarum 152 1 4 - 150 3 0
73% 17% 9% 1% 65% 25% 7% 3% 54% 28% 12% 6%
Aerobic microorganisms, 30 C
Mixture AThe strains of L. plantarum and E. coli were present in the highest concentrations and thus most colonies on the plates were from these species. Three low and three high outliers were reported.
Mixture B
The strains of S. putrefaciens and S. aureus were present in the highest concentrations and thus most colonies were from these species. Six low and four high outliers were reported, as well as one false negative result. Slightly higher results were reported by users of 3M™ Petrifilm™ Aerobic Count (Petrifilm AC), something that has been observed also in previous proficiency testing rounds (latest in PT April 2017). The cause is unclear, but possibly the surface spreading technique used with Petrifilm AC is more gentle to the bacteria compared to the pour-plate technique used in other methods. Mixture C
The strains of H. alvei and C. piscicola were present in the highest concentrations and thus most colonies on the plates were from these species. Three low and three high outliers were reported, as well as one false negative result.
General remarks
As a whole, the analyses were without problem for the laboratories. With the exception for slightly higher results for Petrifilm AC in mixture B, there was also no discernible difference between the different methods and media that were used.
The majority of the laboratories followed either NMKL 86:2013 (29 %), ISO 4833-1:2013 (23 %) or used Petrifilm AC (19 %). The older NMKL 86:2006 was used by 10 % of the laboratories, while only a small number of laboratories stated the use of NMKL 86:2003 or ISO 4833:2003. These different methods are however highly similar, and all are based on incubation on Plate Count Agar (PCA) or Milk Plate Count Agar (MPCA) at 30 °C for 72 h. Users of Petrifilm AC may however use a different time/temperature, depending on which method is followed. For example, AOAC® 990.12 prescribes incubation at 35 °C for 48 h while AFNOR 3M 01/1-09/89 prescribes 30 °C for 72 h.
Five laboratories (3 %) used TEMPO® AC (bioMérieux® SA, Marcy l`Etoile, France), which is based on MPN (Most Probable Number). With this method, the sample is incubated in a card that contains wells with different volumes. A substrate in the wells emits fluorescence when hydrolysed by the microorganisms. The concentration is determined by the number and size of the fluorescent wells.
Results from analysis of aerobic microorganisms
Medium N Mixture A Mixture B Mixture C
n m s F < > n m s F < > n m s F < > All results 167 161 4.619 0.129 0 3 3 155 4.085 0.124 1 6 4 159 4.689 0.127 1 3 3 PCA 89 86 4.616 0.118 0 1 2 83 4.059 0.108 0 3 2 85 4.660 0.122 0 1 2 Petrifilm AC 33 32 4.661 0.153 0 0 1 29 4.177 0.123 1 1 2 31 4.727 0.144 1 0 1 MPCA 21 21 4.654 0.091 0 0 0 21 4.050 0.122 0 0 0 21 4.700 0.090 0 0 0 TSA 10 9 4.491 0.106 0 1 0 8 4.085 0.104 0 2 0 9 4.686 0.143 0 1 0 TEMPO AC 5 4 4.575 0.209 0 1 0 5 4.144 0.217 0 0 0 4 4.858 0.107 0 1 0 TGE 5 5 4.610 0.113 0 0 0 5 4.096 0.077 0 0 0 5 4.702 0.083 0 0 0 Compact Dry TC 1 1 - - 0 0 0 1 - - 0 0 0 1 - - 0 0 0 Other 3 3 - - 0 0 0 3 - - 0 0 0 3 - - 0 0 0 A A B B C C 0 10 20 30 40 50 60 70 2 2.5 3 3.5 4 4.5 5 5.5 6 Aerobic microorganisms 30 °C Without remark False negative Outlier log 10 CFU per ml N u mb er o f resu lts 4.619 * 0 10 20 30 40 50 60 70 2 2.5 3 3.5 4 4.5 5 5.5 6 Aerobic microorganisms 30 °C PCA Petrifilm AC MPCA TSA TEMPO AC TGE Compact Dry TC Other log 10 CFU per ml N u mb er o f resu lts 4.619 * 0 10 20 30 40 50 60 70 2 2.5 3 3.5 4 4.5 5 5.5 6 Aerobic microorganisms 30 °C Without remark False negative Outlier log 10 CFU per ml N u mb er o f resu lts 4.085 * * 0 10 20 30 40 50 60 70 2 2.5 3 3.5 4 4.5 5 5.5 6 Aerobic microorganisms 30 °C PCA Petrifilm AC MPCA TSA TEMPO AC TGE Compact Dry TC Other log 10 CFU per ml N u mb er o f resu lts * 4.085 * 0 10 20 30 40 50 60 70 Aerobic microorganisms 30 °C Without remark False negative Outlier N u mb er o f resu lts 4.689 * * 0 10 20 30 40 50 60 70 Aerobic microorganisms 30 °C PCA Petrifilm AC MPCA TSA TEMPO AC TGE Compact Dry TC Other N u mb er o f resu lts * * 4.689
Psychrotrophic microorganisms
Mixture AThe strains of L. plantarum, E. coli and P. verrucosum were target organisms. At the National Food Agency, a concentration of log10 2.85 cfu ml-1 was determined after ten
days incubation on PCA at 6.5 C. Nine of 16 laboratories reported zero results, in all cases except one after incubation at 6.5 °C or 7 °C. In comparison, the positive results were in all cases except one reported by laboratories that incubated at 15 °C or higher. The results for the seven laboratories that reported positive results varied between log10
2.76-4.78 cfu ml-1, which can also partly be explained by the variations in the incubation conditions between the laboratories. The median for the positive results was 4.10 cfu ml-1, which is somewhat lower than the combined concentration of
L. plantarum and E. coli in the mixture. Due to the differences in the incubation
conditions, and the low number of participants, both zero results at incubation at 6.5/7 °C and positive results at 15 °C and higher are considered correct. The result for the laboratory that incubated at 20-21 °C, and still reported a negative result, is however considered incorrect.
Comment: The results for mixture A are not statistically evaluated. Therefore, no z-scores have been calculated for these results, and they are also not included in the tables located below the box plots.
Mixture B
The strains of S. aureus and S. putrefaciens were target organisms. Three of 16 laboratories reported zero results. The 13 positive results were varied between log10
2.90-4.39 cfu ml-1. The variation can here as well be partly explained by the variations in the incubation conditions between the laboratories. However contrary to the same analysis in mixture A, no obvious connection between reported results and incubation conditions could be identified. For example, a false negative result was reported by a laboratory that incubated at 20-21 °C, and high results were reported by laboratories that incubated at 6.5 °C. Combined with the low number of participants in the analysis, all positive results are considered correct.
Mixture C
The strains of H. alvei and C. piscicola were target organisms. The majority of the laboratories also reported concentrations corresponding to the sum of H. alvei and
C. piscicola in the mixture. One laboratory reported a false negative result. Due to the
differences in the incubation conditions, and the low number of participants, all positive results are considered correct.
General remarks
A total of 16 laboratories performed the analysis. The majority of these (81 %) incubated on PCA. The incubation conditions varied to a large extent, which is reflected by the differences in the methods that were used. NMKL 86:2013 prescribes 10 days at 6.5 °C, but 20 h at 17 °C followed by 3 days at 7 °C can also be used. For milk, ISO 6730:2005/IDF 101:2005 determines psychrotrophic microorganisms at 6.5 °C. The other method for milk, ISO 8552:2004/IDF 132:2004, instead estimates the number of psychrotrophic microorganisms in a rapid method based on incubation at 21 °C. ISO 4833-1:2013 prescribes incubation at 30 °C, but here the laboratories used both 6.5 °C and 20-21 °C.
Due to the low number of participants, the median is provided instead of the mean value in tables and figures.
Results from analysis of psychrotrophic microorganisms
Temperature N Mixture A* Mixture B Mixture C
n Med** s F < > n Med** s F < > n Med** s F < >
All results 16 7 - - - 13 3.280 0.465 3 0 0 15 4.556 0.372 1 0 0
6.5 C 6 1 - - - 5 3.340 0.562 1 0 0 5 4.663 0.097 1 0 0
20-21 C 5 4 - - - 4 3.310 0.453 1 0 0 5 4.556 0.567 0 0 0
17 C and 7 C 4 1 - - - 3 - - 1 0 0 4 - - 0 0 0
15 C 1 1 - - - 1 - - 0 0 0 1 - - 0 0 0
* The results for mixture A are not evaluated ** Med = median A A B B C C 0 2 4 6 8 10 2 2.5 3 3.5 4 4.5 5 5.5 6 Psychrotrophic microorganisms Positive result Zero result log 10 CFU per ml N u mb er o f resu lts * 0 2 4 6 8 10 2 2.5 3 3.5 4 4.5 5 5.5 6 Psychrotrophic microorganisms 6.5 °C 20-21 °C 17 °C and 7 °C 15 °C log 10 CFU per ml N u mb er o f resu lts * 0 2 4 6 8 10 2 2.5 3 3.5 4 4.5 5 5.5 6 Psychrotrophic microorganisms Without remark False negative Outlier log 10 CFU per ml N u mb er o f resu lts * 3.280 0 2 4 6 8 10 2 2.5 3 3.5 4 4.5 5 5.5 6 Psychrotrophic microorganisms 6.5 °C 20-21 °C 17 °C and 7 °C 15 °C log 10 CFU per ml N u mb er o f resu lts * 3.280 2 4 6 8 10 Psychrotrophic microorganisms Without remark False negative Outlier N u mb er o f resu lts * 4.556 2 4 6 8 10 Psychrotrophic microorganisms 6.5 °C 20-21 °C 17 °C and 7 °C 15 °C N u mb er o f resu lts * 4.556
Enterobacteriaceae
Mixture AThe strain of E. coli was target organism. Two low and two high outliers were reported, as well as one false negative result.
Mixture B
The strain of S. marcescens was target organism. Three low and three high outliers were reported, as well as seven false negative results. Relatively few false negative results appear to have been reported by users of 3M™ Petrifilm™ Enterobacteriaceae (Petrifilm EB), but since the total number of false negative results is fairly low, it cannot be ruled out that this is simply due to chance.
Mixture C
The strain of H. alvei was target organism. Six low and two high outliers were reported, as well as three false negative results. The majority of the low outliers were reported by users of violet red bile glucose agar (VRBG), which at the same time was the medium most frequently used.
General remarks
As in previous proficiency testing rounds most laboratories used either NMKL 144:2005 (47 %) or a method based on Petrifilm EB (21 %), while the ISO methods (various versions) attributed to 20 %. The proportion of users of the new ISO 21528-2:2017 was now similar to the older ISO 21528-2:2004 (7 % and 8 % respectively). The new ISO 21528-1:2017 was however only used by two laboratories (1 %). ISO 21528-2:2017 is based on colony-count, whereas ISO 21528-1:2017 is based on MPN (Most Probable Number). The latter method is recommended when the expected level of Enterobacteriaceae is lower than 100 cfu g-1. The mean values for the different ISO methods were however very similar, for all three mixtures. As in the analysis of aerobic microorganisms, a small number of laboratories used fluorescence-based methods (TEMPO® Enterobacteriaceae). One laboratory reported following ISO 4832:2006, which is a method for enumeration of coliform bacteria at 30 °C or 37 °C.
Enterobacteriaceae are Gram-negative and oxidase-negative bacteria that ferment glucose with the production of acid by-products. On VRBG – which is used in both NMKL 144 and ISO 21528-2 – they form pink/red colonies, with or without a bile precipitation zone. The appearance is similar on Petrifilm EB, which also includes a colour indicator for acid by-products and a plastic film for detection of gas production. According to NMKL 144:2005, presumptive colonies in VRBG should be confirmed with an oxidase test. In the new ISO 21528-2:2017, confirmation is instead done with a glucose oxidation/fermentation (OF) medium. Oxidase-negative bacteria that produce gas from glucose in the OF medium are considered as Enterobacteriaceae. The majority of the laboratories (65 %) stated performing some kind of confirmation test. No obvious difference could however be seen in the results from laboratories that performed such a test, and those that did not.
With the exception of the differences for VRBG and Petrfilm EB mentioned above, no major differences could be seen between the different methods and media that were used. It could still be mentioned that for TEMPO EB, slightly higher results could be seen in mixtures A and B, and slightly lower in mixture C, compared to other media. However TEMPO EB was only used by six laboratories and it is possible that these differences are simply due to chance.
Results from analysis of Enterobacteriaceae
Medium N Mixture A Mixture B Mixture C
n m s F < > n m s F < > n m s F < > All results 144 139 4.154 0.152 1 2 2 131 2.651 0.167 7 3 3 133 4.204 0.163 3 6 2 VRBG 96 93 4.141 0.159 1 1 1 89 2.642 0.169 3 3 1 88 4.204 0.166 2 5 1 Petrifilm EB 32 30 4.180 0.124 0 1 1 26 2.657 0.139 4 0 2 30 4.225 0.152 1 0 1 TSA/VRBG 6 6 4.092 0.175 0 0 0 6 2.617 0.290 0 0 0 6 4.200 0.115 0 0 0 TEMPO EB 6 6 4.236 0.150 0 0 0 6 2.760 0.076 0 0 0 5 4.092 0.249 0 1 0
Compact Dry™ ETB 2 2 - - 0 0 0 2 - - 0 0 0 2 - - 0 0 0
Other 2 2 - - 0 0 0 2 - - 0 0 0 2 - - 0 0 0 A A B B C C 0 10 20 30 40 50 60 1 1.5 2 2.5 3 3.5 4 4.5 5 Enterobacteriaceae Without remark False negative Outlier log 10 CFU per ml N u mb er o f resu lts * 4.154 * 0 10 20 30 40 50 60 1 1.5 2 2.5 3 3.5 4 4.5 5 Enterobacteriaceae VRBG Petrifilm EB TSA/VRBG TEMPO EB Compact Dry ETB Other log 10 CFU per ml N u mb er o f resu lts * 4.154 * 0 10 20 30 40 50 60 1 1.5 2 2.5 3 3.5 4 4.5 5 Enterobacteriaceae Without remark False negative Outlier log 10 CFU per ml N u mb er o f resu lts * 2.651 0 10 20 30 40 50 60 1 1.5 2 2.5 3 3.5 4 4.5 5 Enterobacteriaceae VRBG Petrifilm EB TSA/VRBG TEMPO EB Compact Dry ETB Other log 10 CFU per ml N u mb er o f resu lts * 2.651 0 10 20 30 40 50 60 1 1.5 2 2.5 3 3.5 4 4.5 5 Enterobacteriaceae Without remark False negative Outlier log 10 CFU per ml N u mb er o f resu lts * 4.204 * 0 10 20 30 40 50 60 1 1.5 2 2.5 3 3.5 4 4.5 5 Enterobacteriaceae VRBG Petrifilm EB TSA/VRBG TEMPO EB Compact Dry ETB Other log 10 CFU per ml N u mb er o f resu lts * 4.204 *
Escherichia coli
Mixture A
The strain of E. coli was target organism. In tests at the National Food Agency, this was indole-positive, β-glucuronidase-positive, and formed gas in lactose tryptone lauryl sulphate broth (LTLSB). Three low and two high outliers were reported, as well as three false negative results.
Mixture B
No target organism was present in the mixture. Three laboratories reported a false negative result.
Mixture C
No target organism was present in the mixture. Four laboratories reported a false negative result.
General remarks
The use of 3M™ Petrifilm™ was high; in total 31 % of the laboratories used methods based on either Petrifilm EC/CC or Petrifilm SEC. These were followed by NMKL 125:2005 (29 %), and ISO 16649-2:2001 (13 %). Further, the MPN methods ISO 7251:2005 and NMKL 96:2009 were used by four and two laboratories, respectively. Two of the four laboratories that followed ISO 7251:2005 reported results that received an annotation. It is however difficult to determine if this is due to the strain being difficult with this particular method, or if it is simply due to chance.
The definition of E. coli differs between the methods. With ISO 16649-2:2001,
E. coli are defined as those bacteria that form typical blue colonies on tryptone bile
X-glucuronide agar (TBX) after 18-24 h at 44 °C. The blue colour is due to E. coli glucuronidase reacting with an indicator in the medium. No further confirmation of β-glucuronidase-positive colonies is required according to ISO 16649-2:2001. Petrifilm EC/CC and Petrifilm SEC are also based on media that detect E. coli β-glucuronidase. Further, the plastic film in Petrifilm EC/CC and Petrifilm SEC facilitates detection of gas produced by lactose fermentation. In comparison, NMKL 125:2005 describes the analysis of both thermotolerant coliform bacteria and of E. coli. Thermotolerant coliform bacteria are defined as those that form typical dark red colonies, surrounded by a red zone of precipitation, on violet red bile agar (VRB) after 24 h at 44 °C. Confirmation is by inoculation into either E. coli broth (EC) or LTLSB. In both these media thermotolerant coliform bacteria produce gas, as a consequence of lactose fermentation. Bacteria that also produce indole in either LTLSB or in tryptone broth are then considered as E. coli. In total, 59 % of the laboratories stated performing some kind of confirmation. No clear difference in the results of laboratories that confirmed, and those that did not, could however be discerned. Here, it could also be mentioned that NMKL 125 is currently being revised, and the new version will likely be more similar to ISO 16649-2.
As in previous proficiency testing rounds where E. coli has been analysed, there were several methods and media that were only used by a small number of laboratories. Therefore, it was in general difficult to identify differences between methods and media. The exceptions to this were somewhat lower results for TBX, and somewhat higher for TSA/VRB. This has been observed in several previous proficiency testing rounds, but no clear cause has been found. It is however fairly likely that performing a pre-incubation may have an effect on the result. If the sample is suspected to contain
stressed microorganisms, ISO 16649-2:2001 prescribes a pre-incubation at 37 °C for 4 h prior to the final incubation at 44 °C. In comparison, a similar pre-incubation (20-25 °C for 1-2 h) is routinely carried out in NMKL 125:2005. Still, the differences were small, and the results also had a fairly wide distribution, at least for TBX.
The majority of the laboratories incubated either at 41.5-44 C (63 %) or at 35-37 C (36 %). Here it was obvious that for mixture A more outliers were reported by laboratories that incubated at the lower temperature (three low and two high outliers) compared to those that incubated at the higher temperature (no outliers). The number of false results also appeared to be somewhat over-represented for the 35-37 C temperature range for mixtures B and C. The mean values for the two temperature groups were however similar.
Results from analysis of Escherichia coli
Medium N Mixture A Mixture B Mixture C n m s F < > n m s F < > n m s F < > All results 126 118 4.144 0.172 3 3 2 123 - - 3 - - 123 - - 4 - - TSA/VRB 23 23 4.213 0.120 0 0 0 23 - - 0 - - 23 - - 0 - - Petrifilm EC/CC 22 21 4.163 0.095 0 0 1 19 - - 1 - - 20 - - 1 - - Petrifilm SEC 22 19 4.174 0.164 2 0 1 22 - - 0 - - 21 - - 1 - - TBX 22 22 4.088 0.211 0 0 0 22 - - 0 - - 22 - - 0 - - VRB 12 10 4.137 0.103 0 2 0 11 - - 1 - - 11 - - 1 - - EC 4 4 - - 0 0 0 5 - - 0 - - 5 - - 0 - - TEMPO EC 4 4 - - 0 0 0 4 - - 0 - - 4 - - 0 - - Rapid' E. coli 2 3 3 - - 0 0 0 3 - - 0 - - 3 - - 0 - - Brilliance EC/CC 2 1 - - 0 1 0 2 - - 0 - - 2 - - 0 - - CompactDry™ EC 2 2 - - 0 0 0 2 - - 0 - - 1 - - 1 - - EMB 2 0 - - 1 0 0 2 - - 0 - - 2 - - 0 - - TSA/VRBG 2 2 - - 0 0 0 2 - - 0 - - 2 - - 0 - - Other 7 7 3.986 0.203 0 0 0 6 - - 1 - - 7 - - 0 - - A A 0 10 20 30 40 2 2.5 3 3.5 4 4.5 5 5.5 6 Escherichia coli Without remark False negative Outlier log 10 CFU per ml N u mb er o f resu lts 4.144 * * 0 10 20 30 40 2 2.5 3 3.5 4 4.5 5 5.5 6 Escherichia coli TSA/VRB Petrifilm EC/CC Petrifilm SEC TBX VRB EC TEMPO EC Other log 10 CFU per ml N u mb er o f resu lts 4.144 * *
Presumptive Bacillus cereus
Mixture ANo target organism was present in the mixture. One laboratory reported a false positive result.
Mixture B
No target organism was present in the mixture. Seven laboratories reported a false positive result. The reported concentrations suggest they may have detected S. aureus or
S. marcescens, which sometimes form atypical colonies on Bacillus cereus-selective
agar (BcsA). At the National Food Agency, colonies were observed on blood agar (BA) – when transferred to BcsA they however displayed an atypical morphology and they did not have a blue colour.
Mixture C
The strain of B. cereus was target organism. Two low and four high outliers were reported, as well as eight false negative results.
One laboratory detected a correct concentration (approximately 2100 cfu ml-1), but chose to report a negative result, since the colonies did not display a distinct blue colour on BcsA. The laboratory however made a comment that it could be a false negative result. No other laboratories have reported problems with the colour on BcsA.
General remarks
As in previous proficiency testing rounds most laboratories followed either NMKL 67:2010 (53 %) or ISO 7932:2004 (26 %). These numbers indicate a slight increase in the use of the ISO method compared to the NMKL method. The remaining 22 % reported using either internal methods, company-specific methods or methods that were not further specified. ISO 7932:2004 was last reviewed in 2015 and remains current.
NMKL 67:2010 is based on growth on blood agar (BA). On this medium, B. cereus form large, irregular and grey colonies, that are surrounded by a large zone of haemolysis. Confirmation is by subculture onto either BcsA or Cereus-Ident agar (a chromogenic medium). On BcsA, presumptive B. cereus form bluish colonies that are surrounded by a precipitation zone due to lecithinase activity on egg yolk present in the medium. On Cereus-Ident agar, presumptive B. cereus are blue/turquoise, and possibly surrounded by a blue ring. The colour comes from enzymatic cleavage of the chromogenic substrate X-myoinositol-1-phosphate in Cereus-Ident agar, by B. cereus phosphatidylinositol phospholipase C (PI-PLC). In contrast to the NMKL method, ISO 7932:2004 prescribes the use of mannitol egg yolk polymyxin agar (MYP), which is followed by subculture onto BA. On MYP, presumptive B. cereus form large pink colonies that are normally surrounded by a large zone of precipitation, again due to lecithinase activity. The confirmation consists of a positive result for haemolysis on BA. As in previous proficiency testing rounds, the reporting of method data for B. cereus was in many cases unclear. For example, several laboratories reported using the same medium for both steps in the analysis. Other laboratories reported using combinations of methods and media that are incompatible. In general, the method/media reported by the laboratory are shown in this report, regardless if these are compatible or not. In addition to BA, BcsA and MYP, Oxoid Brilliance™ Bacillus cereus agar (CBC) – a chromo-genic medium – was used by a group of eight laboratories. The substrate X-Gluc in CBC is cleaved by B. cereus β-glucuronidase, resulting in white colonies with a
blue/green center. Laboratories that have only stated “chromogenic medium” for the analysis have been included in the group “Other”.
Despite the inconsistencies in the reporting of method data, the mean values for the different groups were highly similar. No differences in the results could be attributed to the use of a specific method or medium. Confirmation was performed by 63 % of the laboratories. No having performed a confirmation does not appear to have had an effect on the overall results of the laboratories. However, for mixture B somewhat more false positive results appear to have been reported by laboratories that did not perform a confirmation test, compared to those that did (five and two false positive results, respectively).
Results from analysis of presumptive Bacillus cereus
Medium N Mixture A Mixture B Mixture C
n m s F < > n m s F < > n m s F < > All results 125 124 - - 1 - - 118 - - 7 - - 112 3.295 0.226 8 2 4 BA-BcsA* 34 34 - - 0 - - 31 - - 2 - - 32 3.347 0.253 1 0 1 BA 27 27 - - 0 - - 25 - - 3 - - 25 3.290 0.184 2 1 0 BA-MYP 25 25 - - 0 - - 26 - - 0 - - 23 3.284 0.236 1 1 1 MYP 17 16 - - 1 - - 15 - - 1 - - 14 3.283 0.182 2 0 0 CBC 8 8 - - 0 - - 8 - - 0 - - 8 3.378 0.118 0 0 0 BcsA* 6 6 - - 0 - - 6 - - 0 - - 3 3.255 0.303 2 0 1 Compass 3 3 - - 0 - - 3 - - 0 - - 3 - - 0 0 0 Compact Dry BC 1 1 - - 0 - - 1 - - 0 - - 1 - - 0 0 0 TEMPO BC 1 1 - - 0 - - 1 - - 0 - - 1 - - 0 0 0 Other 3 3 - - 0 - - 2 - - 1 - - 2 - - 0 0 1
* Use of PEMBA has been interpreted as use of BcsA and is therefore included in this group.
C C 0 5 10 15 20 25 30 2 2.5 3 3.5 4 4.5 5 5.5 6
Presumptive Bacillus cereus
Without remark False negative Outlier log 10 CFU per ml N u mb er o f resu lts 3.295 * 0 5 10 15 20 25 30 2 2.5 3 3.5 4 4.5 5 5.5 6
Presumptive Bacillus cereus
BA-BcsA BA BA-MYP MYP CBC BcsA Compass Compact Dry TEMPO BC Other log 10 CFU per ml N u mb er o f resu lts 3.295 *
Coagulase-positive staphylococci
Mixture ANo target organism was present in the mixture. All laboratories reported a correct negative result.
Mixture B
The strain of S. aureus was target organism. At the National Food Agency, this formed colonies on Baird-Parker agar with rabbit plasma fibrinogen (BP + RPF) and the analysis was unproblematic. The participating laboratories however reported five low and two high outliers, as well as six false negative results. Eleven of thirteen outliers or false negative results were from analyses with BP without RPF.
Mixture C
No target organism was present in the mixture. One laboratory reported a false positive result.
General remarks
As in previous proficiency testing rounds most laboratories (49 %) reported following NMKL 66:2009. Other methods used were either ISO 6888-1:1999 (13 %), 3M™ Petrifilm™ Staph Express (12 %) or ISO 6888-2:1999 (10 %). Both ISO 6888-1:1999 (based on BP) and ISO 6888-2:1999 (based on BP + RPF) were last reviewed by ISO in 2015 and remain current.
NMKL 66:2009 prescribes incubation on BP and/or BP + RPF. Blood agar (BA) may be used as a complement. On BP, S. aureus forms characteristic convex, shiny colonies that are grey/black due to reduction of tellurite in the medium. Proteolysis of egg yolk in the medium (due to lecithinase activity) normally causes a clear zone around the colonies. An opaque halo may also form near the colony, due to precipitation caused by lipase activity. The colonies are confirmed by a positive result in a coagulase test. When using BP + RPF, the coagulase activity is tested directly in the medium, and no subsequent confirmation is required. Similar to NMKL 66, ISO 6888-1 stipulates surface spreading on BP and confirmation by a coagulase test, whereas ISO 6888-2 instead uses BP + RPF. 3M™ Petrifilm™ Staph Express (Petrifilm Staph) uses a modified Baird-Parker medium, and a chromogenic indicator that stains S. aureus red/purple.
Colagulase-positive staphylococci are traditionally confirmed by detection of extracellular or bound coagulase (tube coagulase test and slide coagulase test respectively). Confirmation with latex agglutination test is also common. This is based on latex particles coated either with fibrinogen or with IgG that binds to protein A on the bacterial cell surface. Antibodies targeted against polysaccharides on the bacterial cell surface are also used in variations of this test. Users of Petrifilm Staph instead normally use 3M™ Petrifilm™ Staph Express Disk (Petrifilm Disk) for confirmation. This is based on detection of extracellular DNase, which is produced by the majority of coagulase-positive S. aureus, but also by S. intermedius och S. hyicus. Toluidine blue O in the disks visualizes DNase activity as a pink zone surrounding the colonies.
There is no clear explanation for the many outliers and false negative results in mixture B. Most of the outliers and false negative results were reported by users of BP, which at the same time was the most frequently used medium. At the same time, laboratories that incubated on BP + RPF, the second most frequently used medium,
reported neither outliers nor false negative results for either of the mixtures. This could possibly suggest a problem with the confirmation among the laboratories that incubated on BP. Confirmation of some kind was performed by 73 % of the laboratories, and by 92 % of the laboratories that incubated on BP. The methods most used for the confirmation were tube coagulase test, latex agglutination test and Petrifilm Disk. Overall, laboratories that confirmed, and those that did not confirm, appear to have obtained similar results for all three mixtures. It could however be noted that none of the laboratories that reported outliers and false negative results for mixture B appear to have used a latex agglutination test.
Results from analysis of coagulase-positive staphylococci
Medium N Mixture A Mixture B Mixture C n m s F < > n m s F < > n m s F < > All results 113 113 - - 0 - - 100 3.946 0.112 6 5 2 112 - - 1 - - BP 62 62 - - 0 - - 50 3.938 0.113 5 5 1 62 - - 0 - - BP + RPF 27 27 - - 0 - - 27 3.983 0.105 0 0 0 27 - - 0 - - Petrifilm Staph 14 14 - - 0 - - 12 3.881 0.074 1 0 1 13 - - 1 - - Oxoid Brilliance Staph 24 3 3 - - 0 - - 3 - - 0 0 0 3 - - 0 - - EASY Staph 2 2 - - 0 - - 2 - - 0 0 0 2 - - 0 - - MSA* 2 2 - - 0 - - 2 - - 0 0 0 2 - - 0 - -
Compact Dry X-SA 1 1 - - 0 - - 2 - - 0 0 0 1 - - 0 - -
Other 2 2 - - 0 - - 2 - - 0 0 0 2 - - 0 - -
* MSA: Mannitol salt agar
B B 0 10 20 30 40 50 2 2.5 3 3.5 4 4.5 5 5.5 6 Coagulase-positive staphylococci Without remark False negative Outlier log 10 CFU per ml N u mb er o f resu lts 3.946 * 0 10 20 30 40 50 2 2.5 3 3.5 4 4.5 5 5.5 6 Coagulase-positive staphylococci BP BP + RPF Petrifilm Brilliance EASY Staph MSA Compact Dry Other log 10 CFU per ml N u mb er o f resu lts 3.946 *
Lactic acid bacteria
Mixture AThe strain of L. plantarum was target organism. Four low outliers were reported. Mixture B
No target organism was present in the mixture. Nevertheless, 20 false positive results were reported. These are likely due to detection of S. aureus; strains of S. aureus have in previous proficiency testing rounds formed small colonies on de Man, Rogosa and Sharpe agar (MRS) and MRS with amphotericin (MRS-aB). At the National Food Agency, small transparent colonies were observed on MRS-aB at a concentration of log10 3.85 cfu ml-1. In the subsequent confirmation these were catalase positive, and
they were therefore not considered as lactic acid bacteria. Thirteen of the 20 false positive results were from laboratories that did not perform a confirmation.
Mixture C
The strain of C. piscicola was target organism. In total, 43 of the laboratories (63 %) reported a false negative result. The same mixture was used previously in the proficiency testing round April 2016, with a similar result (66 % false negative). Compared to other lactic acid bacteria, the strain of C. piscicola has a higher sensitivity to low pH, as for example in the media de Man, Rogosa and Sharpe-agar with sorbic acid (MRS-S) and Rogosa agar. Users of these media also often reported false negative results. Most false negative results were however reported by users of MRS. The remaining results were distributed around a distinct peak. One laboratory reported a low outlier.
General remarks
The majority of the laboratories (56 %) followed NMKL 140. Most of them reported following NMKL 140:2007, but nine laboratories instead reported following the older NMKL 140:1991. This version prescribes spreading on MRS-S, while the newer version prescribes MRS-aB. On both media, lactic acid bacteria appear as 1.5-2 mm grey/white colonies. In comparison, ISO 15214:1998 uses a pour-plate method with MRS. This method was used by 15 % of the laboratories. It was last reviewed by ISO in 2015, but the review did not result in any changes. In comparison, NMKL 140 is scheduled for revision, and changes will likely be made to the confirmation tests.
Lactic acid bacteria constitute a heterogeneous group of microorganisms, and therefore have different optimal medium, pH and incubation conditions. For example MRS-aB (pH 6.2), which is used in NMKL 140:2007, is a less selective medium that allows the growth of a more wide range of lactic acid bacteria. This may however also result in the appearance of more false positive colonies compared to the more acid medium MRS-S (pH 5.7). Such differences between media and incubation conditions underline the importance of performing a confirmation test in uncertain cases, especially when using a less selective medium.
Both the ISO and the NMKL methods recommend confirmation of uncertain colonies by Gram staining and/or with a catalase test. Lactic acid bacteria are Gram positive and normally catalase negative. Confirmation was in this proficiency testing performed by 51 % of the laboratories; in most cases by a catalase test. Laboratories that reported false results for mixtures B and C do not appear to differ much in the performance or method of confirmation, compared to the other laboratories. For mixture
C however, the laboratories that performed a confirmation test had a higher mean value than the laboratories that did not perform a confirmation test (log10 4.369 and log10
4.031 cfu ml-1 respectively).
Results from analysis of lactic acid bacteria
Medium N Mixture A Mixture B Mixture C
n m s F < > n m s F < > n m s F < > All results 67 63 4.424 0.160 0 4 0 48 - - 20 - - 24 4.242 0.297 43 1 0 MRS 36 33 4.428 0.165 0 3 0 25 - - 12 - - 9 4.111 0.344 27 1 0 MRS-aB 12 12 4.437 0.169 0 0 0 10 - - 2 - - 10 4.399 0.248 2 0 0 MRS-S 8 8 4.390 0.107 0 0 0 4 - - 4 - - 4 4.180 0.180 4 0 0 Rogosa 7 6 4.493 0.140 0 1 0 7 - - 0 - - 0 - - 7 0 0 Petrifilm LAB* 2 2 - - 0 0 0 1 - - 1 - - 1 - - 1 0 0 TEMPO LAB** 1 1 - - 0 0 0 1 - - 0 - - 0 - - 1 0 0 Other 1 1 - - 0 0 0 0 - - 1 - - 0 - - 1 0 0
* 3M™ Petrifilm™ Lactic Acid Bacteria Count Plate
** TEMPO® Lactic Acid Bacteria
A A C C 0 10 20 30 40 50 2 2.5 3 3.5 4 4.5 5 5.5 6
Lactic acid bacteria
Without remark False negative Outlier log 10 CFU per ml N u mb er o f resu lts 4.424 0 10 20 30 40 50 2 2.5 3 3.5 4 4.5 5 5.5 6
Lactic acid bacteria
MRS MRS-aB MRS-S Rogosa Petrifilm LAB TEMPO LAB Other log 10 CFU per ml N u mb er o f resu lts 4.424 0 10 20 30 40 50 2 2.5 3 3.5 4 4.5 5 5.5 6
Lactic acid bacteria
Without remark False negative Outlier log 10 CFU per ml N u mb er o f resu lts 4.242 * 0 10 20 30 40 50 2 2.5 3 3.5 4 4.5 5 5.5 6
Lactic acid bacteria
MRS MRS-aB MRS-S Rogosa Petrifilm LAB TEMPO LAB Other log 10 CFU per ml N u mb er o f resu lts 4.242 *
Clostridium perfringens
Mixture A
No target organism was present in the mixture. All laboratories reported a correct negative result.
Mixture B
The strain of C. perfringens was target organism. Two low outliers were reported, as well as one false negative result.
Mixture C
No target organism was present in the mixture. However eight false positive results were reported. The concentrations of the false positive results corresponded to that of
C. bifermentans in the mixture (log10 2.494 cfu ml-1). At the National Food Agency, the
strain of C. bifermentans formed black colonies on tryptose sulphite cycloserine agar (TSC). It could however be distinguished from C. perfringens in subsequent confirmation, since the strain was motile and did not ferment lactose. Five of the eight laboratories that reported a false negative result stated they performed some kind of confirmation.
General remarks
As in previous proficiency testing rounds most laboratories followed either NMKL 95:2009 (63 %) or ISO 7937:2004 (25 %). Two and one laboratory followed the older NMKL 95:2006 and NMKL 95:1997, respectively. Two other laboratories stated following NMKL 56 (Sulphite-reducing Clostridia). This method includes detection of
C. perfringens by referring to the confirmation tests in NMKL 95. ISO 7937:2004 was
last reviewed by ISO in 2015 and remains current. It is however scheduled to be replaced by ISO 15213-2 (”Enumeration of Clostridium perfringens by colony-count technique”), which is currently under development. No differences could be seen in the results from the different methods that were used.
ISO 7937:2004 prescribes a pour-plate method with TSC, while NMKL 95 prescribes surface-spreading on mCP and/or pour-plating with TSC. The majority of the laboratories (89 %) reported using TSC. On TSC, C. perfringens form black colonies after anaerobic incubation at 37 °C. Suspected and typical colonies are in NMKL 95:2009 confirmed with a motility test and a test for lactose fermentation.
C. perfringens are non-motile and form acid and gas as a consequence of lactose
fermentation. The method for confirmation is similar in ISO 7937:2004. In total, 92 % of the laboratories stated performing some kind of confirmation. The low number of laboratories that did not confirm makes it difficult to determine if this had an effect on the overall result. Similar results do however appear to have been reported regardless if a confirmation was performed or not.
Two of the laboratories that followed NMKL 95:2009 incubated on mCP. This medium was previously used in some countries for membrane filter analyses of drinking water. In such analyses, mCP has sometimes been found to result in lower recovery of
C. perfringens compared to TSC (2, 3, 4). Comparative studies on food analyses have
also advocated the use of TSC as the preferred medium for detecting C. perfringens (5, 6). The results for mCP – but also for sulphite cycloserine agar (SC) – also appear to be somewhat lower than the overall mean value. These media where at the same time used
by only two laboratories each, which makes it difficult to come to a definite conclusion based on this observation.
The majority of the laboratories (92 %) incubated at 37 °C. The remaining five laboratories incubated at 44 °C. The low number of laboratories that incubated at 44 °C makes it difficult to draw conclusions on the effect of the incubation temperature on the outcome – especially since three of the five laboratories did not perform a confirmation.
Results from analysis of Clostridium perfringens
Method N Mixture A Mixture B Mixture C n m s F < > n m s F < > n m s F < > All results 63 63 - - 0 - - 61 2.763 0.349 1 2 0 55 - - 8 - - TSC 56 56 - - 0 - - 55 2.812 0.318 1 1 0 48 - - 8 - - mCP 2 2 - - 0 - - 1 - - 0 1 0 2 - - 0 - - SC 2 2 - - 0 - - 2 - - 0 0 0 2 - - 0 - - ISA 2 2 - - 0 - - 2 - - 0 0 0 2 - - 0 - - CPC 1 1 - - 0 - - 1 - - 0 0 0 1 - - 0 - - B B 0 5 10 15 20 25 1 1.5 2 2.5 3 3.5 4 4.5 5 Clostridium perfringens Without remark False negative Outlier log 10 CFU per ml N u mb er o f resu lts 2.763 * 0 5 10 15 20 25 1 1.5 2 2.5 3 3.5 4 4.5 5 Clostridium perfringens TSC mCP SC ISA CPC log 10 CFU per ml N u mb er o f resu lts 2.763 *
Anaerobic sulphite-reducing bacteria
Mixture ANo target organism was present in the mixture. Two laboratories reported a false positive result.
Mixture B
The strain of C. perfringens was target organism. One high outlier was reported, as well as four false negative results.
Mixture C
The strain of C. bifermentans was target organism. Two low and two high outliers were reported, as well as four false negative results.
General remarks
As in previous proficiency testing rounds most laboratories followed a version of NMKL 56. However only a few laboratories (10 %) reported following the new NMKL 56:2015. Instead, most still followed NMKL 56:2008 (52 %) or the significantly older NMKL 56:1994 (4 %). In comparison, ISO 15213:2003 was followed by 15 % of the laboratories. This was last reviewed by ISO in 2015 and remains current. It is however scheduled to be replaced by ISO 15213-1 (”Enumeration of sulphite-reducing
Clostridium spp. by colony-count technique”), which is currently under development.
Two laboratories followed ISO 7937:2004 (”Horizontal method for the enumeration of
Clostridium perfringens”), which will be replaced by the future ISO 15213-2
(”Enumeration of Clostridium perfringens by colony-count technique”). Regardless, no differences could be seen in the results from the different methods that were used.
Both NMKL 56:2015 and ISO 15213:2003 prescribe pour-plate methods with iron sulphite agar (ISA). ISA was also the medium most frequently used by the laboratories. Black colonies on ISA (possibly surrounded by a black zone) are considered as sulphite-reducing bacteria. The black colour of the colonies comes from iron sulphide, which is formed as a precipitate of Fe3+ in the medium and H2S that is produced by the reduction
of sulphite. Growth of anaerobic bacteria that only produce hydrogen (and not H2S) may
sometimes result in a diffuse an unspecific blackening of the medium.
In addition to ISA, laboratories also reported using tryptose sulphite cycloserine agar (TSC), Shahidi-Ferguson Perfringens agar (SFP), Perfringens agar base (PAB) and tryptose sulphite agar (TS). These media are often used when identifying
C. perfringens, and it should therefore be mentioned that for that purpose, colonies
should be confirmed using the methods in for example NMKL 95. There was however no apparent difference in the results for laboratories that used these media.
Results from analysis of anaerobic sulphite-reducing bacteria.
Method N Mixture A Mixture B Mixture C
n m s F < > n m s F < > n m s F < > All results 73 71 - - 2 - - 67 2.708 0.246 4 0 1 64 2.314 0.310 4 2 2 ISA 31 31 - - 0 - - 26 2.632 0.242 3 0 1 27 2.310 0.335 2 1 0 TSC 18 17 - - 1 - - 17 2.796 0.196 1 0 0 17 2.354 0.279 0 0 1 SFP 13 13 - - 0 - - 13 2.718 0.293 0 0 0 10 2.238 0.349 1 1 1 PAB 3 3 - - 0 - - 3 - - 0 0 0 3 - - 0 0 0 TS 2 2 - - 0 - - 2 - - 0 0 0 2 - - 0 0 0 Other* 6 5 - - 1 - - 6 2.841 0.208 0 0 0 5 2.225 0.335 1 0 0
* The group Other mainly includes laboratories with unclear or ambiguous reporting of the medium.
B B C C 0 5 10 15 20 0 0.5 1 1.5 2 2.5 3 3.5 4
Anaerobic sulphite-reducing bacteria
Without remark False negative Outlier log 10 CFU per ml N u mb er o f resu lts * 2.708 0 5 10 15 20 0 0.5 1 1.5 2 2.5 3 3.5 4
Anaerobic sulphite-reducing bacteria
ISA TSC SFP PAB TS Other log 10 CFU per ml N u mb er o f resu lts * 2.708 0 5 10 15 20 0 0.5 1 1.5 2 2.5 3 3.5 4
Anaerobic sulphite-reducing bacteria
Without remark False negative Outlier log 10 CFU per ml N u mb er o f resu lts * 2.314 0 5 10 15 20 0 0.5 1 1.5 2 2.5 3 3.5 4
Anaerobic sulphite-reducing bacteria
ISA TSC SFP PAB TS Other log 10 CFU per ml N u mb er o f resu lts * 2.314
Aerobic microorganisms in fish products, 20-25 C
Mixture AThe strains of L. plantarum and E. coli were present in the highest concentrations and thus most colonies were from these species. One low outlier was reported.
Mixture B
The strains of S. putrefaciens and S. aureus were present in the highest concentrations and thus most colonies were from these species. During quality control at the National Food Agency the parameter did not fulfil the requirements for homogeneity, and a larger than usual distribution of the results could thus be expected. No values have therefore been considered as outliers. Laboratories with results lower than log10 3.0
cfu ml-1 should however still consider repeating the analysis. No false negative results were reported.
Comment: All results in mixture B are considered correct. The results are not statistically evaluated. Therefore, no z-scores have been calculated for the results, and they are also not included in the tables located below the box plots.
Mixture C
The strains of H. alvei and C. piscicola were present in the highest concentrations and thus most colonies were from these species. Two low and one high outlier was reported. General remarks
Most laboratories (86 %) followed the method for aerobic microorganisms and spoilage organisms in fish and fish products, NMKL 184:2006. This prescribes a pour-plate method with iron agar (IA), which was also the medium most frequently used by the laboratories (86 %). Two laboratories followed ISO 4833-1:2013 (“Colony count at 30 °C by the pour plate technique”) and thus incubated on PCA. Two laboratories followed NMKL 86 (”Aerobic microorganisms in food”). Though this method is adapted for use in all types of food, it also refers to NMKL 184:2006 when analysing fish and fish products. One laboratory followed NMKL 96:2003, which uses the same method for total aerobic count as NMKL 184:2006. However, NMKL 96:2003 has been replaced by NMKL 96:2009 (”Coliform bacteria, thermotolerant coliform bacteria and
E. coli”) which refers to NMKL 184:2006 for the analysis of total aerobic count in fish
and seafood.
It could here be mentioned that NMKL 184:2006 also describes incubation on Long & Hammer agar for the detection of psychrotrophic and heat-sensitive microorganisms. With this medium, incubation is done at 15 °C, which may be advantageous when analysing fresh minced fish meat or lightly preserved fish products.
Since the majority of the laboratories followed NMKL 184:2006 and used IA, no differences between methods and media have been identified.
Results from analysis of aerobic microorganisms in fish products.
Method N Mixture A Mixture B* Mixture C
n m s F < > n m s F < > n m s F < > All results 35 34 4.504 0.215 0 1 0 35 3.942 0.510 0 0 0 32 4.625 0.131 0 2 1 NMKL 184:2006 30 29 4.472 0.190 0 1 0 30 3.907 0.539 0 0 0 28 4.635 0.117 0 2 0 ISO 4833-1:2013 2 2 - - 0 0 0 2 - - 0 0 0 2 - - 0 0 0 NMKL 86:2013 1 1 - - 0 0 0 1 - - 0 0 0 1 - - 0 0 0 NMKL 86:2006 1 1 - - 0 0 0 1 - - 0 0 0 0 - - 0 0 1 NMKL 96:2003 1 1 - - 0 0 0 1 - - 0 0 0 1 - - 0 0 0
* The results for mixture B are not evaluated.
A A B B C C 0 2 4 6 8 10 12 14 2 2.5 3 3.5 4 4.5 5 5.5 6
Aerobic microorganisms in fish products, 20-25 °C
Without remark False negative Outlier log 10 CFU per ml N u mb er o f resu lts 4.504 * 0 2 4 6 8 10 12 14 2 2.5 3 3.5 4 4.5 5 5.5 6
Aerobic microorganisms in fish products, 20-25 °C
NMKL 184:2006 ISO 4833-1:2013 NMKL 86:2013 NMKL 86:2006 NMKL 96:2003 log 10 CFU per ml N u mb er o f resu lts 4.504 * 0 2 4 6 8 10 12 14 2 2.5 3 3.5 4 4.5 5 5.5 6
Aerobic microorganisms in fish products, 20-25 °C
Without remark False negative Outlier log 10 CFU per ml N u mb er o f resu lts * 3.942 0 2 4 6 8 10 12 14 2 2.5 3 3.5 4 4.5 5 5.5 6
Aerobic microorganisms in fish products, 20-25 °C
NMKL 184:2006 ISO 4833-1:2013 NMKL 86:2013 NMKL 86:2006 NMKL 96:2003 log 10 CFU per ml N u mb er o f resu lts * 3.942 0 2 4 6 8 10 12 14 2 2.5 3 3.5 4 4.5 5 5.5 6
Aerobic microorganisms in fish products, 20-25 °C
Without remark False negative Outlier log 10 CFU per ml N u mb er o f resu lts 4.625 0 2 4 6 8 10 12 14 2 2.5 3 3.5 4 4.5 5 5.5 6
Aerobic microorganisms in fish products, 20-25 °C
NMKL 184:2006 ISO 4833-1:2013 NMKL 86:2013 NMKL 86:2006 NMKL 96:2003 log 10 CFU per ml N u mb er o f resu lts 4.625
H
2S-producing bacteria in fish products
Mixture A
No target organism was present in the mixture. One laboratory reported a false positive result.
Mixture B
The strain of S. putrefaciens was target organism. During quality control at the National Food Agency the parameter did not fulfil the requirements for homogeneity, and a larger than usual distribution of the results could thus be expected. No values have therefore been considered as outliers. No false negative results were reported.
Comment: All results in mixture B are considered correct. The results are not statistically evaluated. Therefore, no z-scores have been calculated for the results, and they are also not included in the tables located below the box plots.
Mixture C
The strain of H. alvei was target organism. Four low outliers were reported. General remarks
The majority of the laboratories (94 %) followed the method for aerobic microorganisms and spoilage organisms in fish and fish products, NMKL 184:2006. This prescribes a pour-plate method with iron agar (IA), which was also the medium most frequently used by the laboratories (94 %). One laboratory followed ISO 4833-1:2013 (“Colony count at 30 °C by the pour plate technique”) and thus incubated on PCA, which is not correct for this analysis. One laboratory followed NMKL 96:2003 (“Bacterial examinations in fresh and frozen seafood”), which includes analysis of H2
S-producing bacteria. However the laboratory incubated in lauryl sulphate broth, which is incorrect. Further, NMKL 96:2003 has been replaced by NMKL 96:2009 (”Coliform bacteria, thermotolerant coliform bacteria and E. coli”) which refers to NMKL 184:2006 for the analysis of aerobic count and spoilage bacteria in fish and seafood.
Since the majority of the laboratories followed NMKL 184:2006 and used IA, no differences between methods and media have been identified.
Results from analysis of H2S-producing bacteria in fish products.
Method N Mixture A Mixture B* Mixture C
n m s F < > n m s F < > n m s F < >
All results 34 33 - - 1 - - 34 3.202 0.337 0 0 0 30 4.284 0.104 0 4 0
NMKL 184:2006 32 31 - - 1 - - 32 3.210 0.317 0 0 0 29 4.289 0.102 0 3 0
ISO 4833-1:2013 1 1 - - 0 - - 1 - - 0 0 0 0 - - 0 1 0
NMKL 96:2003 1 1 - - 0 - - 1 - - 0 0 0 1 - - 0 0 0
B B C C 0 2 4 6 8 10 12 14 2 2.5 3 3.5 4 4.5 5 5.5 6 H
2S-producing bacteria in fish products
Without remark False negative Outlier log 10 CFU per ml N u mb er o f resu lts 3.202 0 2 4 6 8 10 12 14 2 2.5 3 3.5 4 4.5 5 5.5 6 H
2S-producing bacteria in fish products
NMKL 184:2006 ISO 4833-1:2013 NMKL 96:2003 log 10 CFU per ml N u mb er o f resu lts 3.202 0 2 4 6 8 10 12 14 2 2.5 3 3.5 4 4.5 5 5.5 6 H
2S-producing bacteria in fish products
Without remark False negative Outlier log 10 CFU per ml N u mb er o f resu lts 4.284 0 2 4 6 8 10 12 14 2 2.5 3 3.5 4 4.5 5 5.5 6 H
2S-producing bacteria in fish products
NMKL 184:2006 ISO 4833-1:2013 NMKL 96:2003 log 10 CFU per ml N u mb er o f resu lts 4.284
Yeasts and moulds
Mixture AThe strain of K. marxianus was target organism for the analysis of yeasts. Five high outliers were reported, as well as 18 false negative results. The strain of K. marxianus has in previous proficiency testing rounds been observed to form very small colonies on dichloran Rose-Bengal chloramphenicol agar (DRBC) and on dichloran glycerol agar (DG18). Laboratories that incubated on DG18 reported lower results compared to laboratories that used other media, and they also reported more false negative results. The false results associated with DG18 could however not be attributed to the use of a specific method. A disproportionally high number of false negative results were also reported by laboratories that used Petrifilm RYM and Petrifilm YM. This has not previously been observed for the strain of K. marxianus when using Petrifilm, and could thus possibly be simply due to chance.
The strain of P. verrucosum was target organism for the analysis of moulds. Seven low and three high outliers were reported, as well as nine false negative results. None of these could be associated with the use of a specific method or medium.
Mixture B
The strain of H. uvarum was target organism for the analysis of yeasts. One high and five low outliers were reported, as well as two false negative results. In contrast to mixture A, the results for yeasts were more similar between the different media.
The mixture did not contain a target organism for the analysis of moulds. Six false positive results were reported, all of which were from different media.
Mixture C
The mixture did not contain a target organism for the analysis of yeasts. Five false positive results were reported, all of which were from different media. In addition, one of the false results was from a laboratory that reported a combined value for yeasts and mounds.
A strain of P. verrucosum (not identical to that in mixture A) was target organism for the analysis of moulds. Nine low and two high outliers were reported, as well as ten false negative results. Here as well the outliers and false results were fairly evenly distributed among the various methods and media.
General remarks
In principle the same laboratories analysed both yeast and moulds, and with identical methods in both analyses. The methods consisted of NMKL 98:2005, ISO
6611:2004 / IDF 94:2004, 3M™ Petrifilm™ and ISO 21527-1:2008 / ISO
21527-2:2008. Four laboratories followed ISO 7954:1987 (”General guidance for enumeration of yeasts and moulds”), which has been replaced by ISO 21527-1:2008 and ISO 21527-2:2008.
NMKL 98:2005 prescribes the use of either DRBC, DG18 or oxytetracyklin glucose yeast extract agar (OGYE). ISO 6611:2004/IDF 94:2004 describes the enumeration of yeasts and moulds in milk and milk products, and is based on a pour-plate method with OGYE or yeast extract glucose chloramphenicol agar (YGC). With ISO 21527 different media are used depending on the water activity (aw) of the food that is analysed, and
ISO 21527-1:2008 therefore uses DRBC while ISO 21527-2:2008 uses DG18. In general, DRBC is recommended for fresh foods with aw > 0,95 (e.g. fruit, vegetables,