The Department of Physics, Chemistry and Biology
Master of Science in Biomedical Engineering
Efficient Characterization of Short Anelloviruses
Fragments Found in Metagenomic Samples
Thabit Alabsi
LITH-IFM-A-EX--12/2711--SE
Linköping 2012
TEKNISKA HÖGSKOLAN
LINKÖPINGS UNIVERSITET
Abstract
Some viral metagenomic serum samples contain a huge amount of Anellovirus, which is a genetically diverse family with a few conserved regions making it hard to efficiently characterize. Multiple sequence alignment of the Anelloviruses found in the sample must be constructed to get a clear picture of Anellovirus diversity and to identify stable regions. Using available multiple sequence alignment software directly on these fragments results in an MSA of a very poor quality due to their diversity, misaligned regions and low-quality regions present in the sequence.
An efficient MSA must be constructed in order to characterize these Anellovirus present in the samples. Pairwise alignment is used to align one fragment to the database sequences at a time. The fragments are then aligned to the database sequences using the start and end position from the pairwise alignment results. The algorithm will also exclude non-aligned portions of the fragments, as these are very hard to handle properly and are often products of misassembly or chimeric sequenced fragments. Other tools to aid further analysis were developed, such as finding a non-overlapping window that contains the most fragments, find consensus of the alignment and extract any regions from the MSA for further analysis. An MSA was constructed with a high percent of correctly aligned bases compared to an MSA constructed using MSA softwares. The minimal number of genomes found in the sampled sequence was found as well as a distribution of the fragments along the database sequence. Moreover, highly conserved region and the window containing most fragments were extracted from the MSA and phylogenetic trees were constructed for these regions.
Acknowledgements
I would like to express my gratitude to my supervisor Fredrik Lysholm, for his guidance throughout my thesis works. He provided me with all the resources I needed, and he was always available to edit and comment on my work. I would also like to thank Professor Bengt Persson for being my examiner.
I would also like to thank my wife, Fatima, for her motivation, patience and support during my master’s program and thesis work. Moreover, I am sincerely grateful to my father and mother for supporting, motivating and guiding me thought out my studies, and for always being there for me. Finally, I would like to thank my brothers and sisters for their support and Abdulrahman Alwan for revising my thesis.
Table of Contents
Abstract --- I Acknowledgements --- II List of Figures --- VI List of Tables --- VIII List of Abbreviations --- IX
1 Introduction --- 1
1.1 Background --- 1
1.2 Bioinformatic Approach --- 2
1.3 Outline of the Thesis --- 2
2 Theoretical Background --- 3
2.1 Biological Background --- 3
2.1.1 Biological Sequences --- 3
2.1.1.1 DNA and RNA --- 3
2.1.4 Metagenomics --- 6
2.1.5 Anelloviruses and TTV --- 6
2.2 Roche 454 Sequencer --- 7
2.3 Sequence Analysis Tool --- 8
2.3.1 Pairwise Sequence Alignment --- 8
2.3.2 Multiple Sequence Alignment --- 9
2.3.3 Phylogenetic trees --- 9 3 Methods --- 11 3.1 Dataset simulator --- 11 3.2 Search Phase --- 12 3.3 Construct MSA--- 13 3.4 Window Finder --- 15 3.5 Extract MSA --- 16 4 Results --- 18
4.1 Evaluation of performance using simulated data --- 18
4.2 Evaluation of performance using real data --- 20
4.3 TTV population results in real data --- 22
4.4 Phylogenetic tree --- 23
5 Discussion --- 27
5.1 Methods --- 27
6 Conclusion --- 30 Bibliography --- 31
List of Figures
Figure 1. The structure of RNA and DNA. --- 4
Figure 2. A pairwise sequence alignment of two sequences using BLASTN . --- 8
Figure 3. Sequences unaligned (top), sequence aligned using MSA (bottom). --- 9
Figure 4. Three different types of phylogenetic trees . --- 10
Figure 5. Algorithm used to construct the MSA of the fragments and genome seqeunces. --- 11
Figure 6. Sequences mutation’s method used. --- 12
Figure 7. An overview of search and MSA construction phase. --- 14
Figure 8. The approach used to find the number of fragments present in each window. --- 16
Figure 9. MSA of the dataset generator fragments using MUSCLE. --- 19
Figure 10. MSA of the dataset generator fragments using BLAST mapping. --- 20
Figure 11. MSA of real data using MUSCLE. --- 21
Figure 12. MSA of real data using BLAST mapping. --- 22
Figure 13. Distribution of fragments in the MSA while the bases lacking a position are removed. -- 22
Figure 14. Distribution of fragments in the MSA while the bases lacking a position are micro-aligned and inserted. --- 23
Figure 15. The distribution of the fragments covering a window of size 100. Bases lacking a position are micro-aligned and inserted. --- 23
Figure 16. Phylogenetic tree of a conserved region, where bases lacking a database positions are removed. --- 24 Figure 17. Phylogenetic tree of a conserved region, where bases lacking a database positions are micro-aligned and inserted.--- 24 Figure 18. Phylogenetic tree of the non-overlapping window containing most aligned fragments, where bases lacking a database positions are deleted. --- 25 Figure 19. Phylogenetic tree of the non-overlapping window containing most aligned fragments, where bases lacking a database positions are micro-aligned and inserted. --- 26
List of Tables
Table 1. Genetic code used in translating DNA sequence to protein . --- 5
Table 2. Result of the performance evaluation from five different simulated sets, 1000 fragments each. --- 19
Table 3. Comparison between the MSA aligned by MUSCLE and BLAST mapping. --- 19
Table 4. Result of real data performance evaluation for different modes. --- 21
List of Abbreviations
BLAST Basic local alignment search tool
CCD Charge-coupled device
DNA Deoxyribonucleic acid
dsRNA Double strands ribonucleic acid
FASTA Fast ALL
MSA Multiple sequence alignment
MUSCLE Multiple sequence comparison by log-expectation
PCR Polymerase chain reaction
RNA Ribonucleic acid
rRNA Ribosomal ribonucleic acid
TTMV Torque teno mini virus
TTV Torque teno virus
1
Introduction
1.1 Background
Viral enriched metagenomic serum samples occasionally contain vast amounts of Anellovirus, which are notoriously hard to efficiently characterize. The major source of these problems is; Anellovirus is a very prevalent, is genetically diverse and does not contain many conserved regions. As a result, considering a single metagenomic sample; there are often thousands of partially covered isolates, with a lot of diversity between isolates. Therefore, to get a clear representation of the diversity in such samples, and to identify stable regions, it is important to construct a multiple sequence alignment (MSA) of the Anelloviruses found in the sample. However, creating MSA of fragments and database sequences by using MSA softwares directly is very hard. As MSA software are optimized towards working with complete sequences where a gap is a true evolutionary event, the MSA software evaluated in this study performed very poorly and produce nonsense MSAs. Moreover, factors such as misaligned regions and low-quality regions in the sequence fragments also affect the final quality of the MSA. Therefore, a novel efficient algorithm for constructing an MSA must be constructed to address this issue. The main aims with constructing the algorithm in this thesis are:
• To determine the minimal number of genomes present in the sequenced samples as well as potentially provide an upper estimate, assuming a reasonable coverage. • To be able to analyze the well-covered sub-sections of the sample, for example
phylogenetically.
• To be able to analyze conserved regions in order to find efficient polymerase chain reaction (PCR) primers, either to be used to detect a given sub-set of Anellovirus or to amplify full-genome sequences.
1.2 Bioinformatic Approach
To be able to efficiently characterize Anelloviruses present in the sample, an efficient MSA must be constructed. Pairwise alignment (BLAST) is used to align the fragments to the database sequences, one at a time. Fragments successfully aligned using BLAST are then used to manually align those positions to the database sequences using the positions provided by BLAST. Furthermore, other tools are developed to extract parts of the sequence for further analysis.
1.3 Outline of the Thesis
The second section contains a brief biological background as well as the bioinformatic tools that will be used in the thesis. Methods are the third section, where the approach used to address the problem is described. The fourth section presents the results of the thesis and the fifth section is where methods and results are discussed. Finally, the last section is a conclusion.
2
Theoretical Background
2.1 Biological Background
This section presents a brief introduction to biological sequences (RNA, DNA and proteins). Furthermore, the terms genomes, genomics and metagenomics are briefly introduced. Finally, anellovirus is introduced, as well as its types and characteristics.
2.1.1 Biological Sequences
Biological sequences are polymers composed of a molecular chain of nucleic acids or amino acids. There are three types of biological sequences; deoxyribonucleic acid (DNA), ribonucleic acid (RNA), and protein. The DNA and RNA are made up of nucleic acids, while protein is made up of amino acids. DNA contains the heredity information and genetic instruction that are necessary for creating and maintaining organisms. Proteins are generated according to the instructions in DNA, where the DNA is first transcribed into RNA, and then RNA is translated into protein. These sequences are further explained in the following paragraphs.
2.1.1.1 DNA and RNA
The first discovery of DNA was by Friedrich Miescher in 1869, however, at the time, it was not known that it contains heredity information. After years of DNA research, specifically in 1929, Phoebus Levene was the first to find out that DNA is a connected chain of nucleic acids (nucleotides). The four nucleotides, adenine (A), cytosine (C), guanine (G), and thymine (T) are the main building blocks of DNA. An example of a string of DNA would be “CGATTATCG”. In 1952, Alfred Hershey and Martha Chase proved that DNA is a genetic material by using bacteriophage T2 viruses (Dahm, 2005).
Using an X-ray diffraction method, James Watson and Francis Crick showed that DNA is a double helix strands of nucleotides, and nucleotides on each strand is linked to nucleotides on the other strand as shown in Figure 1. It was also shown by them that the nucleotide (A) is linked to (T) and (C) is always linked to (G), which means that the strands are complementary to each other (Dahm, 2005). This gave the basics understanding of how DNA can be replicated, that is to unlink the two strands and building a new strand by linking the complementary nucleotides to the template DNA strands. Moreover, from the DNA structure it is shown that nucleotides in each strand have a direction opposite to the other strand, i.e. they are not parallel, and each strand has two ends named as 5’ and 3’. DNA sequence is always read from 5’ end to 3’ end, for instance, if we have two sequences that are 5’ A-T-T-C-G-G-C-A 3’ and 3’ C-T-A-G-T-C-T 5’, they must be read as ATTCGGCA and TCTGATC respectively.
Figure 1. The structure of RNA and DNA1.
Genetic material is not only stored in DNA, but it can also be stored in RNA, for example in RNA-viruses. RNA is similar to DNA, but they have few differences mentioned below:
• DNA contains deoxyribose, while RNA contains ribose. • Thymine (T) is not used in RNA, uracil (U) is used instead.
• Structure difference, where most RNAs are single strands rather than double strands. However, there are some RNAs made of double strands called dsRNA which can be found in plant, fungi, bacteria, and animal viruses (Libonati, Carsana, & Furia, 1980).
RNA can fold itself and thus change its shape, and nucleotides within the same RNA can be paired together. Moreover, in RNA, (A) is paired to (U) and (C) is always paired to (G).
2.1.1.2 Protein
Proteins are essential elements in living organisms. Its functions include supporting cells and tissues mechanically, transports and stores small molecules, and signal transmitters between cells. Proteins are made up of a chain of amino acids, also named as peptide, that are connected to each other by covalent bonds. There are 20 amino acids2 that can make up
proteins, and each kind of protein has its own specific amino acid sequence string that differs from other kinds of proteins. These proteins or amino acid chains can fold, thus creating different 3D structures; the function of the protein is usually determined by its 3D structure (Alberts, et al., 2004).
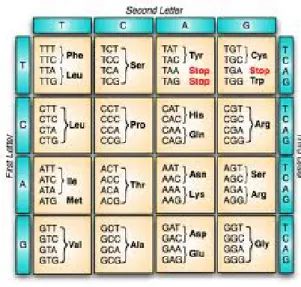
Table 1. Genetic code used in translating DNA sequence to protein 3.
Proteins are generated according to instructions contained in the DNA. DNA is first transcribed into mRNA in the nucleus, and then moved to ribosomes where it is translated into its corresponding protein. From the DNA sequence, a set of three nucleotides gives a specific amino acid, called codons. To ensemble a protein, each codon in the sequence is translated into an amino acid and this process will repeat adding amino acid molecules to the chain until the last or stop codon is reach, the translation is done according to the
2 There are 20 common amino acids, while there are in fact a lot more.
genetic code shown in table 1. A simple example of how a specific sequence is translated into a protein is AAT CCT ACG GTA is translated to Asn-Pro-Thr-Val.
2.1.2 Genomes
DNA is present in all living organisms; it usually contains information about that organism. Genomes are a group of genes and DNA elements (that are not used for coding) of organisms. Genomes contain the whole heredity and biological information of organisms defining the organism identity. There is size variation of genomes of different organisms, starting with 10 genes for some viruses to as large as tens of thousands of genes for homo sapiens containing billions of DNA nucleotides. According to Lightner, the human genome was sequenced with a 3 billion base pairs (Lightner, 2008). Currently, genomes of many living organisms have been sequences, such as, viruses, fungi, plants and humans. Genomes can be obtained by using third generation DNA sequencers, and it is represented by the four nucleotide bases “A,T,C,G” (Pevsner, 2009). These genomes are studied with the help of bioinformatics to analyze them, and know more about their organization and function.
2.1.3 Genomics
Genomics is a field that studies organisms’ whole genome instead of studying a single gene. Moreover, it studies the interactions between genes in an organism genome. Furthermore, some complicated diseases that are caused by a mixture of environmental and genetic reasons rather than a gene; for that reason genomics can be used to study these diseases. Genomics is mostly concerned with the “A,C,T,G” and “A,C,G,U” letter representation of the genome sequence of DNA and RNA respectively. (National Human Genome Research Institute, 2012) (Libonati, Carsana, & Furia, 1980).
2.1.4 Metagenomics
Metagenomics is the study of microbial population taken from their natural environment, such as human body, soil sample or rivers etc., by using genomics. It was first used in 1985 by Norman Pace and colleagues to study ribosomal RNA (rRNA) sequences (Pace, Stahl, Lane, & Olsen, 1985). Unlike genomics - which aims to sequence just one genome, metagenomics’ aim is to sequence genomes of all species present in the community.
different analysis method. Okamoto and colleagues named the virus as TT virus following the name of that patient, and suspected it as the causes of non-hepatitis liver infection. Further studies, made by the same group and other groups, revealed huge divergent genetic types of TTVs as well as related viruses of small genomes called TTV-like mini virus and TTV-like midi viruses. Moreover studies showed that these viruses could also be found in animal species. Anelloviruses are known to be very prevalent and genetically diverse (Maggi & Bendinelli, 2010).
TTV was renamed to torque teno virus (which is translated in Latin to necklace and thin, respectively) due to its structure, thus, also renaming other TTV-related virus such as torque teno mini viruses (TTMV) and torque teno midi viruses (TTMDV). Researches stated that TTV and TTMV are circular, with a diameter of 30 nm, and non-enveloped, but TTMDV are not yet determined. Moreover, they are single-stranded circular molecule DNA composed of 3.5-3.9 kb for TTV, 3.1-3.2 kb for TTMDV and 2.7-2.9 kb in TTMV (Bendinelli & Bonis , 2011) (Maggi & Bendinelli, 2010).
2.2 Roche 454 Sequencer
Roche 454 sequencer is one of the next generation sequencers that is capable of sequencing 400-600 megabases of DNA in 10 hours, and it is known to produce accurate and long sequence reads (Voelkerding, Dames , & Durtschi , 2009). It is based on sequencing by synthesis, where the incorporation of nucleotides causes the release of pyrophosphate, which is detected by the system. This technique is called pyrosequencing. The system depends on adhering adapter-ligated DNA fragments to DNA-capture beads in a water-in-oil emulsion. The adapter-ligated DNA is amplified, and then each bead is placed in a fiber optic chip.
Library beads are added to a DNA Bead Incubation Mix and are layered with enzyme beads onto chip device. The beads are then placed into the reaction wells by centrifuging the device. The chip is then inserted into the sequencer where nucleotides are added across the device chip (each nucleotide at a time is repeatedly cycled over the chip, usually in the order of TCAG). As a template strand complementary nucleotide is added to the well, the polymerase extends the DNA strand by adding the nucleotides. The more nucleotides are added, the more light will be generated. The light intensity is then recorded by a CCD camera and stored. Finally, the light intensity for each cycle of added nucleotides is analyzed and the sequence of each reactor well is deduced (454 Life Sciences Corporation).
2.3 Sequence Analysis Tool
In this section, bioinformatic tools that are used in this thesis will be discussed. Pairwise sequence alignment will be introduced, followed by multiple sequence alignment and phylogenetic trees.
2.3.1 Pairwise Sequence Alignment
Pairwise sequence alignment is a tool used to align two DNA or protein sequences and to measure how related the sequences are to each other. A well-used derived measurement is percent identity, that is how many percent identical nucleotide or amino acids are lined up with each other in the alignment. Moreover it is a useful tool for quantifying evolutionary changes. There are two major types of pairwise alignment algorithms, global and local alignment. Global alignment aligns the whole sequence, that is an optimization where all regions of the sequence are checked if they match or not. On the other hand, the local alignment aligns the regions that are highly similar in the two sequences and disregards the regions that are not similar.
BLAST (Basic Local Alignment Search Tool) is one of the most popular and widely used algorithms/tools to calculate sequences similarity. It uses heuristics to calculate the optimal local alignment (Altschul, Gish, Miller, Myers, & Lipman, 1990). Searching a sequence using BLAST against a sequences’ database give the top hits of that sequence, and displays the score (S), percent identity, expected value (statistical measure of the significance of the alignment), and the alignment of the sequences. BLAST can align DNA against DNA (blastn), protein against protein (blastp), translated DNA against protein (blastx), and translated DNA against translated DNA (tblastx). Figure 2 shows two sequences aligned using pairwise alignment, where a gap was inserted in S2 to maximize the score of the alignment.
2.3.2 Multiple Sequence Alignment
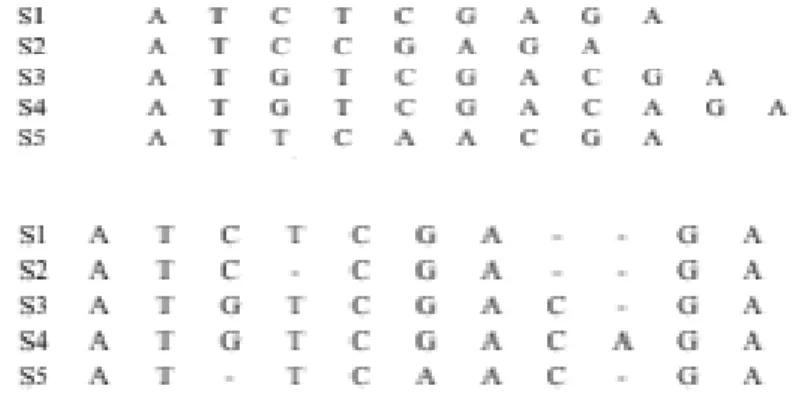
Pairwise sequence alignment can align only two sequences (protein or DNA). However, there is a need for a more complex algorithm to align more than two sequences to find out the evolutionary relationship between sequences that are of a common ancestor. This can be achieved by multiple sequence alignment (MSA) algorithms, which align more than two sequences. Moreover, MSA can be used as a basis to calculate a phylogenetic tree of the sequences, hence finding sequences’ evolutionary relationships. MSA algorithms use different ways to search for alignments, where some use global alignment, local alignment or heuristic, however most approaches are based on heuristic search. Figure 3 (top) shows five unaligned sequences, and figure 3 (bottom) shows the five sequences after constructing an MSA of the sequences. It is shown in the figure that gaps were inserted in specific positions in order to maximize bases matches in all sequences. Tools available for MSA are, for example, Clustal and multiple sequence comparison by log-expectation (MUSCLE).
Figure 3. Sequences unaligned (top), sequence aligned using MSA (bottom)5.
2.3.3 Phylogenetic trees
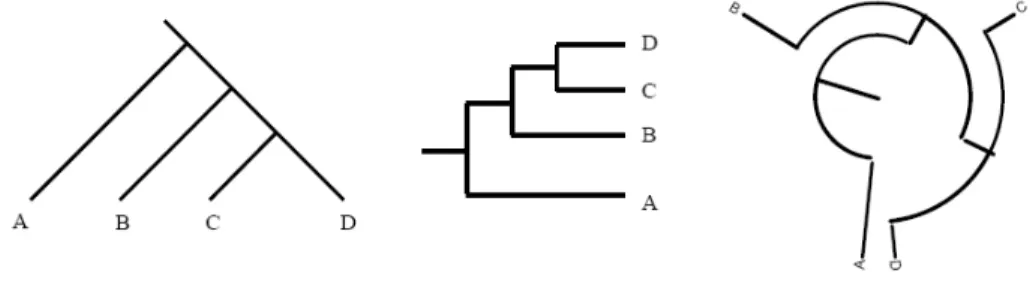
Phylogenetic tree is a diagram used to present the evolutionary relationships between two or more organisms or genes from common ancestors based on differences and similarities in the physical and genetic characteristics. The diagram is usually made of branching lines similar to trees and its branches. According to Baum “Phylogenies are useful for organizing knowledge of biological diversity, for structuring classifications, and for providing insight into events that occurred during evolution” (Baum, 2008).
Phylogenetic trees can be constructed by the help of computer software, using an MSA of the sequences. Phylogenetic trees can have different types or representations; however, they will contain the same information in all types. Three different types of phylogenetic trees are shown in figure 4, which contain the same evolutionary information. The trees show that C and D share a more common ancestor compared to others. Furthermore, they show that B, C and D share a more common ancestor compared to A, and so on.
3
Methods
To be able to analyze the well-covered regions of the sample and produce phylogenetic trees, a sample diversity estimate, etc., an MSA of the fragments and the genome sequence must be constructed. This chapter presents how sequence analysis tools mentioned in the previous chapter are used in this thesis. Figure 5 shows sections of the algorithm used to efficiently construct the MSA, each section will be explained in the following paragraphs.
Figure 5. Algorithm used to construct the MSA of the fragments and genome seqeunces.
3.1 Dataset simulator
To be able to properly verify and benchmark the algorithm during development, a data simulator was needed. Dataset generator is used to generate divergent sequences. The dataset simulator can handle gaps and multiple database sequences from which derived fragments are generated. The generated fragments were extracted randomly from multiple databases, that were mutated randomly down to a user specified percent of identity, and gaps were added to reach a specific percent of gaps.
The dataset simulator takes a DNA sequence in a FASTA file format as an input, mutates the sequence to a user specified identity and then generates short fragments from the mutated sequences. Figure 6 shows how mutated sequences are generated from the original sequence. Two duplicates are taken from the original sequence, and then each is mutated until it reaches 93-98% identity. Then, two duplicates are taken from each mutated
Dataset
duplicate and again 2-7% of the sequence is mutated. Each new mutated duplicated will be duplicated twice and mutated until 62 fragments generated. This mutation will add complexity to the sequences. The mutation is done by randomly adding nucleotides to random positions, adding gaps to random positions, or deleting nucleotides from random positions. Fragments of user specified length are then randomly generated from the 62 mutated sequences. 50% of the fragments created are reverse-complemented. Finally, the simulator outputs a FASTA file containing the fragments generated, where each fragment is tagged with meta-data such as, length, identity, which generated sequence it was fragmented from, and the start and end positions of the fragment.
Figure 6. Sequences mutation’s method used. Original sequence is duplicated into two and mutated, then each new sequence is duplicated again and mutated. Short fragments will be extracted from the 62 mutated
sequences.
3.2 Search Phase
The fragments will be searched against the database sequences to get an alignment of fragments against database, and thus find the regions of the fragments that are similar to
Original sequence 2nd mutated sequence 1st mutated sequence 2-7% mutation 3rd 4th 5th 6th 2-7% mutation 7th 14th 15th 30th 31st 62nd
Regions of fragments that were matched by BLAST are extracted and tagged with a start position and end position, which will be used in the next step to map these regions to the database, and hence create an MSA. Reverse complement of the reversly matched fragments were taken to facilitate the construction of the MSA. At the end, the search phase will output two FASTA files. One file will contain the fragments’ name, the database it fits best, score, expected value, start and end position of the database that the regions were aligned to, and lastly the sequences of the database and fragment that were aligned together. Another generated file having the regions of the sequences aligned by BLAST tagged by the fragment number, this file will be used to construct an MSA using MUSCLE for performance evaluation.
3.3 Construct MSA
Aligning the database sequences and the fragments using MSA software directly would usually result in an MSA of poor quality, for these types of datasets. However, better results can be achieved by mapping the regions of fragments that matched the database sequences since, as mentioned in section 3.2, the matched regions sequences are known, as well as their start and end position of the regions. To construct an MSA effectively, first the database sequences were aligned using MUSCLE. Then, the regions extracted from the fragments in the previous script are mapped manually to the MSA of the databases’ sequences by using start and end positions of the regions. A detail elaboration of the approach used for the manual alignment is discussed in the following paragraphs.
Constructing an MSA of the databases’ sequences will cause addition of gaps to the databases sequences as shown in figure 7(c). This will change the position of the bases of the database sequences making it impossible to align the fragments to the database sequences by using the start and end locations given in the search phase output. Hence, the position of each gap introduced to each database is saved into an array to keep track of the bases position change. From the output of BLAST search made earlier at 3.2, each aligned fragment and database sequence, location of the starting and ending position is extracted. The bases positions of the aligned fragment are updated by adding the number of gaps (introduced by the MSA of the databases sequences) located before the start location given by BLAST, as shown in figure 7(d) .This is done to know the new fragments’ base positions in the database sequences. Next, the bases position in the fragments that lack a position in the database sequences are removed to a hash initially, and tagged with the fragment name and the position they were removed from. A reason for keeping them is that they may contain valuable information, thus it can be re-inserted back if needed. Finally a new sequence will be created containing gaps from the beginning until the starting position of the fragment, followed by the fragment sequence, followed by gaps until the position of the
last database’s base as shown in figure 7(e). This process will iterate over the search phase output until all the fragments are processed, hence creating an MSA of the sequences.
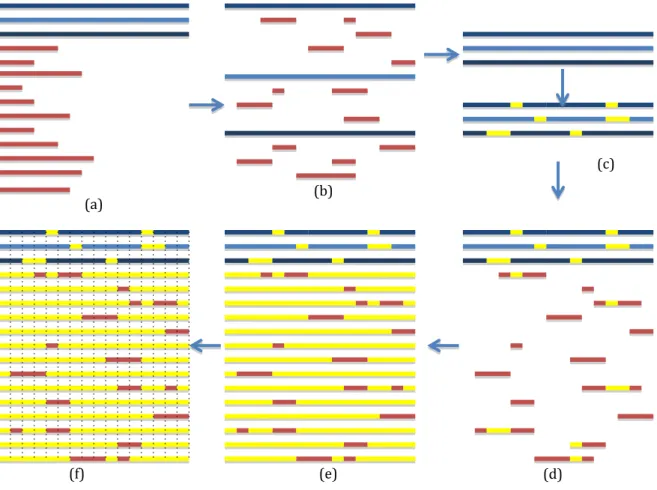
Figure 7. An overview of search and MSA construction phase. (a) The initial database sequences are the blue and the initial fragments are the red. (b) Fragments are searched using BLAST, all gaps open in the databases
sequences were removed initially, and bases positions of the pairwise aligned are saved. (c) The databases are aligned using MUSCLE, gaps are introduced (yellow) (d) Fragments are aligned to the databases sequences taking under consideration positions change caused by databases alignment. (e) Fragments location are known, gaps are add to base positions that were not aligned by BLAST. (f) The MSA is saved as
columns instead of row to find consensus and insert the bases that were removed earlier.
The bases removed from the fragment sequence can be added to the MSA optionally. The user has the following options:
• Construct the MSA with the bases that lack a position in the database.
• Construct the MSA with a micro-alignment of the bases that lack a position in the database. (a) (b) (c) (d) (e) (f)
fragments and database. Figure 7 (f) shows how the rows were saved as column, the first column had all the bases in the first position, and the second contained all bases in positions 2 and so on. This is done to ease re-inserting the bases to their correct positions. To construct the MSA with the bases that lacked a database position (first option), a new column will be inserted at the deleted base position, containing the deleted bases at the fragment that lacked a database position, and gaps are added to the rest fragments and databases sequences
The second option is to insert the bases that lack a position in the database but with “micro-alignment”. The “micro-alignment” is done by first aligning the removed bases at each position using MUSCLE, and then inserting it back to its position in the fragment as done in the first option. Micro-alignment is only done if there are two or more consecutive base positions lacking a base in the database.
3.4 Window Finder
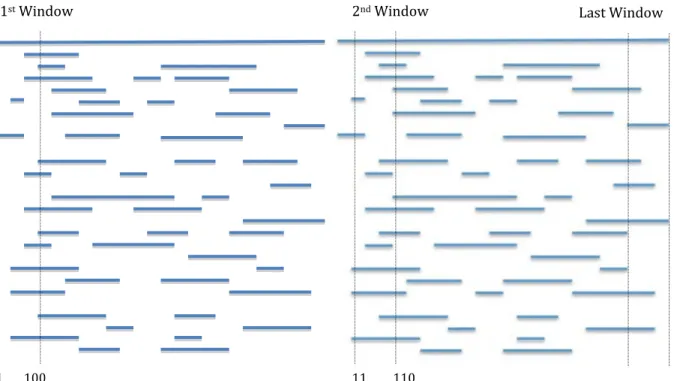
This script is created to find a genome window that has the most number of fragments covering that window. Using the fragments originating locations obtained from the search phase, a window of a specific length is compared against the start and end positions of the fragments. Figure 8 shows how the script finds the number of fragments in each window. First, the window is set from the first base position to Nth base position, where N is the user
specified window size. The script then counts how many fragments have a start position that is equal or less than one, and an end position that is equal or more than N. Therefore, if the window is in between the start and end positions of a fragment, the count of that window will be incremented, hence giving the number of fragments in that window. Next, the window’s start and end positions will be incremented, and the number of fragments present in that window will be counted. This process will repeat until the whole sequence is processed. Finally, the best non-overlapping window will be shown, which can be used to extract that window and construct its MSA.
In figure 8, a window size of 100, incremented in steps of 10 bases, is shown. The script will return zero fragments found in the first window since there are no fragments covering the whole window. However, after incrementing the window’s positions, there will be three fragments covering the whole window. Hence, the script will return three fragments found in that window. The last window shown in figure 8 will contain two fragments.
3.5 Extract MSA
In this part, a script that extracts the bases of the fragments from a user specified positions is created. User can enter the start and end positions of an interesting region in the MSA, usually a window that contains the most number of fragments, and construct an MSA of that region. The script takes a FASTA input file containing the start and end locations of the fragments, a FASTA file of the MSA constructed earlier, and the region to be extracted. The extraction of the user specified window is done by the following steps:
• The first FASTA input file is used to find the names of the fragments that fall within that region. Fragments are tagged with a start and end positions; these positions are compared with the user specified window. If the region specified is between the start and end positions of any fragment, then the name of this position will be saved to an array to be used in the next step. This process is repeated until all fragments are checked.
• In the second step, the MSA from which the region will be extracted is processed. The names of the fragments and database sequences are saved to an array first, and
1st Window 2nd Window
1 100 11 110
Last Window
array created in step two, and the location of that name in the array will be used to extract the bases in that location from the columns in the range of the region chosen. Finally, the name and bases extracted from each column will be printed. This process will iterate until all fragments in that region are printed.
4
Results
This chapter presents a performance evaluation of the method used for simulated data and real data. Next, it presents the TTV population found in the sample. Finally, phylogenetic trees are presented for the window with the highest fragments and for a highly conserved region in the MSA. The results are further discussed in the discussion section.
4.1 Evaluation of performance using simulated data
The output of dataset simulator is used to evaluate the performance, which contains the fragments tagged with meta-data, such as, originating positions of the generated fragments. The MSA generated, search phase output and fragment FASTA file will be the input of the script. First, the fragments names’ will be extracted from the MSA, as well as the position of database where the fragments were aligned. Then, the fragments’ names and location extracted from the MSA will be compared to fragments’ meta-data obtained from the data simulator, and return the difference in locations for each fragment as well as an average of the difference.
Five different sets of simulated fragments were used to evaluate the performance of the constructed MSA. Each set consisted of 1000 fragments generated randomly from the 62 mutated sequences. Table 2 shows the percentage of fragments aligned with no error, percentage of fragments aligned with error and the difference in base positions for the faulty aligned fragments. As shown in the table, average error is between 8 and 12, and the percentage of aligned fragments without errors is always above 87 % (870/1000).
Set Aligned with no errors (%) Aligned with errors (%) Average error 1 94.6% 5.4% +/- 10 2 90.1% 9.9% +/- 8 3 90.8% 9.2% +/- 9.5 4 87% 13% +/- 10 5 97% 3% +/- 11.5
Table 2. Result of the performance evaluation from five different simulated sets, 1000 fragments each.
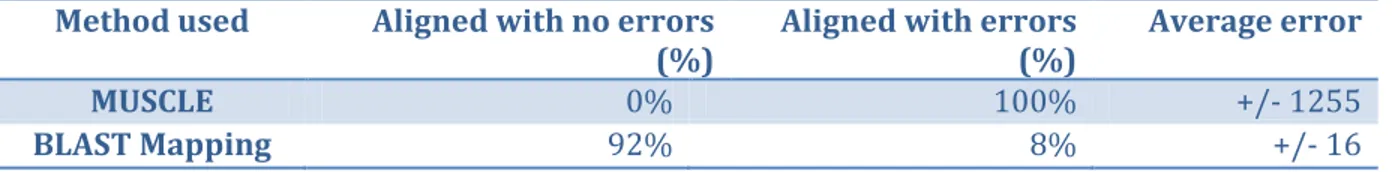
Another set of simulated data, composed of 1000 fragments, were used to compare the performance of the MSA constructed by this method and the MSA constructed by MUSCLE (Edgar, 2004). The result of the comparison is shown in table 3. MUSLCE was not able to align any fragment correctly; it aligned the fragments to a position way far from where they should be aligned. However, the method used in this thesis aligned most fragments where they should be aligned.
Method used Aligned with no errors
(%) Aligned with errors (%) Average error
MUSCLE 0% 100% +/- 1255
BLAST Mapping 92% 8% +/- 16
Table 3. Comparison between the MSA aligned by MUSCLE and BLAST mapping.
Moreover, the results of the evaluation shown above are verified by figures of the MSA constructed by both methods. Figure 9 and 10 show the MSA constructed by MUSCLE and the method used in this thesis respectively.
Figure 10. MSA of the dataset generator fragments using BLAST mapping.
4.2 Evaluation of performance using real data
Real data performance evaluation was done using the search phase output - pairwise alignment - to evaluate the MSA for each base aligned rather than using the originating positions. This is to verify that the fragments were aligned correctly in the MSA. Since this evaluation method is not dependent on the originating position, it can be used to evaluate the MSA of real data. This is done by taking the first aligned fragment in the MSA and the bases of the database that it was aligned to. Then, the same fragment and database sequence aligned to it is extracted from the pairwise alignment output. Now, each base of the four sequences will be checked individually to verify if bases in MSA were aligned exactly as they were aligned in pairwise alignment. This will be repeated for all fragments in MSA. Finally, the script will return a detailed result of how many bases were aligned correctly, the percentage of correctly aligned bases and how many fragments were totally aligned with no errors.
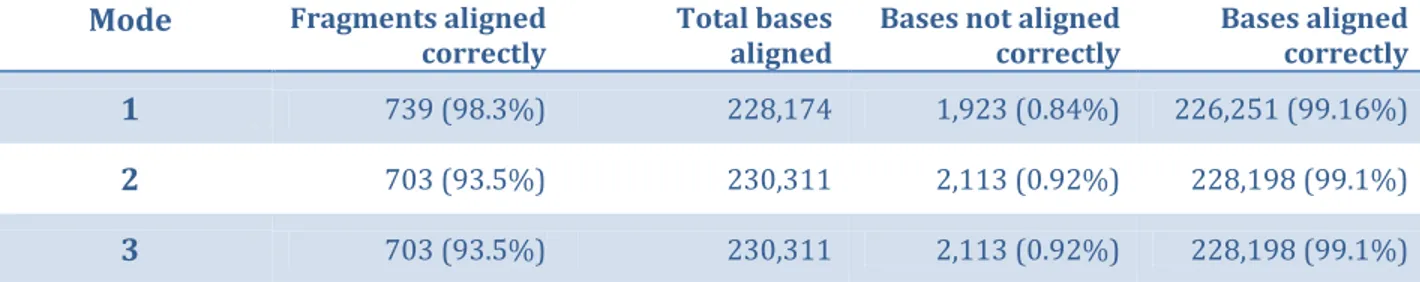
The evaluation shows how many bases out of the total were correctly aligned, its percentage, and how many fragments were totally aligned with no errors and its percentage. Moreover, the performance is evaluated for the MSA with bases that lack a database sequence position removed, inserted, and inserted with micro-alignment. The results of the evaluation are shown in table 4. From the table, “Mode” corresponds to the base that lacks a position in the database, where 1, 2 and 3 are deleted, inserted and
Mode Fragments aligned
correctly Total bases aligned Bases not aligned correctly Bases aligned correctly
1 739 (98.3%) 228,174 1,923 (0.84%) 226,251 (99.16%)
2 703 (93.5%) 230,311 2,113 (0.92%) 228,198 (99.1%)
3 703 (93.5%) 230,311 2,113 (0.92%) 228,198 (99.1%)
Table 4. Result of real data performance evaluation for different modes.
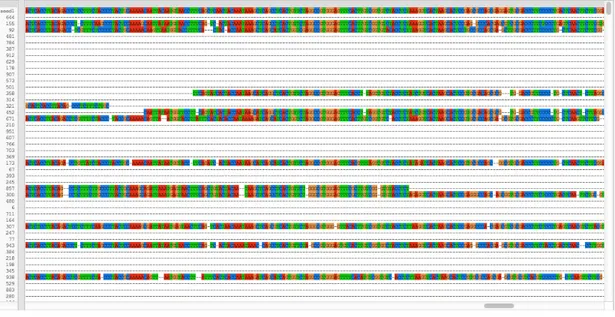
The real data MSA constructed by this method is also compared to the real data MUSCLE MSA. The results are shown in table 5. As in the stimulated data, the MSA created by MUSCLE performed poorly and mis-aligned all fragments. Figure 11 and 12 show the real MSA performed by MUSCLE and by the method used, respectively. The real data MSA in the figure is generated with the bases that lack a database position added with micro-alignment. As a result, many gaps can be seen in the constructed MSA.
Method Fragments aligned
correctly Total bases aligned Bases not aligned correctly Bases aligned correctly
MUSCLE 1 (0.13%) 230,311 205,192 (89%) 25,119 (11%)
BLAST Mapping 703 (93.5%) 230,311 2,113 (0.92%) 228,198 (99.1%)
Table 5. Comparison between real data MSA aligned by MUSCLE and BLAST mapping.
Figure 12. MSA of real data using BLAST mapping.
4.3 TTV population results in real data
The minimal number of genomes present in the sequenced samples is found by using the window finder. A window size of 300 is used in this study to get a statistically thorough number. The window was then applied on the MSA constructed with bases lacking a position removed, inserted and inserted with micro-alignment. The minimal number of genomes found in the sampled sequence is 60, 139 and 140 for the MSA with removed, inserted and inserted with micro-alignment, respectively.
The fragments distribution along the sequence was calculated based on different base positions and based on a specific window size. The distribution based on the base positions is calculated for MSA mode 1 and 3 by taking 30 bases positions, each separated by 100 base. On the other hand, the distribution based on windows was calculated for the third mode only using a window of 100. The results are plotted in a line plot for the base positions distribution and in a bar graph for the window based distribution. Figure 13, 14, and 15 present the results.
0 20 40 60 80 100 120 140 160 180 200 220 240 0 500 1000 1500 2000 2500 3000 3500 N umn ber o f f ra gmen ts
Figure 14. Distribution of fragments in the MSA while the bases lacking a position are micro-aligned and inserted.
Figure 15. The distribution of the fragments covering a window of size 100. Bases lacking a position are micro-aligned and inserted.
4.4 Phylogenetic tree
To be able to analyze the fragments, four phylogenetic trees were generated. ClustalX is used to generate the trees. Two phylogenetic trees of the window with the highest fragments were generated, one with the base lacking a position and the other for a micro-aligned bases inserted. The other two phylogenetic trees are for the conserved region, one with the base lacking a position and the other for micro-aligned bases inserted. Figure 16 and 17 show the phylogenetic trees of a highly conserved region with the bases lacking a database position removed, and inserted with micro alignment respectively. Figure 18 and
0 30 60 90 120 150 180 210 240 0 1000 2000 3000 4000 5000 N umber o f f ra gmen ts Position 0 20 40 60 80 100 120 140 160 180 200 ۱-۱۰۱ ۲۰۱-۳۰۱ ٤۰۱-٥۰۱ ٦۰۱-۷۰۱ ۸۰۱-۹۰۱ ۱۰۰۱-۱۱۰۱ ۱۲۰۱-۱۳۰۱ ۱٤۰۱-۱٥۰۱ ۱٦۰۱-۱۷۰۱ ۱۸۰۱-۱۹۰۱ ۲۰۰۱-۲۱۰۱ ۲۲۰۱-۲۳۰۱ ۲٤۰۱-۲٥۰۱ ۲٦۰۱-۲۷۰۱ ۲۸۰۱-۲۹۰۱ ۳۰۰۱-۳۱۰۱ ۳۲۰۱-۳۳۰۱ ۳٤۰۱-۳٥۰۱ ۳٦۰۱-۳۷۰۱ ۳۸۰۱-۳۹۰۱ ٤۰۰۱-٤۱۰۱ ٤۲۰۱-٤۳۰۱ ٤٤۰۱-٤٥۰۱ N umber o f f ra gmen ts Position
19 show the phylogenetic trees of the window with the highest fragments with the bases lacking a database position removed, and with the bases inserted with micro alignment respectively.
Figure 16. Phylogenetic tree of a conserved region, where bases lacking a database positions are removed.
Figure 17. Phylogenetic tree of a conserved region, where bases lacking a database positions are micro-aligned and inserted.
Figure 18. Phylogenetic tree of the non-overlapping window containing most aligned fragments, where bases lacking a database positions are deleted.
Figure 19. Phylogenetic tree of the non-overlapping window containing most aligned fragments, where bases lacking a database positions are micro-aligned and inserted.
5
Discussion
This section discusses the methods used in this thesis and the results obtained in chapter 4.
5.1 Methods
Since the locations of fragments in the database sequences are not known, it is hard to confirm that the fragments were aligned correctly to the database in the MSA created. Therefore, it is essential to verify that fragments are correctly aligned in synthetic data. The dataset simulator was mainly used to accomplish this task. Generating several mutated database sequences for the original sequence, mutating them in such a way and reversing some fragments derived from databases sequences was done to make the fragments as divergent as TTV fragments. As the fragments generated by dataset simulator are quite divergent, and the originating positions of the fragments are known, they were used to evaluate the performance of the constructed MSA, and to verify that fragments were correctly aligned in the constructed MSA.
The fragments were aligned to the database sequences using pairwise alignment, which aligns one fragment to the database sequences at a time, hence, finding the regions of database that fit the fragments best. A benefit of using local alignment is that highly diverse regions, often due to mis-alignment or erroneous sequence parts, are disregarded. Furthermore, a threshold can be set for the Expected - values given by BLAST for each fragment to get the regions that are highly similar only. Therefore, the pairwise alignment of fragments results in an accurate alignment, which allows the construction of an efficient MSA. BLAST was used for the pairwise alignment because it is easy to be used and provides a tradeoff between accuracy and speed, scoring parameters can be adjusted and the output format can be chosen which alleviate parsing the search output.
Fragments were aligned to the database sequences in the MSA with the bases lacking base positions removed initially to facilitate the MSA construction. Moreover, removing these bases can be useful because it allows analyzing the fragments with and without gaps. Then, the fragments and databases arranged in the MSA were converted to column-based array so that the insertion of the deleted base will be easier and to have the ability to insert micro-aligned, which normally results in more gaps to the removed bases. Furthermore, having the bases saved column-wise is beneficial to find the consensus, since it is important to study the conserved regions.
Tools, such as window finder and extracting sub-section of the MSA, are essential to further study parts with most fragments and the conserved regions. The window finder parameters, such as window size, are kept configurable so that different windows’ size can be chosen.
5.2 Results
The comparison between the simulated fragments aligned using MUSCLE and the method used in this thesis reveals that MUSCLE has a poor performance, while the method used aligned most fragments with minimal errors. Moreover, the figures shown verify how each MSA performed. Some fragments were not aligned in the MSA to the exact position mentioned in the data simulator metadata, this is mainly because the pairwise alignment did not match all the sequence, rather it skipped bases from the beginning or end that did not match a database bases. The +/- bases shown in the table are most probably the bases that were not aligned because of the mutation done to fragments.
The performance evaluation of the real data shows that more fragments were aligned correctly all over the sequence when the bases lacking a database position are removed, compared to when the bases lacking a database position are inserted. This might be due to the addition of many consequent bases that were previously removed. Although some fragments were not aligned correctly, but not the whole bases of the fragment was mis-aligned. The overall performance evaluation shows a high accuracy of the alignment constructed by the method used.
is because the micro-alignment added some gaps when performing micro-alignment to these bases. The distribution of fragments showed in the figures is shown for several base positions starting with the first to the last, separated by 100 bases. The separation was decreased and increased, but the line graph results were almost the same, but with some sharp curves in the plot lines.
6
Conclusion
The study main purpose is to determine the minimal number of genomes present in the sequenced sample and provide an upper estimate for a reasonable coverage, to be able to analyze subsections of samples as well as conserved regions. An efficient MSA of the fragments and database sequences was successfully created as well as consensus sequence of the alignment. In addition to that, any user specified window could be extracted from the MSA for further analysis using phylogenetic tree.
Minimal number of genomes was determined, and a distribution of fragments in the sample was also determined and plotted in a line plot. Phylogenetic trees of a conserved region as well as the window with the highest fragments were constructed.
The MSA constructed using the thesis method performed better than other MSA softwares. Moreover, there was a huge difference in time taken for constructing the MSA. MUSCLE took not less than five hours to construct an MSA with a very poor quality, while the method used took no longer than two minutes to construct the MSA.
Bibliography
454 Life Sciences Corporation. (n.d.). How is genome sequencing done? . Retrieved 5 01, 2012, from 454: http://www.454.com/downloads/news-events/how-genome-sequencing-is-done_FINAL.pdf
Alberts, B., Bray, D., Hopkin, K., Johnson, A., Lewis, J., Raff, M., et al. (2004). Essential Cell Biology (2nd Edition ed.). Garland Science .
Altschul, S. F., Gish, W., Miller, W., Myers, E. W., & Lipman, D. J. (1990). Basic local alignment search tool. J. Mol. Bio , 215, 403-410.
Baum, D. (2008). Reading a Phylogenetic Tree: The Meaning of Monophyletic Groups. Retrieved 8 19, 2012, from Scitable: http://www.nature.com/scitable/topicpage/reading-a-phylogenetic-tree-the-meaning-of-41956
Bendinelli, M., & Bonis , P. (2011, 5 11). TT and other anelloviruses. Retrieved 10 12, 2012, from UpToDate: http://46.4.230.144/web/UpToDate.v19.2/contents/f37/31/38909.htm Dahm, R. (2005). Friedrich Miescher and the discovery of DNA. Developmental Biology , 278, 274-288.
Edgar. (2004). MUSCLE: multiple sequence alignment with high accuracy and high throughput. R.C. Nucleic Acids Res , 32 (5), 1792-1797.
Libonati, M., Carsana, A., & Furia, A. (1980). Double-stranded RNA. Molecular and Cellular Biochemistry , 31 (1), 147-164.
Lightner, C. A. (2008). A tabu search approach to multiple sequence alignment. Retrieved 9 13, 2012, from Grin: http://www.grin.com/en/doc/260171/a-tabu-search-approach-to-multiple-sequence-alignment
Maggi, F., & Bendinelli, M. (2010). Human anelloviruses and the central nervous system . Reviews in Medical Virology , 20, 392-407.
National Human Genome Research Institute. (2012, Feb 27). FAQ about Genetic and Genomic Science. Retrieved Oct 14, 2012, from National Institute of Health: http://www.genome.gov/19016904
Pace, N., Stahl, D., Lane, D., & Olsen, G. (1985). Analyzing natural microbial populations by rRNA sequences. ASM American Society for Microbiology News , Vol. 51 (1), 4-12.
Pevsner, J. (2009). Bioinformatics and Functional Genomics. Baltimore, Maryland: Wiley-Blackwell.
Voelkerding, K., Dames , S., & Durtschi , J. (2009). Next-generation sequencing: from basic research to diagnostics. . Clinical Chemistry , 55 (4), 641-658.