VTI särtryck
Nr 242 ' 1995
Test and Design Parameters of Elastic
Stiffness and Permanent Deformation
Safwat F. Said
Lecture at the course on Bituminous Pavements:
Materials, Design and Evaluation at Uleåborg, Finland,
25 28 April 1995
Väg- och
transport-farskningsinstitutet
VTI särtryck
Nr 242 0 1995
Test and Design Parameters of Elastic
Stiffness and Permanent Deformation
Safwat F. Said
Lecture at the course on "Bituminous Pavements:
Materials, Design and Evaluation at Uleåborg, Finland,
25 28 April 1995
db
Väg- och
transport-farskningsinstitutet
'
Swedish Road and
,Transport Research Institute
Bituminous Mixes and Aggregates l (37)
Safwat Said/GS
BITUMINOUS PAVEMENTS: OULU 1995
TEST AND DESIGN PARAMETERS OF ELASTIC STIFFNESS
AND PERMANENT DEFORMATION
INTRODUCTION
Elastic and plastic characteristics of bituminous layers are required for flexibel
pavement design and evaluation of mix design of bituminous mixtures. The
defor-mation response of bituminous layers under loading is composed of recoverable and irrecoverable deformations. The recoverable deformation consists of pure elastic (time-independent) and viscoelastic (time dependent) deformations. The recoverable deformation characteristic, which related to bearing capacity or cracking distress, is evaluated by the stiffness of the bituminous layer. The irre coverable deformation consists of plastic independent), viscous (time-dependent) and viscoplastic (time (time-dependent) deformation. The irrecoverable de-formation characterstic, which related to rutting due to excessive permanent defor mation, is evaluated by accumulated permanent deformations or the viscos para-meter of the bituminous mixture. This paper will discuss the design parapara-meters and the test methods at the laboratory for the stiffness and the permanent de
2 (37)
STIFFNESS OF BITUMINOUS MATERIALS
One of the most fundamental properties of a bituminous material is the modulus of stiffness, which is required as a material character for exible pavement design and mix design analysis of bituminous materials.
The term stiffness or stiffness modulus has been used by Van Der Poel [l] to define the stress to strain ratio of bitumen, and to avoid using modulus of elasticity (Young s Modulus), which means the stress being directly proportional to strain and independent on the strain rate and temperature. The stress to strain ratio of bituminous materials is primarly dependent on temperature, loading frequency and the stress magnitude at an elevated stress level. Thus the material is defined as a non-linear viscoelastic material. Whereas, at a relatively low stress level, bitumi nous materials may be defined as an approximately linear viscoelastic material for practical use. This means that the stiffness may be used as a material constant at a given temperature and loading frequency in structural analysis of bituminous mixtures. The stiffness modulus, in genereal, is simply defined as the ratio of stressto strain induced by loading bituminous material and the strain may be founded on the total deformation or only on the recoverable deformation. This de-finition is vague because the stiffness value is dependent on the loading procedure and the way the deformation measurement (total or elastic) is carried out. The term elastic denotes all recoverable (resilient) deformations whether they are pure elastic (time-independent) or viscoelastic (time dependent) deformations [2]. Mo-duli, based on dynamic or repetitive loading are discussed here, since the stresses need to be repeatedly applied to represent successive wheel passes [3] and they are frequently used.
VTI, Bituminous Mixes and Aggregates Safwat Said/GS
3 (37)
Testing procedure
The moduli of bituminous mixtures have been measured in the laboratory by diffe rent test methods and repetitive loading procedures:
1. Sinusoidal loading
2. Repeated loading
I. Sinusoidal loading
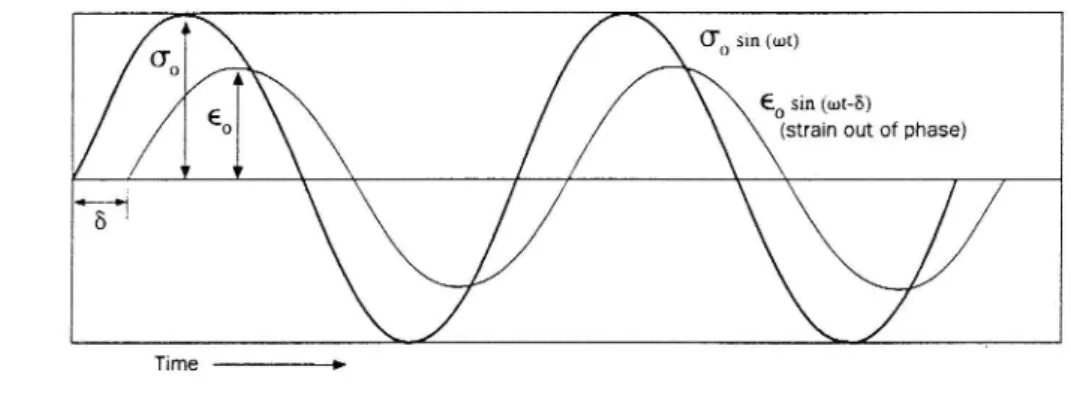
When an asphalt concrete specimen exposed to a sinusoidal load and the induced strains alternate sinusoidally with the same frequency but has an out of phase angle with the stress waves, then the material behaviour is linear viscoelastic as shown in Figure l.
(To Sin (wt)
60 Sin (wt-8)
(strain out of phase)
Time >
Figure I Sinusoidal loading
The complex (B*) and dynamic (Edyn) modulus are calculated by the following equations:
* _
GO sin (out)
so sin (tot-6)
VTI, Bituminous Mixes and Aggregates Safwat Said/GS
4 (37)
The dynamic modulus is defined as the absolute value of the complex modulus.
15dyn = /E*/ = 0 0
80
where 00 = stress amplitude so = strain amplitude 0) = angular frequency
5 = phase angle
t = loading time
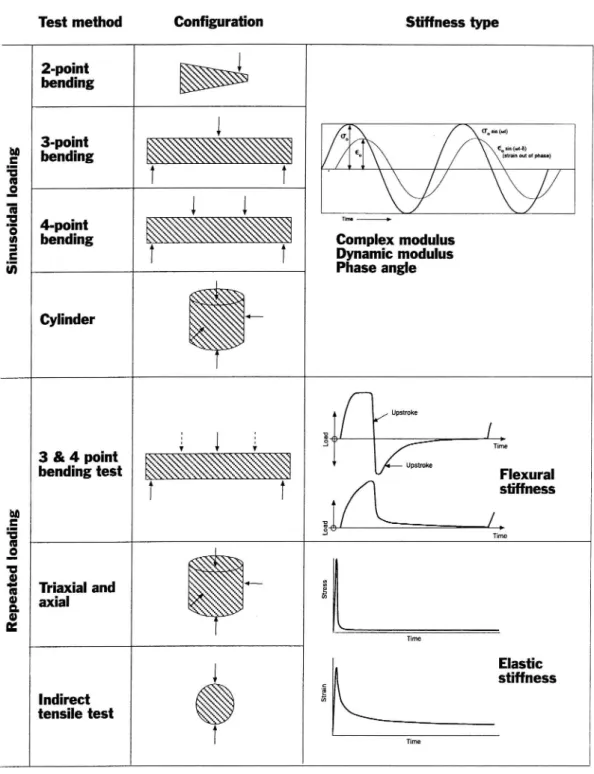
Different types of testing methods have been used to produce sinusoidal stresses in asphalt concrete specimens, for example: cylindrical specimen with compressive stresses [4, 5] trapezoidal specimen [6, 7, 8] and bending test [7, 9]. See Figure 2.
2. Repeated loading
The measured signals from the passage of vehicles have been shown to be complex, but they include rest periods [10, 11], which is important for the re coverable deformation. A variety of testing methods have been used to apply repetitive loads with rest periods to asphalt concrete specimens in the laboratory. The repeated load bending or flexural test is performed by exposing a simply supported beam specimen to repetitive bending loads [12, 13]. The beam is loaded for a given time and then forced to its original undeflected position (no permanent deformation) as shown in Figure 2. The ratio between applied stress and resultant
strain is called the flexural stiffness modulus.
The triaxial and axial resilient modulus test is performed by exposing a cylindrical specimen to repeated deviator or axial load applications at a given loading time and rest time. The resilient modulus (elastic stiffness) is determined by the ratio of
VTI, Bituminous Mixes and Aggregates Safwat Said/GS
5 (37)
axial stress to resilient (recoverable) axial strain [14, 15, 16] as shown in Figure 2. (Permanent deformation is very small and dependent on the test temperature and loading history).
The indirect tensile test (ITT) is increasingly being used and has been adopted by ASTM [17] and FAS (The Swedish Asphalt Pavement Association) [18] for eva luating the elastic stiffness (resilient modulus) of bituminous materials. This method has been investigated widely [14, 19, 20, 21, 22, 23, 24, 25, 26, 27] pri marily due to its advantages in practice. The tensile characteristics of bituminous mixtures are evaluated by loading the vertical diametral plan of cylindrical briquettes and the resilient (recoverable) deformation at the horizontal diameter is recorded (Figure 2). The elastic modulus (resilient modulus) is calculated with assumed Poisson s ratio. Figure 2 illustrates the different test methods mentioned
above.
VTI, Bituminous Mixes and Aggregates Safwat Said/GS
6 (37)
Test method Configuration Stiffness type
mm;
W
';å
_
1 1 _
V V
? 333132 gompIex modulus E ynamic modulus m Phase angle Cylinder &? i l ; % I upswm J Ti;m.m; W T W
T T L stiffness % Triaxial and * åh & axiala !
'
1
ååå;
zzsäfzaest
T
Figure 2 Different types of test methods.
VTI, Bituminous Mixes and Aggregates Safwat Said/GS
7 (37)
Comparison between test methodsTest methods, which are frequently used nowadays, are presented in Figure 2. The problem is which method and procedure are the most suitable for characterizing bituminous mixtures in pavement analysis and what are the differences between them in practice.
In respect of loading procedure, the stiffness values based on continuous sinus-oidal loading, usually called dynamic modulus, are higher than the stiffness values based on repetitive loading with rest periods, usually called elastic stiffness or, resilient modulus, for the same loading wave form [28]. This is illustrated in Figure 3.
Inducing rest periods between loading stresses give rise to larger (recoverable) de-formation and in terms of lower stiffness values for elastic stiffness which is based on recoverable deformation, kept in mind that the measured signals from the passage of vehicles include rest periods [1 l]. Mamlouk et al [29] concluded that the complex modulus, by using sinusoidal loading, is not suitable for use in elastic multi layer models, since it does not represent elastic parameters. However, it is appropriate to be used in viscoelastic pavement models where the time dependent response is considered.
VTI, Bituminous Mixes and Aggregates Safwat Said/GS
8 (37)
8
I
r
I
I
I
- continuous hoversine loading 7 __ hoversine loading every 3 seconds
a'd = 30 psi (73 =O psi 6 .... LO 9 ><
ä 5
C. 25 4 -
3 O O Eif} 3 _
% Q) o: 2 _... | __ _. O l l l l l 50 60 70 80 90 100 0 Temperature, °FFigure 3 Relationship between resilient modulus and temperature of sand
mixfor various loading times and loading frequencies [28].
In respect to temperature, the stiffness values are sensitive to specimen configura-tions especially at elevated temperature due to the viscoelastic character of bitu-minous mixtures. According to Van Dijk [7], the trapezoidal test is suitable for temperatures up to 50°C. However, the 3 point bending test is suitable for tempe ratures up to 30°C. The indirect tension test is suitable for moderate temperatures, about 20°C [25] and the maximum temperature mentioned in the Swedish speci-fication [18] is 25°C.
VTI, Bituminous Mixes and Aggregates Safwat Said/GS
9 (37)
The differences between tests using repeated-loading with rest periods are pri-marly effected by deformation measurement. The permanent deformation, conduc-ting bending test, is prohibited by forcing the specimen back to its original position after each loading application. Therefore even the irrecoverable part of deformation is included in the measured deformation for stiffness calculation. However, conducting uniaxial and indirect tensile tests, only the recoverable deformation is used for stiffness calculation (the irrecoverable deformation is permitted during testing). The stiffness values based on the bending test, usually called exural stiffness, should be lower than the stiffness values based on elastic (recoverable) deformation for the same loading wave form. Moreover, it looks like the loading signal form from repeated-load bending tests is comparable to the longitudinal strain signal (Figure 4), in which the strain level after the passage of an axle will be always about zero (no permanent deformation) [10].
VTI, Bituminous Mixes and Aggregates Safwat Said/GS
L o a d Da l/ ac tion !
Timo inlerva/ bah-roan success/ve 10 (37)
x ' : L oad _... ' ! ] dura/ion load applications Up stroke Time " * Downs/rote
fa) Idea/[zed Load - rime Curve.
_ __ Time
/b/ idea/[zed De ection-Mime Curve.
Bending test
klo: få 13.5 'C Mom: 61? Mt: cu/ 2 Into: ut h.: 87 69 89
S&L 81.1- -zz.a rum: 11.3 49.3 M (F$) Å H 28.9 °c BB ! ILZ ! 16.8
Longitudinal strain signal under vehicle passage
Figure4 Illustration of loading signal from bending test [12] and longi
tudinal strain signal under vehicle passage [l 0].
Whereas the deformation signal form from resilient type tests, such as axial and indirect tensile tests (ITT) is more comparable to the transversal strain signal form measured under wheel passage and illustrated in Figure 5. There is only tension and it decreases slowly to zero [10].
VTI. Bituminous Mixes and Aggregates Safwat Said/GS
ll (37) m
_! l *; 25 C 6 __ 5 _l 1 1
.; ~§
T; 4 g .. o .. '$ J o 2 +: o . , o 1 1 2 2 3 3 Time, secDeformation signal from ITT
W: 59 M2 m/u Mt.: LI! ?-: w No: XIISQ L. ..: - z.z mm: n.. nu = 172.9 ] 47.4 M (P3, . zsa I j ... , -ZSI m.- ; ! [ k ___J
Transversal strain signal under vehicle passage
Figure 3
Illustration of deformation signal from ITT (VTI) and transversal
strain Signal under vehicle passage [10].
Huhtala et al [ 10] also concluded that the transversal strains are usually greater in amplitude than the longitudinal strains at the bottom of the bituminous layers, and as a fact in Sweden, the cracking distress is usually longitudinal in the wheel paths which should be related to transversal strains. Therefore, the bending test is probably better when simulating longitudinal strains. However, the resilient type tests are more apprOpriate for simulating transversal strains, when measuring the
stiffness.
VTI, Bituminous Mixes and Aggregates Safwat Said/GS
12 (37)
Other differences between uniaxial and bending tests [3, 29] are that the bending tests introduce tensile stresses on the surface of the test specimen. However, the stress distribution in the triaxial and uniaxial tests are well defined and all the cross section is affected by loading application. Especially, when using the tri axial, the vertical and horizontal stresses, will act together as in the pavement layers. Therefore, stiffness values based on uniaxial or triaxial tests should be more accurate than stiffness based on bending tests. On the other hand, neither bending tests nor uniaxial tests are suitable for routine measurements since they need large specimen especially when specimens from pavements are needed. These tests also need relatively advanced test systems.
The repeated load indirect tensile test has been increasingly used in the last decade. The disadvantage of this method [3] is the accuracy of stiffness determination because the stress distribution is only valid under ideal elastic conditions when the behaviour of bituminous mixtures is predominantly linear. Furthermore, the Poisson s ratio must be assumed for the determination of strain across a horizontal diameter. On the other hand, the great advantages of the indirect tensile test [19, 30, 31, 32] are its simplicity and that it is rapid to conduct. Cylindrical specimens are used which are relatively easy to fabricate in the laboratory or cored from the road layer or a slab and the test is sufficiently
accurate fOI' routine use.
Finally, it is concluded that the uniaxial and triaxial tests are probably most appropriate for the determination of stiffness behaviour of bituminous mixtures especially in arranging a fundamental basic relationship for a mix. On the other hand, the indirect tensile test probably most suitable for routine measurements. However, in practice the access to the test facility governs the choice of the test method and some design models are developed on the assumption of a specific stiffness method. Therefore, warning should be taken when using stiffness based
on another method.
VTI, Bituminous Mixes and Aggregates Safwat Said/GS
13 (37)
Indirect tensile test in routine measurement
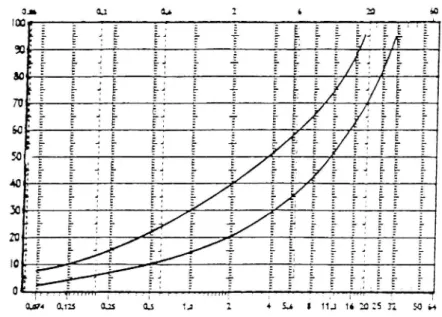
About 300 cores from roadbase materials were taken from 13 road sections, de scribed elsewere [33], for laboratory analysis. The coring places were spread over the test sections which varied between 3 and 7 km in length. Elastic stiffness determination and mix composition are part of the laboratory test analysis on the bituminous roadbase layers. The recipe of the mixture meets the specifications and guidelines for road construction [34]. The original bitumen type is B180 and the bitumen content is 4.2 i 0.5 percent by weight. The aggregate size limits of the grading curve are shown in Figure 6 with a maximum aggregate size of 25 mm. The air void content should be about 5-10 percent.
0. 11 6.6 2 6 2:3 QD lm . 8 8 3 8 8 8
cum 0.125 (us 0.5 u 1 4 s.; t 11.1 n:ozsn 5054
Figure 6 Size limits of roadbase mix, AG25.
The thickness of tested specimens sawed from cores varied from 30 mm up to 67 mm. The elastic stiffness is measured at different temperatures with an assumed Poisson s ratio of 0.35 for all temperatures at the VTI s laboratory. An
VTI, Bituminous Mixes and Aggregates Safwat Said/GS
14 (37)
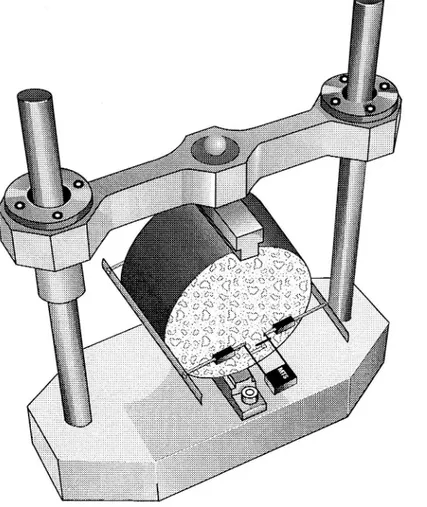
example of the test setup is shown in Figure 7. The apparatus is a servo hydraulic machine from MTS.Figure 7 Specimen with extensometers in the loading device for indirect
tensile test.
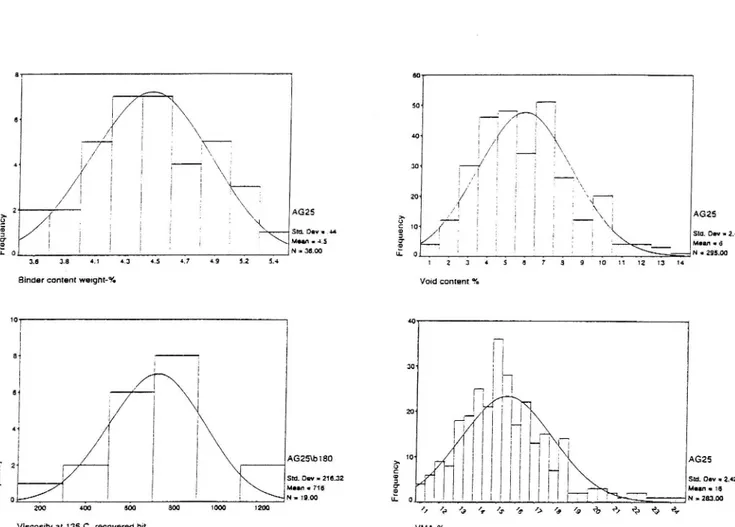
Figure 8 presents the average of elastic stiffness of each test section at various temperatures. The variation in elastic stiffness values is relatively high, but this variation is primarily believed to depend on the wide limits within the mix spe cification and the variation in the mix composition between road sections. These variations are illustrated in Figure 9 by frequency distribution diagrams of void conent, binder concent, voids in mineral aggregate (VMA) and viscosity at 135°C
of recovered binder.
VTI, Bituminous Mixes and Aggregates Safwat Said/GS
Safwat Said/GSVTI, Bituminous Mixes and Aggregates ture.
Elastic sti ness of cores from the test sections at various tempera-Figure 8
edw snmpow maugsaa
20 00 0 A625 , ro ad ba se co re s 18 00 0 !, 16 00 0 + 14 00 0 12 00 0 10 00 0-v 80 00 -60 00 40 00 -A 20 00 15 Temp er at ur e, C 20 25 30 + L2 52 _ l LS -ix -RV 23 -> é RV 62 + R V 4 1 Ö + RV 41 U + RV BO -AV -RV 67 --<> L1 17 C } E6 6 _ A No rs ho lm )( Gä vl e + Rv 32 ö _ G Rv32 u + Hv 34 0 ' _ ' RV 34u 15 (37)
Freq ue nc v Freq ue nc y 0 r__ __ .
A625 Std. DON/c.a I Moan-4.5 N238.00
4.5 4.7 4.9 AGZSVJ 180 SM. DGV : 216.32 Mun = 716 N : 19.00 200 400 800 1000 1200
Viscosity at 135 C, recovered bit.
Figure 9 Frequency distributid diagram.
VTI, Bituminous Mixes and Aggregates Safwat Said/GS Ff eq ue nC y Fr eq ue nc y 16 (37) Void content %
AG25 sw. Ow . 2.47 Moan : 6 N : 295.00 AGZS Std. Dov = 2.42 Mm . 15 N a 283.00
17 (37)
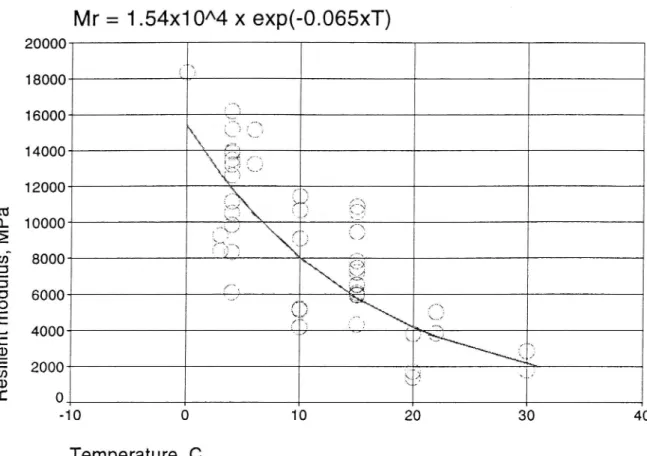
Figure 10 shows a regression correlation between temperature and roadbase mix-ture which may be used as a design parameter.
Mr = 1.54x10A4 x exp(-0.065xT)
20000
18000
if
16000
X
&xx &
\14000
"3
12000
-3
CU fir- if. f':N%% 10000
{rig
,W
gg
%? 8000
??
%%
"c 6000
a
å få \\ :.",qu+. 4000
C(lf
VJ
:; %
\.,, .92a 2000
(D CC O-10
0
10
20
30
40
Temperature, CFigure 10 E ect of testing temperature on resilient modulus of roadbase
ma-terials (AG 25).
Comparison between measured and predicted stiffness
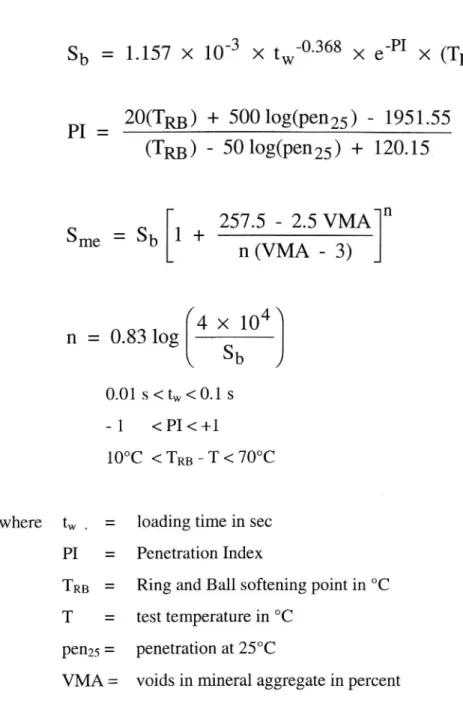
A comparison between measured elastic stiffness and predicted stiffness based on mix composition is done. The stiffness of the mixes (Sme) and the binder stiffness (Sb) are calculated by the following equations which are applicable within the given limits [2, 35].
VTI, Bituminous Mixes and Aggregates Safwat Said/GS
18 (37)
sb = 1.157 >< 10'3 >< tw'0'368 x e'PI >< (TRB - T)
20(TRB) + 50010g(pen25) _ 1951.55
(TRE) - 50log(pen25) + 120.15
257.5 - 2.5 VMA
Sme = Sb 1 +n(VMA - 3)
4n = 0.83 log [&]
Sb
0.01 s<tw<0.1 s 1 <PI<+1 10°C <TRB T<70°Cwhere tw _ : loading time in sec
PI : Penetration Index
TRB : Ring and Ball softening point in °C
T = test temperature in OC
pen25 = penetration at 25°C
VMA = voids in mineral aggregate in percent
The loading time (tw) used in the prediction is 0.1 sec analogous to the loading
time used in elastic stiffness measurements.
Figure 11 shows the relationship with a correlation coefficient (R2) equal to 0.76. The prediction relationship slightly overstimates the stiffness in comparison with measured elastic stiffness. However, this is realistic considering that the prediction equations are based on the bending test exposed to sinusoidal loading. Further measurements are valuable to verify this correlation.
VTI, Bituminous Mixes and Aggregates Safwat Said/GS
19 (37) 24000 l
_ 8:919g+1.05Mr
+
R2=0.76
20000 16000 Ä CU D. E5
_D £3 CU 5 2 (U O 12000 (f) (I) (D C E U) 8000 ;l
4000 fl l . . i ' l ' !l l 4000 8000 12000 16000 20000 24000Elastic Stiffness measured by lTT(Mr), MPa
Figure 11 Relationship between measured and predicted stz hess.
A PERMANENT DEFORMATION OF BITUMINOUS MATERIALS
Rutting due to permanent deformation of bituminous layers is one major distress in heavy duty exible pavements. In the Northern countries, rutting is also evident in many heavy trafficked roads Where softer binders are normally used and the number of sun shining hours exceed 14 hours per day in summer period. Rutting usually exhibits as a longitudinal surface depression in the wheel paths of heavy traffic. Rutting, in addition to the post compaction, is mainly caused by displace-ment of mix at constant volume [36], which indicates the importance of shear
resi-stance of bituminous mixtures.
VTI, Bituminous Mixes and Aggregates Safwat Said/GS
20 (37)
In addition to traffic history and environmental factors, rut depth prediction needs bituminous mix properties at high temperature and under long loading time when the mix properties are dominated by the viscos character of the binder. Besides the binder character and content, the mix rut resistance is affected by gradation, shape and surface texture of the aggregate. Practically, the viscous response of bitumi nous mixtures could be determined by mechanical testing represented by irre
coverable deformation, low stiffness or shear resistance of the mixtures.
Test Methods
Different test methods have been used in determination of the permanent deforma tion response of bituminous mixtures. The test methods most used nowadays are the following:
1. Uniaxial creep test 2. Wheel tracking test
3. Shear test
1. Uniaxial creep test
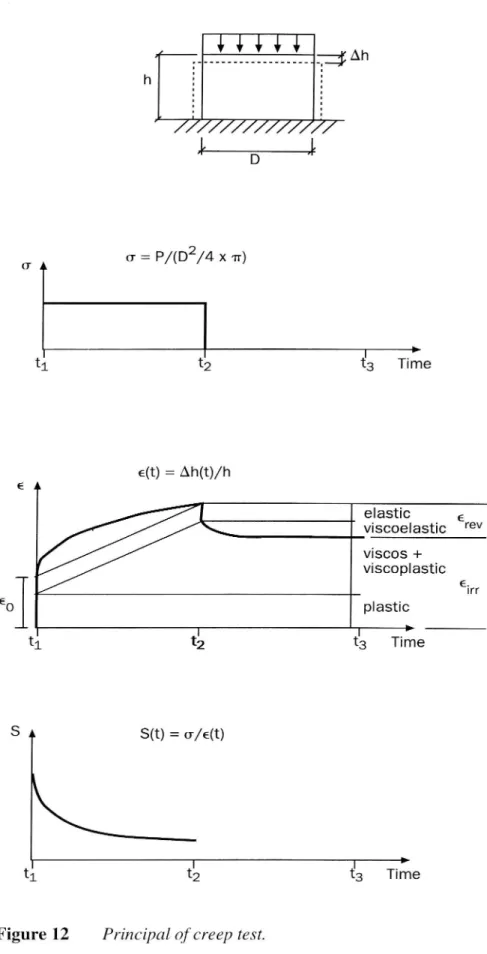
The uniaxial compressive test is probably the simplest and most used in deter mination of the creep deformation response of mixtures. Figure 12 illustrates the principal of the creep test. A specimen is exposed to a constant compressive stress normally 0.1 MPa. The resulting axial deformation is measured as a function of time. The strain and stiffness could be calculated in respect of time. In the static creep test, the specimen is loaded for one hour and kept unloaded usually for an
other hour.
VTI, Bituminous Mixes and Aggregates Safwat Said/GS
21 (37)
: ___________________ :;Ah
/}///////// / /
L
Di
a = P/(D2/4 x w)
a A I | ? tl t2 t3 Time e(t) = Ah(t)/h G A elastic viscoelastic rev viscos + viscoplastic ' e. IH 601 plastic | | = tl t2 tg Time 8 i S(t) = U/e(t) | I F tl t2 t3 TimeFigure 12 Principal ()fcreep test.
VTI, Bituminous Mixes and Aggregates Safwat Said/GS
22 (37)
A good correlation between creep test and laboratory rutting has been reported, and it is recommended for the mix design and prediction of pavement rutting [3l, 37, 38]. According to Koole et al [39] the static creep test is suitable for mixes with a conventional binder, but has shortcomings when modified binders, with high elastic recovery are used in bituminous mixtures. They recommended dynamic creep tests in which the specimen is subjected to repeated loadings of axial stresses of one second duration and separated by one second rest time for
two hours.
The uniaxial creep test has also been found not suitable for porous asphalt due to the absence of confined conditions [37]. An investigation of the dynamic creep test has shown that the side supported creep test, which is analogous to confining pressure, increased the deformation resistance of the stone mastic asphalt but was without effect on conventional mixtures. This is illustrated in Figure 13. The side supported creep test is brought about by loading the center part (QS 100 mm) of a specimen with g) 150 mm instead of the whole crossection. However, this proce dure needs further investigation to verify these results.
VTI, Bituminous Mixes and Aggregates Safwat Said/GS
23 (37)
Static creep test
IZI!) (ID / SMAlOO/l oo ioocn : / . . . ....~\~~~~~v_~____x Asma/100 x ... ABlOO/lSO / SMAmonso St rain (p e)
&
7wh ' _ ' / ' Time (sec)Figure 13 E ect ofside-supported creep test.
The results of the creep test, usually expressed in permanent strain at the end of the test, by Smix Shit relationship or expressed by regression relationship between strain (8) and number of load applications (N) (or function of time for static creep test) like:
e=A+BlogN
VTI, Bituminous Mixes and Aggregates Safwat Said/GS
24 (37)
where A and B are regression coefficients. The value of A explains the initial de-formation and the value of B explains the creep dede-formation rate of mix which is valuable for the prediction of permanent deformation. Figure 14 shows the results of creep tests for some wearing and basecourse mixtures.St ra in (p st rain ) <> (1 1&4 , 1E+3 = ' 9154
No. of loading applications Basecourse mixes 1E+4
Cow.
St ra in (p stra in ) b D4 5 5 7 8 9 1£+3 2 3 1E+4
No. of loading applications
Wearing mixes
Figure 14 Creep deformation.
VTI, Bituminous Mixes and Aggregates Safwat Said/GS
25 (37)
The SMA mix for surface mix has not shown any signi cant better deform
ation
resistance, contrary to expectation, than conventional mix. This is beca
use the
mixes for surfacing are usually optimized with respect to wearing resistance
which
is a major distress caused by studded tires. Whereas in Figure 14, the SMA
mixes
for basecourse are optimized with respect to permanent deformation an
d have
therefore shown better deformation resistance. From the ASTO proj
ect [40] it is
concluded that if the proportioning is not done carefully the risk of rutting,
in par
ticular in the SMA layer, is great andthe result can be worse than expected.
Z. Wheel-tracking test (WTT)
In general the wheel tracking test is composed of a single tire which cou
ld be
rolled on a slab of asphalt concrete under various test conditions (Figure 15)
.
Figure 15 W'Z '1 at Nynäs Laboratory.
VTI, Bituminous Mixes and Aggregates Safwat Said/GS
26 (37)
This type of facility is designed for optimal simulation of the condition in practice. A variety of WTT s are reported in literature. Twin or single tires with rubber-supported slab is used by Eisenmann et al [36]. The LCPC machine is composed of a single tire with specimen placed in a steel box [41]. According to Heikkilä [42], the VTT s machine is larger and more realistic than the traditional WTT. The VTI s wear test facility [43] has been modified for rutting studies. It is circular with the ability of lateral movement. It has high capacity, up to 28 slabs could be tested simultaneously with a maximum temperature of 40°C.
Rutting in the wheel path is expressed by the reduction in thickness of the slab as a function of the number of wheel passages. Usually, a regression analysis on results is established in order to see the permanent deformation rate of the mix. The great advantage of a WTT is the good simulation of the asphalt material under rolling tire. However, its limitations is in analysing the fundamental mix
proper-ties which cannot be obtained.
3. Shear test
The horizontal displacement of asphalt materials under traffic loading is belived to be due to the lack of shear resistance in bituminous mixes. Therefore, it will be valuable to study the shear deformation properties of mixes under pure shear state [44]. Different types of shear tests have been used to expose a specimen to shear forces. Lempe [45] used two cylindrical specimens which are glued between three steel plates (Figure 16). Bonnot [41] used a similar apparatus with two prismatic specimens for studying fatigue and self-repair properties of mixes (Figure 17). However, Junker [46] induced shear stresses in a cylindrical specimen by a rod glued in a hole drilled in the specimen (Figure 18).
VTI, Bituminous Mixes and Aggregates Safwat Said/GS
27 (37)
test xmen
electrical o litud
measuring devrce
Figure 16 Shear test with two cylindrical specimens [45].
("* _ j 0 , l Q I [ _ [ i/ 25 12 17
;-Figure 17 Shear test with two prismatic specimens [4]].
Figure 18 Shear test with one clamped specimen [46].
VTI, Bituminous Mixes and Aggregates Safwat Said/GS
28 (37)
Under the SHRP investigation [47] an advanced shear machine has been develop-ed which is able to expose a cylindrical specimen, 150 mm in diameter and 60 mm thick, to various stresses. The test could be conducted under constant volume. This is interesting in order to eliminate the effect of densification and dilation on the mix resistance to shear deformation [48]: The test can also be run under con fined pressure (Figure 19).
MlCROCOMPUTEH
Mon w
somm
FHD. DIA Com nod
[: h coumoum commentsm l 4m L 12 crm-nu
(__ j iL
-*En-iom CMMEH! # (on mna pom)
* Specimen
AIR '
QH
J k
Temperature Servo hydmnic Hydraulic Control Unit Load Swim . Pump
Figure 19 SHRP test device [47].
Figure 20 shows the VTI s recently-built shear test. A cylindrical specimen is glued between two steel plates with epoxy glue. One of them can be exposed to sinusoidal or repetitive loading over a range of frequencies. A normal constant compressive stress is applied axially to the specimen. Briquette specimen, nor mally 150 mm in diameter are used. The thickness of the specimen should be less
VTI. Bituminous Mixes and Aggregates Safwat Said/GS
29 (37)
than about % of the diameter in order to be close to pure shear state. Therefore, it
is possible to test thin specimens with actual pavement layer thickness. An
example of the test results is shown in Figure 21. The relationships between dyna mic shear modulus (G) and reduced frequency are illustrated by master curves.
Figure 20 VTI 's shear test.
VTI, Bituminous Mixes and Aggregates Safwat Said/GS
30 (37)
1E+4 "_: a _ Q _
ä
5 1E+3 ;
3 __. b _ O _;E
i
g <3 _ (D Q U) _ __ _- _ _ _ AB16/8851E+2 j
___AB16/B180
"5
-4
-2
O
2
4
Log (a T. F)
Figure 21 Master curve of bituminous mixes.
The viscosity (11) of the mix can determined by: n = 6/0)
where (o is radial frequency in radians/sec.
The outline of this investigation on permanent deformation methods is that the WTT simulates well the field condition and it is suitable in verifying the test results from other test methods. This is especially important when testing new
VTI, Bituminous Mixes and Aggregates Safwat Said/GS
31 (37)
mixes. The creep test is most practical for routine measurements because it is a simple and rapid test and the specimens are easily obtained either in the laboratory or cored from the pavement layer. The shear test is probably most powefull and applicable in analytical mix design and in the analysis of layered structure. It is, however, time consuming and relatively complex.
VTI, Bituminous Mixes and Aggregates Safwat Said/GS
32 (37)
REFERENCES
1. Van der Poel, C.; A General System Describing the Viscoelastic Properties of Bitumens and its Relation to Routine Test Data . Shell Bitumen Reprint, No 9, 1954.
2. Ullidtz, P.; Pavement Analysis . Institute of Roads, Transport and Town Planning. The Technical University of Denmark, Lyngby. Elsevier Publishers,
1987.
3. Brown, S.F.; Mechanical Properties of Bituminous Materials . Asphalt Tech-nology, The Journal of the Institute of Asphalt TechTech-nology, No 25, November
1978.
4. ASTM D3497-79; Dynamic Modulus of Asphalt Mixtures.
5. Shook, J.F. and Kallas, B.F.; Factors In uencing Dynamic Modulus of Asphalt Concrete . Proceeding, The Association of Asphalt Paving Techno-logists, Vol. 38, 1969.
6. Bonnaure, F., Gest, G., Gravious, A. and Uge, P.; A new Method of Predic-ting the Stiffness of Asphalt Paving Mixtures , Proceeding. The Association of Asphalt Paving Technologists, 1977.
7. Van Dijk, W. and Visser. W.; The Energy Approach to Fatigue for Pavement Design , Proceedings. The Association of Asphalt Paving Technologists, Vol. 46, 1977.
VTI, Bituminous Mixes and Aggregates Safwat Said/GS
33 (37)
8. Verstraeten, J.; Moduli and Critical Strains in Repeated Bending of Bitumi-nous Mixes, Applications to Pavement Design , Proceedings. 3rd Int. Conf. on the Structural Design of Asphalt Pavements, London 1972.
9. Bonnaure, F., Huibbers, A.H.J.J. and Bounders, A.; A Laboratory Inves-tigation of the In uence of Rest Periods on Fatigue Characteristics at Bitumi nous Mixes , Proceedings. The Association of Asphalt Paving Technologists, Vol. 51, 1982.
10.Huhtala, M., Alkio, R., Pihlajamäki, J., Pienimäki, M. and Halonen, P.; Behaviour of Bituminous Materials under Moving Wheel Loads , Procee-dings. The Association of Asphalt Paving Technologists, 1990.
11.Klump, A.J.G. and Niesman, T.W.; Observed and Calculated strains at Various Depths in Asphalt Pavements , 2nd Int. Conf. on the Structural Design of Asphalt Pavements, 1967.
12.Deacon, J.A. and Monismith, C-L.; Laboratory Flexural Fatigue Testing of Asphalt Concrete with Emphasis on Gumpound loading Tests , HRR No.158,
1967.
13.Kallas, B.F. and Riley, C.; Mechanical Properties of Asphalt Pavement Materials , Proceedings. 2nd Int. Conf. on the Structural Design of Asphalt Pavements, 1967.
14.Monismith, C-L. and Wallace, K.; Pavement Design Considerations for Two-layer Pavements Containing Open-Graded Asphalt Mixtures , Procee dings. The Association of Asphalt Paving Technologists, 1982.
VTl, Bituminous Mixes and Aggregates Safwat Said/GS
34 (37)
15.Emery, J.; Resilient Moduli of Flexible Pavement Components , Proceedings at the 27th Annual Conference at the Canadian Technical Asphalt Association,1982.
16.Pell, P.S. and Brown, S.F.; The characteristics of Materials for the Design of Flexible Pavements Structures . Proceedings 3rd Int. Conf. on the Structural Design of Asphalt Pavements, 1972.
17. , ASTM D4123-82; Method of Indirect Tension Test for Resilient
Modulus of Bituminous Mixtures.
18. , FAS; The Swedish Asphalt Pavement Association, FAS method 454
91. Determination of Resilient Modulus of asphalt concrete by indirect tension test. In Swedish.
19.Kennedy, T.W.; Characterization of Asphalt Pavements Materials Using the Indirect Tensile Test . Proceedings of the Association of Asphalt Paving Tech-nologists, 1977.
20.Hadley, W.(). and Vahida, H.; Fundamental Comparison of the Flexural and Indirect Tensile Test . Transportation Research Record 911, 1983.
21.Cooper, K.E. and Brown, S.F.; Development of Apparatus for Repeated Load Testing in Creep and Indirect Tension . 4th Eurobitume Symposium,
1989.
22.Brown, S.F. and Cooper, K.E.; The Mechanical Properties of Bituminous Materials for Road Bases and Base courses . Proceedings of the Association of Asphalt Paving Technologists, 1984.
VTI, Bituminous Mixes and Aggregates Safwat Said/GS
35 (37)
23.Said, S.F.; Resilient Modulus by Indirect Tensile Test . Proceedings at the 4th International RILEM Symposium 1990.
24.Said, S.F.; Determination of Stiffness Modulus of Asphalt Concrete by
Indirect Tensile Test . NVF Seminar in Finland, NVF-rapport 4, 1994.
25.Sousa, J.B., Taylor, R. and Tanco, A.J.; Analysis of Some Laboratory Testing Systems for Asphalt-Aggregate Mixtures . Preprint, Transportation Research Board, 70th Annual Meeting, 1991.
26.Tayebali, A.A., Tsai, B-W. and Monismith, C.L.; Stiffness of Asphalt Aggregate Mixes . SHRP-A 388, 1994.
27.Kim, Y.R., Shah, K.A. and Khosla, N.P.; In uence of Test Parameters in SHRP P O7 Procedure on Resilient Moduli of Asphalt Concrete Field Cores . Transportation Research Record 1353.
28.Kallas, B.F.; Elastic and Fatigue Behaviour of Emulsified Asphalt Paving Mixes . Asphalt Institute, Research Report No. 79 1, 1979.
29.Mamlouk, MS. and Sarofim, R.T.; The Modulus at Asphalt Mixtures an
Unresolved Dilemma . Transportation Research Board, 67th Annual Meeting, 1988.
30.Pell, P.S.; Pavement Materials . 6th Int. Conf. on the Structural Design of Asphalt Pavements, vol II, 1987.
31.Cooper, K.E., Brown, S.F., Preston, J.N. and Akeroyd, F.M.L.; Develop-ment of a Practical Method for the Design of Plat Mix Asphalt . Transportation Research Board, 70th Annual Meeting, 1991.
VTI, Bituminous Mixes and Aggregates Safwat Said/GS
36 (37)
32.Cooper, K.E. and Brown, S.F.; Assessment of the Mechanical Properties of Asphaltic Mixes on a Routine Basis Using Simple Testing Equipment , 5th Eurobitume Congress, Stockholm, 1993.
33.Djärf, L. and Said, S.F.; Laboratory Fatigue Properties Compared with Field Performance , 5th Eurobitume Congress, Stockholm, 1993.
34. ; Swedish Specification and guidelines 1984. Road Administration.
35 .Brown, S.F.; Bituminous Pavements: Elastic Stiffness and Permanent Defor-mation . Lecture on Bituminous Pavement: Material, Design and Evaluation, Oulu, September 1993.
36.Eisenmann, J. and Hilmer, A.; In uence of Wheel load and In ation Pres sure on the Rutting Effect of Asphalt - Pavements Experiments and Theore-tical Investigations , 6th Int. Conf. on the Structural Design of Asphalt
Pave-ments, 1987.
37.Bolk, H.J.N.A. & van de Loo, P-J.; The Creep Test: A Routine Method for the Design of Stable Asphalt Mixes . Eurobitume, London, 1978.
38.Van de Loo, P-J.; The Creep Test: A key tool in asphalt mix evaluation and in the prediction of Pavement rutting . Shell Bitumen Reprint, 1978.
39.Koole, R.C., Valkering, C.P. and Lancon, D.J.L.; Development of a Multi-grade Bitumen to Alleviate Permanent Deformation . Shell Bitumen Reprint,
1991.
40.Asko, S.; Asphalt Pavements Design . ASTO no. 1, Technical Research
Centre at Finland, 1993.
VTI, Bituminous Mixes and Aggregates Safwat Said/GS
37 (37)
41.B0nn0t, J.; Asphalt Aggregate Mixtures . Transportation Research Record 1096, 1986.
42.Heikkilä, J.; Deformation Properties of Asphalt mixes . Proceedings ASTO Conference, VTT Special report no. 9, 1991.
43.Jacobson, T.; Study of the wear resistance of bituminous mixes to studded tyres , VTI Särtryck no. 224A, 1994.
44.Sousa, J.B., Craus, J. and Monismith, C.L.; Summary Report on Permanent Deformation in Asphalt Concrete . SHRP-A/IR49 1- 104, 199 1 .
45 .Lempe, U.; Determination of the Dynamic Modulus of Shear and the Fatigue Life of Bitumen Bound Materials . 3rd Int. Conf. on the Structural Design of Asphalt Pavements, 1972.
46.Junker, J.P.; Entwicklungen zur Bestimmung mechanischer Materialkenn-werte an bituminosen Baustoffen, insbesondere an Asphalt . EMPA Bericht Nr. 215, 1987.
47.M0nismith, C.L., Deacon, J.A. and Sousa, J.B.; SHRP Deformation Test The Key Component , VTI conference. Proceedings, SHRP and Traffic Safety on Two Continents Nr 1 A, Part 3, Hague, 1994.
48.Sousa, J.B.; Asphalt Aggregate Mix Design Using the Repetitive Simple Shear Test (constant Height) . The Association of Asphalt Paving Techno logists, 1994.
VTI, Bituminous Mixes and Aggregates Safwat Said/GS
![Figure 3 Relationship between resilient modulus and temperature of sand mixfor various loading times and loading frequencies [28].](https://thumb-eu.123doks.com/thumbv2/5dokorg/4916559.135396/12.892.206.715.182.731/figure-relationship-resilient-modulus-temperature-various-loading-frequencies.webp)
![Figure 3 Illustration of deformation signal from ITT (VTI) and transversal strain Signal under vehicle passage [10].](https://thumb-eu.123doks.com/thumbv2/5dokorg/4916559.135396/15.892.250.650.107.706/figure-illustration-deformation-signal-transversal-signal-vehicle-passage.webp)