International
migration and
economic growth in
Baltic and Nordic
countries
BACHELOR THESIS WITHIN: Economics
NUMBER OF CREDITS: 15 credits
PROGRAMME OF STUDY: International Economics
AUTHOR: Agne Kacerauskaite, Anna Loukagkou
Bachelor Thesis in Economics
Title: International migration and economic growth in Baltic and Nordic countries Authors: A. Kacerauskaite, A. Loukagkou
Tutor: Lina Bjerke Date: 2020-05-18
Key terms: migration, economic growth, Baltic, Nordic.
Abstract
International migration is a highly discussed topic, with its repercussions on economic growth, labour force, population’s age-distribution, and many others. While most of the literature focuses on how immigration affects economic growth, this paper aims to shed a light on emigration and its effects on the source countries.
Using a two sets of panel data for Baltic and Nordic countries for the time frame between 1990 and 2017, the authors aim to find the relationship between immigration and economic growth, and emigration and economic growth. Regression outputs conclude a positive
relationship between emigration and economic growth in the Nordics and a negative one with the Baltics. However, no significant relationship is found between immigration and real GDP. Based on the regression results, discussion on possible policies targeted to increase the
Table of Contents
1
Introduction ... 1
1.1 Background ... 3
2
Literature Review ... 5
2.1 Growth and Labour Markets ... 5
2.2 Migration and Human Capital ... 6
2.3 Economic Growth, Population Ageing and Migration. ... 8
2.4 Migration and Growth: Empirical Evidence ... 10
2.5 Emigration impact on sending countries ... 12
3
Model ... 13
4
Data and Analysis ... 16
5
Results... 18
6
Discussion ... 21
7
Conclusion ... 24
8
References ... 25
Appendix A. ... 29
Appendix B. ... 31
1. Baltic countries ... 31 2. Nordic countries ... 331
1 Introduction
International migration has become a significant topic nowadays. According to United Nations of Economic and Social Affairs, the number of international migrants in 2019 has now reached 272 million, surpassing the world’s population growth (UN, 2019).The importance of migration is reflected in changing political agendas for example anti-immigrant policies implemented by the Trump administration in the United States, or the European Migrant Crisis challenging the idea of European Union’s open borders. Although in such policy making migration is often perceived to have extreme negative effects on the economy, the actual economic theory and research suggests different perspectives.
One of the biggest demographic challenges in Europe is population decline it is forecasted to be offset by international migration rather than natural population change. This is shown in Figure 1, where from 1990 the positive net change in Europe’s population is caused by net migration only. Falling fertility rates, increasing longevity and in turn ageing populations have put pressure on the health and pension systems in many European countries. That is where international migration comes into place- it boosts the labour market and slows down population ageing process due to 74% of international migrants in the world being of working age (UN, 2019). However, the important distinction must be made between source and destination countries, specifically, Nordic and Baltic countries, (which are the focus of this paper). Nordic countries in our case are Denmark, Norway and Sweden, while Baltic countries refer to Estonia, Latvia and
Figure 1. Contribution of natural change and net migration to the total population change in Europe. Source: International Migration 2019: Report
2
Lithuania. Although both regions share the same labour market challenges related to demographic changes mentioned above, Nordic countries have been experiencing positive net migration, while negative net migration of the Baltics deepen the demographic problems (see Figure 2).
Population size and its age structure affects economic growth through consumption and saving patterns, changes in human capital and public expenditure. Therefore, this paper attempts to analyse the economic implications of such substantial demographic changes, specifically caused by migration patterns in both source and destination countries. The source countries- Estonia, Latvia, and Lithuania have respectively lost 6 percent, 9 percent and 13 percent of its population due to migration over the 2000s (OECD, 2013). While the destination countries- Denmark, Norway and Sweden continue to have increasing population due to positive net migration.
As it will be seen in the literature review of this paper, previous researches and economic theories do not agree on the relationship between migration and economic growth in different countries.Therefore, the purpose of this paper is to investigate this relationship in cases of Sweden, Norway, Denmark, Lithuania, Latvia and Estonia, between the years 1990 and 2017. While the main focus in the literature is on countries experiencing positive net migration, the countries with negative net migration are often overlooked. For that reason, our paper is contributing to fill that gap in the literature by testing the impact of migration in the Baltic countries. Additionally, the same analysis done for the Nordic countries is used for the comparison.
3
Figure 2. Contribution of net migration and natural population growth to the total population growth 1990-2017. Source: Eurostat
1.1 Background
Historically, the Nordic and the Baltic countries differ a lot when it comes to migration. Since their declared independence in the early 1990s, all three Baltic states have experienced high emigration rates. During that period, Nordic countries experienced positive population growth, where two thirds of that growth were a result of immigration (Figure 2).
Three biggest waves of emigration in the Baltic states happened after certain major socio-economic or political changes. The first emigration wave is observed after countries’ independence in the beginning of the 1990s after half a century of Soviet occupation (OECD, 2013). Later in 2004, Baltics joined the EU which opened the international borders. The last and the most severe wave happened after 2008 financial crisis due to economic decline and increased unemployment (Hazans, 2016). All these events have caused Baltic population’s decline to be one of the highest in Europe.
Economic motives are observed to be the main forces driving emigration from the Baltic countries (OECD, 2013). In order to understand the implications of the emigration on economic growth, the human capital of the migrants should be considered. OECD (2013) observes that most Lithuanian and Latvian emigrants tend to have long-term or even permanent emigration patterns.
- 15.0 - 10.0 - 5.0 0.0 5.0 10.0 D en m ar k Es to ni a La tv ia Li th ua ni a Sw ed en N or w ay
Crude rate of natural change of population Crude rate of net migration plus statistical adjustment
Crude rate of total population change
4
Additionally, the human capital profile of Latvian and Lithuanian emigrants has been changing- the percentage of migrants with higher education has been increasing. Estonian emigrants, on the other hand, are on average of the circular type: blue-collar workers working abroad temporarily. Studies show that human capital is the most significant historical factor driving current economic growth (Diebolt & Hippe, 2019). Considering that Latvia and Lithuania are both losing highly educated part of their labour force to migration, the policymakers, concerned with both the future economic growth and demographic changes, are now acknowledging migration as an urgent problem.
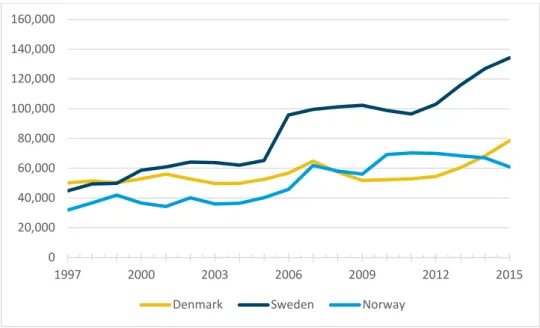
The Nordic countries have experienced increasing immigration flows (Figure 3). Up until the start of 1970s, the main pull factor of immigration in the Nordic countries was employment (Pettersen & Østby, 2013). One of the most recent and important events in the migration history of the Nordics is the most recent refugee crisis in 2015. Relative to their small populations, Nordic countries have received most asylum seekers compared to other high-income European countries (Karlsdóttir, Norlén, Rispling, & Randall, 2018). Although Norway is not a member state of the European Union, it does not prevent labour migrations from EU since Norway is a part of the European Economic Area. Notably, Norway has experienced relatively greater labour immigration from the EU than Sweden and Denmark have.
Figure 3. Immigration to Denmark, Sweden and Norway 1997-2015. Source: Eurostat
0 20,000 40,000 60,000 80,000 100,000 120,000 140,000 160,000 1997 2000 2003 2006 2009 2012 2015
5
2 Literature Review
There are numerous studies on the effects of migration on economic growth across and within countries. This section provides models and empirical researches made on migration and its various effect on the economic growth. Most of the migration literature is based on measuring the labour market effects of migration, and especially on native workers’ wages (Borjas G. J., 2003; 2009). Whether migration positively or negatively affects economic growth on the receiving or sending country, the impact mostly depends on the immigration flow and the demographic characteristic of it.
2.1 Growth and Labour Markets
According to Borjas (1995) the immigration surplus is used to analyse the impact of increased migration on the host country. Wages and employment depend on the relationship between labour supply and demand. With incoming migrants, the supply of labour increases and the market wages fall below the equilibrium level. As a result, native workers earn less, total employment increases and national output increases. The expanded output results in an increase in income to capital owners offsetting the loss in the natives’ wages and therefore, a net increase in national income.
In addition, the literature distinguishes the effect of the inflow of migrants into two different approaches, the traditional and the ‘new’. In the traditional approach, migrants having the same level of educational attainment compete in a direct way with natives, as their arrival in the host country increases the skill supply, decreasing relative wages. As natives have no other way to counteract the pressure of immigration, namely for the fact that they do not have the opportunity of alternative labour markets, they migrate to different areas of the country (Card, 2001; Hatton & Tani, 2005). Therefore, the result of an increased type of labour decreases natives’ wages for that same type of labour relatively to others. As a direct effect of that, other occupations that have become relatively scarcer have higher returns.
An important component of the traditional approach is that it only considers direct effects of the increased labour supply due to immigration inflow. On the contrary the new approach takes into consideration both direct and indirect effects. Indirect effects include for instance an increase in consumption or government spending or even higher demand
6
for labour as there is a possibility of new firms entering the country, namely for the higher population.
The literature as stated by Peri (2016), considers increasing returns to scale from human capital accumulation, specialization in skills and tasks, market integration, and gains from increased supply of scientist and engineers. These developments in the literature, view the inflow of migrants as inputs that contribute to different parts of the production, where the level of education is an important factor for differentiating labour. As a result, natives and migrants are considered to be complementary in production (Autor, Katz, & Kearney, 2008).
In the Heckscher-Ohlin model, trade and migration are substitutes, meaning that migration decreases as trade increases (Mundell, 1957). According to the model, labour moves from regions where the marginal productivity is low to where the marginal productivity is high. Eventually, resulting in wage convergence between the host and source countries. In the case of the source country there is going to be a rise in wages and a fall in capital returns, a rise in per capita income and a fall in national output. On the contrary, the receiving country will experience a fall in wages as the country receives more workers and a rise in capital returns. Per capita income will decrease, although national incomes increases.
2.2 Migration and Human Capital
Mankiw Romer and Weil (1992) develop a model where he showed that increased permanent migration flows, negatively affect the long-term economic growth due to capital dilution. However, Dolado, Goria and Ichino (1994) modify the Mankiw et al. (1992) model by including immigration in the working population growth rate and human capital accumulation. In this way, the negative impact on capital can be offset with new migrants contributing to human capital accumulation. This human capital accumulation in the receiving country, resulting from migration, affects per capita GDP. If the level of capital owned by immigrants is low, then their contribution to the receiving country is a faster population growth and a decrease in per capita GDP. If the immigrants’ human capital, however, is higher than the natives’, there is going to be a faster population growth in speeding up income (Friedberg & Hunt, 1995; Benhabib, 1996).
7
Drinkwater, Levine, Lotti and Pearlman (2002) survey theoretical long-run growth models related to human capital through two different approaches.
The first approach by Reichlin and Rustichini (1998) focus on growth as a result of human capital accumulation. Using a two-country model with mobile capital and labour, they assume that the level of technology is an increasing function of the capital stock, technologically identical but with different factor of productions endowments. In their research on constant migration flows and absence of cross-country convergence, they found that the determinants of labour migration are the size and the composition of the workforce.
In the second approach they include migration in endogenous economic growth models, by considering the impact of immigrants on technological progress namely in innovation. This is seen for example in Walz (1995) model which consists a two-country endogenous growth based on Lucas (1998) which views growth as a result of human capital accumulation. What he finds is that growth rate depends on the initial level of specialization of the two countries and that workers with high skills are more likely to choose to migrate. Furthermore, unskilled labour migration has also been investigated by Robertson (2002) using an Uzawa-Lucas model, whose results show a lower transitional growth.
Dolado, Goria and Ichino (1994) estimate the relationship between economic growth and migration which consisted of 23 OECD countries in the time period 1960-1985. The results from the analysis showed a negative relationship between immigration and per capita income growth. However, in the period that the analysis was made the population was characterized by low-skilled migration in the manufacturing sector. The situation although has changed in the last two decades as the educational attainment of the population has increased significantly, therefore the impact of migration must be further analysed.
In their analysis Ortega and Peri (2009) they investigate the effects of immigration on total employment, physical capital accumulation and total factor productivity in 14 OECD countries in the time period 1980-2005. Although, this assessment does not give consideration for the human capital of migrants or their country of origin. Their results for the effects of migration were significant and showed a positive relationship for the
8
cases of employment and capital accumulation however, for the case of total factor productivity they did not have such a significant effect. The reason behind this is the fact that inflows of migration in the country increases total employment in proportion to the production and therefore the output per capita is not overwhelmed.
In a related analysis, Boubtane, Dumont and Rault (2016) investigate the relationship between migrants’ human capital and GDP per capita and showed that not only it was positive but also that permanent increase in migration leads to a positive increase in GDP per worker.
2.3 Economic Growth, Population Ageing and Migration.
The accelerated population ageing in both the developed economies and on the majority of the rest of world has been proven to have detrimental effects on the economic growth, through decreased productivity levels (Nagarajan, Teixeira, & Silva, 2016).
Maestas and Powell (2016) use cross-sectional variation in the fraction of population ageing across U.S states over the period 1980-2010 to estimate the effect of ageing on GDP per capita. They find that a 10% increase in the fraction of the population over 60 decrease growth rate of GDP per capita by 5.5%, where the two thirds of the reduction is caused by labour’s productivity slower growth and one third resulting from slower labour force growth. Their results imply that annual GDP growth will slow down by 1.2% this decade and 0.6% next decade as a result of population ageing. Lindh and Malmberg (1999) agree on the topic in a comparable study that investigate the relation between demographics and growth. They study the population and economic growth of the OECD countries from 1950 to 1990 and find that the rate share of the elderly population increased gradually. They find some evidence that supports the belief that the fraction of the population over 50 has a negative impact on GDP per capita. Feyer (2007) on the study using a panel data on OECD and low-income countries from 1960 to 1990 also finds that productivity growth increases with the proportion of workers aged 40 to 49 and decreases as the proportion of those who are over 50 rises.
Persson (2004) studies the impact the age distribution in the U.S. population has on the economic growth for time period 1930 and 2000. The findings show that growth in all age groups, except for the people under the age of 14 and people over 65, have a positive impact on output per capita. The negative effect on output from the people over the age
9
of 65, shows that an increased share of elderly has a detrimental effect on economic growth.
A contrarian approach by Acemoglu and Restrepo (2017) represent evidence that the effect of a change in the age structure in the population does not have negative impacts on GDP per capita but is positively correlated with the adoption of robots and advanced information technology. Prettner (2012) and Lee Mason and Park (2011) share this belief and claim that a positive relationship between ageing and economic growth exists. According to Prettner (2012) older individual’s tendency to save more results in providing more resources for investment, which positively affects economic growth.
According to Bloom, Canning and Fink (2008), while they find that the effects of population ageing appear to be negative in the short-run, the long-run effects seem to be insignificant. They argue that the negative effects have been reduced by behavioural responses such us higher savings for retirement, greater labour force participation and increased labour immigration from developing countries.
Having said that, literature also investigates whether immigration can help prevent the negative effects of ageing. The debate on to what extent the dynamics of migration flows can alleviate the small number of births due to the low fertility and counteract population ageing has been broadly discussed over the last two decades
In his research on ‘’Can immigration save the ageing problem in Italy? Not really…’’, Gustavo De Santis (2011), referring to the case of Italy, provides simulations while considering a period of 300 years. Making the division of the population in Italian, foreign and foreign-born, he assigns a Total Fertility Rate of 2.4 to foreign women and 1.4 to women of the other groups and makes simulations with and without migration. His findings and conclusions state that in the short-term migration can prevent the negative effects of ageing due to low fertility rates. However, he claims the opposite when considering the long-run due to the pathologically low fertility and the progressive ageing of the population. Another study which finds the same distinction of effects between the short-run and the long-run is by Giuseppe Gesano and Salvatore Strozza (2011), where they investigate the Italian case using Istat demographic projections. Their analysis shows that immigration plays a crucial role in reducing population ageing in the short run, but it can reverse the trend of a population ageing only under a large inflow of immigrants.
10
Anna Paterno (2011) investigates the relationship between fertility, migration and ageing in 100 Italian provinces in the time period 2001-2009. Her analysis provided results which underlined that increases in the fertility rates are far more effective than immigration in an effort to increase the average age of the population.
Attempts to investigate the role of immigration as a measure against population ageing made by Feld (2000), United Nations (2000), Coleman (2002), Espenshade (2001), Lesthaghe (2000) have been carried out through the concept of ‘replacement migration’. These studies show that there is a specific number of immigrants required in order to sustain the population structure and mitigate population ageing. Thus, reasonable migration flows can influence the age structure of the receiving country’s population but only to a limited extent. Making fertility rates increase a more significant factor in that respect, especially in the long run.
The majority of the literature on the effects of immigration on ageing focuses on the impact of immigration on the labour market and the welfare state (Nannestad, 2007). A shortcoming of this approach is not taking into account the impact of ageing and immigration on capital formation and economic growth. Razin and Sadka (1999; 2000) were the first ones to analyse the effect of immigration on ageing in a long-run general equilibrium, while taking this effect into consideration. Immigration is also proven to counteract the lack of labour supply that results from population ageing (EU, 2005; Freeman, 2006; OECD, 2012).
2.4 Migration and Growth: Empirical Evidence
Felbermayr, Hiller and Sala (2010) and Ortega and Peri (2014) use bilateral migration flows for the year 2000 to test the relationship between the immigrant share of the population and GDP per capita in the receiving country. Ortega and Peri in 2014 find that relationship to be positive and with a more significant effect when the diversity of the origin of immigrants is taken into consideration. Another study that goes along with their conclusion, is made by Alesina, Harnoss and Rapoport (2013) where he also finds a positive relationship between diversity of immigrants by country of origin and education on growth. A later study by Bellini, Ottaviano, Pinelli and Prarolo (2013) in EU destination areas also find that the shares of immigrants in the total population positively affects income per capita GDP.
11
Time series analysis have also been used to investigate the relationship between migration and economic growth. For instance, Morley (2006) analyses the relationship of migration and economic growth for Australia, Canada and the united states for the time period 1930-2002. His findings showed a long-run causality going from GDP per capita to immigration and not the other way around. In the same context, Boubtane, Dumont and Rault (2016) in their research on 22 OECD countries from 1987-2009 found a positive relationship between immigration and GDP per capita. However, his results showed the causality running from both sides, unlike the previous research discussed.
Contrary with the above researches, Barro and Sala-i-Martin (1992) analyse the same relationship in the case of US and Japan, but the results showed that immigration has a positive impact on growth, although small in magnitude.
Additionally, Friedberg and Hunt (1995) in their paper examine the empirical literature on the positive effects of immigration for the receiving country by looking if there are any complementarities between migrants and native factors and the effects of immigration on growth. The findings for both US and Germany showed no significant impact of immigrants on employment and wages.
Sparber (2010) investigates the relationship between diversity, as a measure of immigrants’ employment, and per capita GDP variation on 48 US states in the time period 1980-2000. The results show a significantly positive effect of diversity on GDP per capita. The relationship becomes insignificant however, when considering fixed effects for time invariant income explanatory variables other than diversity. Specifically, Sparber (2010) uses an alternative approach to measure the effects on economic growth of the receiving country, total factor productivity. In contrast to the effect of diversity on wages, in this case the he finds the effect to be much smaller.
Later in 2017 by a study from Bove and Elia (2017), the relationship between diversity of immigrants and economic growth is also found positive, namely due to the fact that immigrants bring in the country new skills and knowledge despite of creating communication barriers and decreasing social cohesion.
Huber and Tondl (2012) examine the effects of immigration on unemployment and GDP in EU27 NUTS2 regions for the years 2000-2007. They also find positive effects of immigration od GDP per capita, while the unemployment rates remain stable. Their
12
results showed that an increase in immigration by 1 per cent leads to only 0.02 per cent increase in GDP and 0.03 per cent higher productivity. However, in the long run the effects are estimated at about 0.44 per cent increase in GDP and 0.20 per cent increase in productivity.
2.5 Emigration impact on sending countries
Empirical studies on the impact of immigration in the host countries tend to find a positive relationship, however the empirical evidence for the impact of emigration on the source countries is less clear (IMF, 2016). To the best of our knowledge, studies on emigration’s impact is rather neglected (Clemens, 2011). This paper, therefore, attempts to enrich literature in the matter.
A study by Baas, Brucker & Hauptmann (2010) based on migration scenarios of emigrants from the New Member States (NMS)1 between 2004 and 2007 found an
increase of 0.2% in aggregate GDP regarding the whole EU. The case for the emigrant countries, however, was a decreased GDP by 1.1% in the long-run due to the loss of labour. In particular, they analyzed the effect of migration on labour markets in both old (EU15) and NMS (EU8) from 2004 to 2007. In the short-term wages were decreased by 0.1% in EU15 and increased by 0.3% in EU8 and unemployment rates increased by 0.1% and decreased by 0.4% respectively. In the long-term it was found that migration impact on wages and unemployment was insignificant, after capital stocks were adjusted. Eurostat and UN projections on continued net migration flows for the time period of 2015 to 2030 indicates a reduced level of real GDP and GDP per capita on countries experiencing negative migration. The numbers in particular indicate an aggregate output decrease of approximately 9% and a 4% decline for GDP per capita in some countries (IMF, 2016, p. 28).
On the contrary, using a computable general equilibrium model for India Ahmed and Walmsley (2009) measure the impact of temporary migration on the sending country. They find that increased temporary migration affects positively the Indian economy. Similar evidence is found by Cantore & Massimiliano (2015) where they analyse the
1 Countries included in the New Member States are Czech Republic, Estonia, Hungary, Latvia, Lithuania, Poland, Slovakia and Slovenia.
13
impact of migration on growth, development and poverty in the developing countries. While they discover positive effects of migration on development and GDP, they also find that migration reduces poverty in the sending country, as it increases remittances, labour productivity, trade and foreign direct investment and by contributing to incentives for human capital accumulation. All these factors cancel out the negative effects of ‘’brain drain’’. In both investigations temporary migration causes migration to have positive effects on GDP due to productivity gains in the home country from returning migrants. The results from permanent migration appear through simulations to not have such beneficial results.
3 Model
In this section we describe the econometric model used to analyse the effect of migration on economic growth. Descriptions and sources of variables used in the analysis are shown in Table 3-1. Correlation tables for the independent variables are available in the Appendix A (Table 0-1 for Baltics and table 0-2 for Nordic countries). The dependent variable, economic growth, is measured by the change in the logged real gross domestic product per capita. Immigration and emigration are our variables of interest. To find the true causal effects of migration, we use other control variables that affect GDP per capita. We employ a human capital augmented Cobb-Douglas production function2:
𝑌 = 𝐾 𝐻 (𝐴𝐿)
Where K is the stock of physical capital, H is the stock of human capital and AL represents the effective labour. The empirical findings of this model conclude that output depends on population change, human capital, and physical capital (Boulhol, de Serres, & Molnar, 2008).
Population growth is divided into net migration and natural population growth. Additionally, net migration is split into two variables: immigration and emigration. That is done in order to obtain the specific effects of in and out migration on economic growth. Following the common practice of previous literature, we measure human capital as a share of tertiary educated people in the labour force (Boubtane, Dumont, & Rault, 2013;
2 used in a human capital augmented Solow-Swan model (Mankiw, Romer, & Weil, 1992), an extension of the basic model (Solow, 1956).
14
Noja, Cristea, Yüksel, Pânzaru, & Dracea, 2018). Additionally, tertiary education is observed to be more important for the economic growth of OECD countries (OECD, 2008).
Two definitions of physical capital are tested in this paper: real capital stock and total investment share of GDP as a proxy.
Finally, government expenditure and gross domestic savings are added as control variables. Government expenditure is found to have a strong negative relation to GDP (Aiginger & Falk, 2005), while gross domestic savings positively affect income growth (Bergovic & Ciftcioglu, 2010).
15 Table 3-1. Variables and data sources
Variable Description Measured as Source
gdp Logged real GDP per
capita growth Real GDP in constant 2011 national prices, (US dollars) logged and divided by population
Penn World Table v9.1
immigr Change in share of immigrants of the labour force
Number of immigrants divided by the labour force in the host country
Eurostat emigr Change in share of
emigrants of the labour force
Number of emigrants divided by the labour force in the source country
Eurostat
natural_pop_growth Change in natural
population growth Births-deaths Eurostat
edu Share of tertiary
educated people in the labour force
Percentage of people with ISCED 5-8 in the country’s labour force
Eurostat capital Real capital stock Capital stock at
constant 2011 national prices (in mil. 2011US$)
Penn World Table v9.1
inves Investment share of GDP Share of gross capital formation of nominal GDP
Penn World Table v9.1
govexp Total government
expenditure share of nominal GDP
Total government consumption divided by nominal GDP
Penn World Table v9.1
savings Gross domestic savings share of GDP
Share of gross domestic savings of nominal GDP
16
4 Data and Analysis
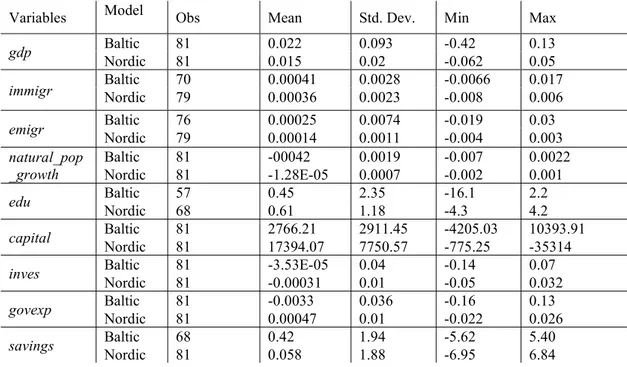
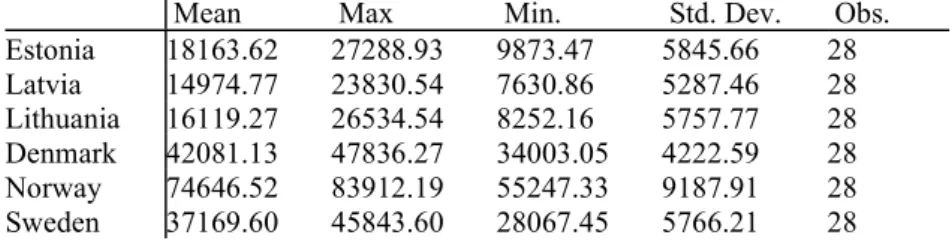
The analysis is done using two panel data sets each consisting of data from three countries each. The first one includes Baltic countries: Estonia, Latvia and Lithuania. The second panel includes Nordic countries: Denmark, Norway, and Sweden. The time frame for both panels is 1990 through 2017. However, we have an unbalanced data set mostly due to Baltic countries’ lack of certain data for former years. Table 4-1 below presents the descriptive statistics of all the variables used in regression analysis, separately for Baltic and Nordic countries. Tables 4-2 through 4-4 below present descriptive statistics for real GDP per capita, emigration and immigration for each country. In this data set, all Baltic states experience lowest immigration flows relative to their labour forces and lowest real GDP per capita. Norway has the highest real GDP per capita on average, Denmark receives the most immigrants relative to the labour force, while Latvia displays lowest numbers on both measures. Additionally, Lithuania and Latvia experience highest emigrant flows on average, while Estonia and Sweden display the lowest numbers for this data set.
Table 4-1. Descriptive Statistics
Variables Model Obs Mean Std. Dev. Min Max
gdp Baltic Nordic 81 81 0.022 0.015 0.093 0.02 -0.42 -0.062 0.13 0.05 immigr Baltic Nordic 70 79 0.00041 0.00036 0.0028 0.0023 -0.0066 -0.008 0.017 0.006 emigr Baltic Nordic 76 79 0.00025 0.00014 0.0074 0.0011 -0.019 -0.004 0.03 0.003 natural_pop
_growth
Baltic 81 -00042 0.0019 -0.007 0.0022 Nordic 81 -1.28E-05 0.0007 -0.002 0.001 edu Baltic Nordic 57 68 0.45 0.61 2.35 1.18 -16.1 -4.3 2.2 4.2 capital Baltic Nordic 81 81 2766.21 17394.07 2911.45 7750.57 -4205.03 -775.25 10393.91 -35314 inves Baltic Nordic 81 81 -3.53E-05 -0.00031 0.04 0.01 -0.14 -0.05 0.07 0.032 govexp Baltic Nordic 81 81 -0.0033 0.00047 0.036 0.01 -0.16 -0.022 0.13 0.026 savings Baltic Nordic 68 81 0.42 0.058 1.94 1.88 -5.62 -6.95 5.40 6.84
17
Table 4-2. Real GDP per capita (in USD) descriptive statistics for each country Mean Max Min. Std. Dev. Obs. Estonia 18163.62 27288.93 9873.47 5845.66 28 Latvia 14974.77 23830.54 7630.86 5287.46 28 Lithuania 16119.27 26534.54 8252.16 5757.77 28 Denmark 42081.13 47836.27 34003.05 4222.59 28 Norway 74646.52 83912.19 55247.33 9187.91 28 Sweden 37169.60 45843.60 28067.45 5766.21 28
Table 4-3. Immigration (as a share of country’s labour force) descriptive statistics for each country
Table 4-4. Emigration (as a share of country’s labour force) descriptive statistics for each country
All variables were observed to be nonstationary using unit root test, therefore they are used in their first differences. Additionally, real GDP per capita is logged in order to reduce the influence of outliers and because this allows percentage interpretations of the regression output.
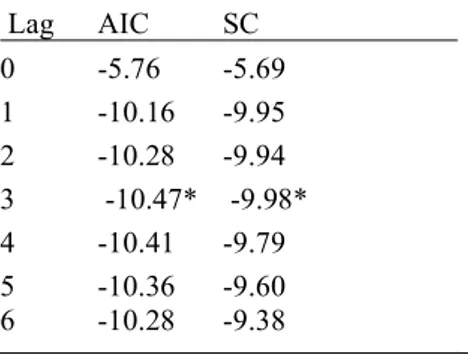
Fixed-effects model is used over random-effects model due to its ability to account for both time-invariant country specific effects and time-varying country-invariant effects. It is very likely that there are certain factors affecting specific country’s real GDP per capita. Additionally, recent examples of dot-com bubble and financial crisis in 2008 affect all countries in given years. Fixed effect model controls for these specific factors. Furthermore, here it is reasonable to expect country effects to be correlated with the regressors, which makes random effects model inconsistent. However, when period fixed effects are incorporated, both models possess a very high R-squared. Regressing the dependant variable on constant only and applying period fixed effects, we conclude that 91% (Baltic) and 71% (Nordic) of variation in the dependent variable is explained by
Mean Max Min. Std. Dev. Obs. Estonia 0.007 0.025 5.15E-05 0.007 18 Latvia 0.005 0.012 0.001 0.003 27 Lithuania 0.006 0.016 0.0008 0.005 28 Denmark 0.019 0.026 0.014 0.003 28 Norway 0.018 0.026 0.011 0.005 27 Sweden 0.016 0.031 0.008 0.006 28
Mean Max Min. Std. Dev. Obs. Estonia 0.0083 0.019 0.002 0.004 24 Latvia 0.020 0.047 0.005 0.009 27 Lithuania 0.021 0.055 0.010 0.010 28 Denmark 0.014 0.018 0.011 0.001 28 Norway 0.009 0.012 0.004 0.001 27 Sweden 0.0082 0.010 0.005 0.001 28
18
period fixed effects (regression outputs are available in Appendix A, tables 0-3 and 0-4). In order to find the true relation between economic growth and migration, we omit the period fixed effects.
5 Results
Dependent variable gdp is regressed on the variables of interest, immigr and emigr. Additionally, every model includes nat_pop_growth and edu, to account for natural population growth and human capital. Only one definition of physical capital is used per model (either capital or inves). Finally, one of the control variables are added per model (either govexp or savings). Cross-section fixed effects regression outputs for Baltics and Nordics are shown in Table 5-1 and 5-2, respectively.
For Baltics, model 5 is preferred due to it explaining 53 percent of the variation in the economic growth. Additionally, investment is found to move too similarly to the independent variable, which made R-squared inflate (see Appendix A, graphs 1 and 2). Immigration, natural population growth and education are not significant throughout the models. Emigration, on the other hand, was consistently negatively related to economic growth. If the emigrant share of labour force increases by 1%, the economic growth decreases by 1.46%. Physical capital and government expenditure are as expected respectively positively and negatively related to economic growth.
19
Table 5-1. Cross-section fixed effects regression outputs for Baltics. Dependent variable: gdp (real GDP per capita growth).
In the case for Nordic countries, a dummy crisis is included to deal with autocorrelation. It has a value of 1 in the year 2009, due to economic growth having the biggest drop that year, and value of 0 all other years. Model 6 is preferred, due to it explaining 59% of the variation in the dependent variable. Additionally, it has the highest DW statistic, which ensures that residuals are not correlated. Similar to the Baltic countries, immigration and natural population growth are not significant for the economic growth of the Nordic countries. Unexpectedly, emigration has a very strong positive relation to real GDP per capita growth. That may be due to emigration reducing unemployment or increasing wage levels in the sending country. Gross domestic savings are positively related to economic growth, which is consistent with the existing literature. The dummy variable for crisis is negatively related to GDP growth, which makes economic sense.
Baltic (1) (2) (3) (4) (5) (6) immigr 0.996 (1.313) 1.039 (1.328) 0.957 (1.357) 2.941 (2.395) 2.494 (2.039) 1.039 (1.966) emigr -0.927* (0.530) -0.874* (0.534) -0.913 (0.549) -1.471 (0.963) -1.465* (0.818) -1.715** (0.777) nat_pop_ growth 7.847** (3.748) 7.251* (3.768) 7.348* (3.811) -9.508 (6.941) -5.893 (5.959) -2.664 (5.752) edu -0.002 (0.001) -0.001 (0.001) -0.001 (0.001) -0.002 (0.003) -0.003 (0.002) -0.002 (0.002) capital 1.39E-05***
(3.24E-06) 1.51E-05*** (2.77E-06) 1.07E-05*** (2.69E-06) inves 1.153*** (0.098) 1.203*** (0.093) 1.170*** (0.128) govexp -0.372 (0.258) -1.652*** (0.378) savings 0.001 (0.002) 0.015*** (0.003) c 0.039*** (0.004) 0.042*** (0.004) 0.041*** (0.004) -0.009 (0.014) -0.023* (0.012) -0.001 (0.011) Obs. 55 55 55 55 55 55 R2 0.809 0.801 0.801 0.349 0.539 0.586 Adj. R2 0.776 0.771 0.767 0.252 0.459 0.514 DW statistic 1.679 1.734 1.671 1.323 1.631 1.326
Notes: 1) Standard errors are shown in parenthesis.
20
Table 5-2. Cross-section fixed effects regression outputs for Nordic countries. Dependent variable: gdp (real GDP per capita growth)
Nordic (1) (2) 3 (4) (5) (6) immigr 0.341 (0.793) 0.490 (0.834) 0.410 (0.828) 0.731 (0.820) 0.707 (0.812) 0.753 (0.796) emigr 2.821* (1.596) 2.873* (1.683) 2.333 (1.707) 3.390** (1.676) 3.074* (1.675) 3.633** (1.632) nat_pop_ growth 2.364 (2.624) 4.053 (2.690) 2.874 (2.784) 4.292 (2.718) 2.977 (2.845) 3.152 (2.693) edu 0.0003 (0.001) 0.0004 (0.001) 3.9E-06 (0.001) 0.0002 (0.001) -0.0002 (0.001) 0.0001 (0.001) capital 7.95E-08
(3.11E-0.7) 2.83E-07 (3.40E-07) 1.13E-07 3.03E-07 inves 0.242** (0.115) 0.138 (0.115) 0.170 (0.116) govexp -0.317 (0.010) -0.341 (0.238) savings 0.002*** (0.001) 0.002** (0.001) crisis -0.042*** (0.010) -0.061*** (0.009) -0.052*** (0.010) -0.064*** (0.008) -0.056*** (0.010) -0.052*** (0.010) c 0.014*** (0.001) 0.015*** (0.002) 0.015*** (0.002) 0.013*** (0.006) 0.010 (0.006) 0.012** (0.006) Obs. 67 67 67 67 67 67 R2 0.622 0.572 0.588 0.562 0.578 0.594 Adj. R2 0.563 0.514 0.523 0.502 0.511 0.530 DW statistic 1.464 1.529 1.543 1.676 1.631 1.730
Notes: 1) Standard errors are shown in parenthesis.
2) *, **, *** denote significance at 10%, 5% and 1% levels, respectively.
Regression results do not show which variable is the cause and which is the effect, it simply shows if the variables are correlated, the strength and direction that relationship. Therefore, Granger causality test is employed to examine the causal relationships specifically between our variables of interest (emigration and immigration) and economic growth. Detailed steps of the test are explained in Appendix B.
Granger causality test following Toda-Yamamoto (1995) procedure shows that real GDP per capita Granger causes emigration in the Baltic countries and not vice versa. Additionally, immigration and real GDP per capita has no causal relationship in our sample. The test concludes the same results for Nordic countries (Table 5-3).
Table 5-3. Granger Causality Test
Null hypothesis Prob Result
Baltic
Immigration does not Granger cause GDP 0.58 No Granger Causality GDP does not Granger cause Immigration 0.17
Emigration does not Granger cause GDP 0.61 GDP Granger causes Emigration
GDP does not Granger cause Emigration 0.00 Nordic
Immigration does not Granger cause GDP 0.23 No Granger Causality GDP does not Granger cause Immigration 0.51
Emigration does not Granger cause GDP 0.26 GDP Granger causes Emigration
21
6 Discussion
This paper examines the effects of international migration on the economic growth of the Nordic and the Baltic countries. As it is earlier seen from the literature review, researches carried out on this topic have resulted in both positive and negative effects of international migration on economic growth. Analysis of this paper concludes similar findings. The linear regression used in this paper infers that emigration has ambiguous results on economic growth of the chosen countries. Baltic states experience a negative impact of emigration, while the opposite is true for the Nordic countries.
Emigration negatively affects economic growth mainly through decreasing labour force and lost human capital (“brain drain”). Due to decreasing fertility rates and the majority of emigrants being of working age, the old dependency ratios in the Baltic states have been increasing on average 0.5 percent per year in the period 1990-2017 (World Bank Indicators). This in turn increases pressure on social protection systems (healthcare, pensions, etc.). In order to decrease or completely eliminate mentioned negative effects of emigration specific measures and policies must be implemented.
First and foremost, it is important to create more attractive social and economic environment to avoid excessively high emigrant flows. As Engbersen and Jansen (2013) indicate, people are more likely to leave the country in the presence of unemployment and cutbacks on social welfare. Additionally, our Granger causality test results from the previous section display that emigration in fact is Granger caused by real GDP per capita in the Baltic countries. This and the data on emigration flows gives us basis to believe that people tend to leave Baltic states during and after the times of economic distress and downfall. The factor that impacted the highest outflow of people, especially ones of working age, was the economic crisis of 2008. This in turn has resulted in considerable shortages on the labour market. Responding to the trend of decreasing populations and therefore the negative impact on economic growth, the Baltic countries have attempted to follow neo-liberal path with harsh austerity measures. On the one hand the economy had recovered in a significant level, but the drawback of these measures in this case was increased inequalities and exclusion, social pessimism and unexpectedly a further emigration. Therefore, providing policies that maintain economic stability without cutbacks on social welfare, would aid in making potential emigrants to stay.
22
Furthermore, stable economy and job opportunities are important pull factors for potential immigrants, and specifically return migrants to the Baltic countries. This might indicate additional positive effect for real GDP per capita growth. Apart from increasing labour force, return migrants are observed to bring higher levels of human capital, and affect economic growth by partaking in higher paid jobs, transferring foreign knowledge and skills. Therefore, Baltic states could learn from Ireland’s example to encourage their own nationals to come back. According to OECD (2015) report, Ireland’s government encouraged their own nationals to come back by informing the diaspora of job opportunities in Ireland and reinforcing focus on return migration in employment and training agencies. Thus, since booming Baltic economies are already attracting immigrants, taking one step further by targeting diaspora would be expected to be a positive step, based on Ireland’s example.
In the case for Nordic countries, regression results suggest that emigration is positively related to economic growth. Previous literature has shown that diaspora can potentially and actively contribute to the development of their country of origin through remittances, foreign direct investment, trade across countries, enhancing the image of their home country, transferring new skills and knowledge (Birka & Klavinš, 2019). However, according to recent data (from 2008), the majority of emigrants in the Nordic countries are foreign-born people (Eurostat). Which in this case suggests that such emigration may relieve unemployment, reduce tension in the labour market rather than contribute through remittances. Additionally, Granger causality test concludes that in the Nordic countries GDP Granger causes emigration and not vice versa. This, and the fact that most of the emigrants are foreigners, allow us to propose the idea that many people leave the Nordics for their home countries after earning enough money.
Our regression results, which comply with other researches, show that relationship between immigration and economic growth is insignificant. However, to utilize notable immigrant flows better, countries should impose proper immigration integration policies. It must be ensured that immigrant integration in the country is successfully carried out in order to avoid detrimental effects on the society. As reported by Pelling (2012), ‘’labour migration implies short-term labour market access, but this does not mean that labour migration favours integration in society’’. Therefore, socioeconomic integration of labour is essential for labour market prosperity, in order to avoid discriminating behaviour
23
towards foreign workers. The lack of immigration policies prevents the utilization of potential benefits from the increased skilled labour force. In this case, government plays a vital role when designing immigration policies that can boost the integration of immigrants.
According to the Migrant Integration Policy Index (Huddleston, 2015), a tool which is designed to measure integration policies in 38 migration-receiving countries, the Nordic countries are considered to have higher than average, well-designed policies to promote successful integration. In 2014 Sweden had the highest score of 80 (with 100 being the highest), Norway had a score of 71 and Denmark with a score of 59. However, Lisa Pelling (2012) argues that while Sweden appears to be liberal in the context of labour immigration policy, it has failed to diminish the differences between natives and foreigners in a substantial level and only a limited amount of immigrants have gained their permanent residence permits. She continues and points out that reasons for this is that in the majority immigrants’ labour is based on seasonal terms and that employment terms offered to immigrants often do not meet the requirements for work permits renewal. Therefore, such lack of substantial immigrant integration complies with and explains our regression results.
In addition to integrating immigrant flows, it is important to acknowledge the specifics of those flows, in particular the human capital that migrants bring along. It is reasonable to assume that skilled immigrants contribute more to the economic growth than unskilled ones. Therefore, adopting policies that target more highly educated immigrants could help the Nordics exploit immigrants’ potential better. Anglo-Saxon countries have increased the educational levels of their immigration flows by implementing skill-based immigration policies. Advantages of higher educated immigrant flows include distributing more knowledge and new skills, paying more taxes and consuming more. Nana, Goodchild and Sanderson (2003) showed how the government expenditure on supporting skilled immigrants is lower than the one for unskilled. Therefore, reducing barriers to entry in the country and afterwards in employment for skilled immigrants is a policy that could contribute to enhancing the positive externalities from skilled immigration.
24
Having said that, limitations of this model must be discussed. As explained previously, international migration affects the economy in many ways, which are often not well documented statistically. The lack of data for detailed migration flows, where migrants’ skills, education, knowledge, age, etc., are reflected, is the main limitation of this study. Availability to such data would grant a better and more precise estimate for the relationship between migration and economic growth. Additionally, it would aid in analysing the channels through which migration affects the economy, and in turn would make decision making regarding policies, an easier process.
7 Conclusion
The purpose of this study is to analyse the effects of international migration on economic growth in the Baltic and Nordic countries. Over the years international migration has been a highly discussed economic topic. In the recent years migration flows have increased significantly making it a concern for both sending and receiving countries.
Related literature on the topic focuses on the impact of immigration on the host countries’ economic growth, and usually overlooks the impact emigration has on the source country’s economy. Therefore, while this paper contributes into providing additional evidence on the subject of immigration, it is also an important extension of what is observably neglected by the literature.
Thus, based on the results, with the appropriate policy making these two set of countries could benefit from international migration to a higher extent. Baltic countries can alter the demographic issues they are facing by making their countries more socio-economically attractive for people living in the country, return migrants and potential immigrants. On the other hand, Nordics that have already been experiencing significant migration inflows can impose policies for better exploitation of the human capital these migrants bring along with them. This in turn, could potentially result in significant positive outcomes in economic growth, as it is proven from past literature review. One could argue that the model presented cannot fully demonstrate the effects of international migration on economic growth. For instance, as stated in the literature review, migration could potentially alter the age structure of receiving countries and therefore, prevent the negative effects of an ageing population, given the fact that working
25
age population shows the highest rates of migration. In addition, an important factor that could change the results, if taken into consideration, is the human capital migrants bring along with them. In the case of sending countries it would most probably show a decreased labour productivity due to the outflow of human capital, it could however, result in human capital accumulation in the receiving country and that in turn in higher labour productivity. That said, further research on these factors and their effect on economic growth is essential in order to attain a more in-depth insight on the impact of migration.
The lack of detailed migration flow data (migrants’ education levels, age, etc.) for the countries of interest is a major limitation of this study. Without availability to such quality data, more precise and specific effects of migration cannot be studied. Improvements in the data available would aid in the empirical analysis of Nordic and Baltic countries by including different channels through which migration is believed to affect economic growth.
8 References
Acemoglu, D., & Restrepo, P. (2017). Secular Stagnation? The Effect of Aging on Economic Growth in the Age of Automation. American Economic Review 107(5), 174-79.
Ahmed, S. A., & Walmsley, T. L. (2009). Gains from the Liberalization of Temporary Migration: The Case of India. South Asia Economic Journal 10(1), 61–80.
Aiginger, K., & Falk, M. (2005). Explaining Differences in Economic Growth among OECD Countries. Empirica 32, 19-43.
Alesina, A., Harnoss, J., & Rapoport, H. (2013). Birthplace Diversity and Economic Prosperity. Working Paper 18699. National Bureau of Economic Research.
Autor, D. H., Katz, L. F., & Kearney, M. S. (2008). Trends in US wage inequality: Revising the revisionists. Review of Economics and Statistics, 90(2), 300-323.
Baas, T., Brucker, H., & Hauptmann, A. (2010). Labor Mobility in the Enlarged EU: Who Wins, Who Loses? in M. Kahanec and K.F. Zimmermann (eds.), EU Labor Markets After Post-Enlargement Migration. doi:10.1007/978-3-642-02242-5_2
Barro, R., & Sala-i-Martin, X. (1992). Regional growth and migration: A Japan-United States comparison. Journal of Journal of the International and Japanese Economies, 6, 312–346.
Bellini, E., Ottaviano, G. I., Pinelli, D., & Prarolo, G. (2013). Cultural Diversity and Economic Performance: Evidence from European Regions. Geography, Institutions and Regional Economic Performance.
Benhabib, J. (1996). On the political economy of immigration. European economic review, 40(9), 1-737. Bergovic, N., & Ciftcioglu, S. (2010). Are domestic savings and economic growth correlated? Evidence
from a sample of Central and East European countries. Problems and Perspectives in Management, Volume 8, Issue 3, 30-35.
Birka, I., & Klavinš, D. (2019). Diaspora diplomacy: Nordic and Baltic perspective, Diaspora Studies. doi:10.1080/09739572.2019.1693861
Bloom, D. E., Canning, D., & Fink, G. (2008). Urbanization and the wealth of nations. Science 319, 772– 775.
Bloom, D. E., Canning, D., & Fink, G. (2010). Implications of population ageing for eco-nomic growth. Oxford Review of Economic Policy, 26, 583-612.
26
Borjas, G. (1995). The economic benefits from immigration. Journal of Economic Perspectives, 9(2), 3– 22.
Borjas, G. J. (2003). The Labor Demand Curve is Downward Sloping. Reexamining the Impact of Immigration on the Labor Market. Quarterly Journal of Economics, 118, 1335-74.
Borjas, G. J. (2009). The Analytics of the Wage Effect of Immigration. NBER Working Papers 14796. Boubtane, E., Coulibaly, D., & Rault, C. (2013). Immigration, Growth, and Unemployment: Panel VAR
Evidence from OECD Countries. Review of Labour Economics and Industrial Relations, 27, 399-420.
Boubtane, E., Dumont, J. C., & Rault, C. (2016). Immigration and economic growth in the OECD countries 1986–2006. Oxford Economic Papers-New Series 68, no. 2, 340– 360.
Boubtane, E., Dumont, J.-C., & Rault, C. (2013). Immigration and Economic Growth in the OECD Countries 1986-2013. Documents de Travail du Centre d'Economie de la Sorbonne.
Boulhol, H., de Serres, A., & Molnar, M. (2008). The Contribution of Economic Geography to GDP Per Capita. OECD Economics Department working Papers No. 602.
Bove, V., & Elia, L. (2017). Migration, Diversity, and Economic Growth. World Development 89:227– 239.
Bretschger, L. (2001). Labor supply, Migration, and Long-term development. Open economies review, 12, 5-27.
Brinkerhoff, J. M. (2012). Creating an Enabling Environment for Diasporas’ Participation in Homeland Development. International Migration 50 (1), 75–95.
Bulwaka, M. (2009). Diaspora Diplomacy: A Case Study of Uganda. MA diss. University of Malta. Cantore, N., & Massimiliano, C. (2015). The Impact of Temporary Migration on Source Countries.
International Migration Review 49(3), 697-726.
Card, D. (2001). Immigrant inflows, native outflows, and the local labor market impacts of higher immigration. Journal of Labor Economics, 19(1), 22-64.
Clemens, M. A. (2011). Economics and Emigration: Trillion-Dollar Bills on the Sidewalk? Journal of Economic Perspectives, 83-106.
Coleman, D. A. (2002). Replacement migration, or why everyone is going to have to live in Korea: a fable for our times from the United Nations. Philosophical Transactions of the Royal Society B, 357, 583-98.
De Santis, G. (2011). Can immigration solve the aging problem in Italy? Not really. Genus, Vol. 67, No. 3, 37–64.
Diebolt, C., & Hippe, R. (2019). The Long-Run Impact of Human Capital on Innovation and Economic Development in the Reginons of Europe. Applied Economics, 51:5, 542-563. doi:10.1080/00036846.2018.1495820
Dolado, J., Goria, A., & Ichino, A. (1994). Immigration, Human Capital and Growth in the Host Country: Evidence from Pooled Country Data,. Journal of Population Economics, 7, 193-215.
Drinkwater, S., Levine, P., Lotti, E., & Pearlman, J. (2002). The economic impact of migration: a survey. Discussion Papers in Economics, Unis (University of Surrey), diciembre, 52.
Engbersen, G., & Jansen, J. (2013). Emigration from the Baltic States: Economic impact and policy implications. OECD Publishing.
Espenshade, T. J. (2001). Replacement migration-from the perspective of equilibrium stationary populations. Population and Environment, 22, 383-00.
EU. (2005). Policy Plan on Legal Migration. COM (2005) 669 final. Brussels.
Felbermayr, G., Hiller, S., & Sala, D. (2010). Does Immigration Boost Per Capita Income? Economics Letters, 107, 177-79.
Feld, S. (2000). Active population growth and immigration hypotheses in Western Europe. European Journal of Population, 16, 3-0.
Freeman, R. B. (2006). Is a great labour shortage coming? Replacement demand in the global economy. NBER Working Paper No. 12541.
Freyer, J. (2007). Demographics and Productivity. Review of Economics and Statistics 89 (1), 100–109. Friedberg, R., & Hunt, J. (1995). The impact of immigrants on host country wages, employment and
growth. Journal of Economic Perspectives, 9(2), 23–44.
Gesano, G., & Strozza, S. (2011). Foreign migrations and population aging in Italy. Genus 57(3), 83-104. Grossman, G. M., & Helpman, E. (1991). Innovation and Growth in the Global Economy. MIT Press,
Cambridge, MA.
Grossman, G. M., & Rossi-Hansberg, E. (2008). Trading tasks: A simple theory of offshoring. American Economic Review, 98(5), 1978-1997.
27
Hatton, T., & Tani, M. (2005). Immigration and inter‐regional mobility in the UK, 1982–2000. Economic Journal, 115(507), F342-F358.
Hazans, M. (2016). Migration Experience of the Baltic Countries in the Context of Economic Crisis. Labor Migration, EU Enlargement, and the Great Recession, 297-344. doi:10.1007/978-3-662-45320-9_13
Huber, P., & Tondl, G. (2012). Migration and regional convergence in the European Union. Empirica 39, no. 4, 439–460.
Huddleston, T. (2015). Migrant Integration Policy Index 2015: MIPEX 2015. CIDOB.
IMF. (2016). Emigration and its Economic Impact on Eastern Europe. IMF Staff Discussion Note. Retrieved from https://www.imf.org/external/pubs/ft/sdn/2016/sdn1607.pdf
Jones, C. I. (2002). Sources of US economic growth in a world of ideas. American Economic Review, 92(1), 220-239.
Karlsdóttir, A., Norlén, G., Rispling, L., & Randall, L. (2018). State of the Nordic Region 2018. Immigration and Integration Edition. Nordic Council of Ministers. Retrieved from http://dx.doi.org/10.6027/ANP2018-742
Lee, S. H., Mason, A., & Park, D. (2011). Why does population aging matter so much for Asia? Population aging, economic security and economic growth in Asia. Eria Discussion Paper Series, eria-dp-2011-04.
Lesthaeghe, R. (2000). Europe’s demographic issues: fertility, household formation and replacement migration, paper for the expert group meeting on policy responses to population ageing and population decline. United Nations, United Nations Population Division, New York.
Lindh, T., & Malmberg, B. (1999). Age Structure Effects and Growth in the OECD, 1950–1990. Journal of Population Economics 12 (3), 431–49.
Lisenkova, K., Merette, M., & Wright, R. (2012). Population ageing and the labour market: modelling size and age-specific effects. Economic Modelling, 35, 981-989.
Lucas, R. (1998). On the mechanics of economic development. Journal of Monetary Economics, 22, 3-42. Lucas, R. (1998). On the mechanics of economic development. Journal of Monetary Economics, 22, 3-42. Lundborg, P., & Segerstrom, P. (2000). International Migration and Growth in Developed Countries: A
theoretical analysis. Economica, 67, 579-604.
Lundborg, P., & Segerstrom, P. (2002). The growth and welfare effects of international mass migration. Journal of International Economics, 56, 177-204.
Maestas, N., Mullen, K., & Powell, D. (2016). The Effect of Population Aging on Economic Growth, the Labor Force and Productivity. IDEAS Working Paper Series from RePEc.
Mankiw, G., Romer, D., & Weil, D. (1992). A Contribution to the Empirics of Economic Growth,. Quarterly Journal of Economics, 107, 407-437.
Moretti, E. (2004a). Workers' education, spillovers, and productivity: evidence from plant-level production functions. American Economic Review, 94(3), 656-690.
Moretti, E. (2004b). Human capital externalities in cities. Handbook of regional and urban economics, 4, 2243-2291.
Morley, B. (2006). Causality between economic growth and immigration: An ARDL bounds testing approach. Economics Letters, 90, 72-6.
Mundell, R. A. (1957). International Trade and Factor Mobility. The American Economic Review 47(3), 321-335.
Nagarajan, N. R., Teixeira, A. A., & Silva, S. T. (2016). The impact of an ageing population on economic growth: an exploratory review of the main mechanisms. Análise Social, 4-35.
Nana, G., Sanderson, K., & Goodchild, M. (2003). The fiscal impacts of migrants to New Zealand 2003. Wellington: Business and Economic Research Ltd, Report to the New Zealand Immigration Service.
Nannestad, P. (2007). Immigration and welfare states: A survey of 15 years of research. European Journal of Political Economy, 23 (2), 512-532.
Narcizo, A. (2010). The impact of population ageing on international capital flows. mpra Paper, 26457. Newland, K. (2010). Voice After Exit: Diaspora Advocacy. Washington, DC: Migration Policy Institute. Newland, K., & Plaza, S. (2013). What We Know About Diasporas and Economic Development.
Washington, DC: Migration Policy Institute.
Noja, G. G., Cristea, S. M., Yüksel, A., Pânzaru, C., & Dracea, R. M. (2018). Migrants’ Role in Enhancing the Economic Development of Host Countries: Empirical Evidence from Europe. Sustainability 2018 10, 894.
28
OECD. (2008). Tertiary Education for the Knowledge Society: Volume 1 and Volume 2, OECD Reviews of Tertiary Education. Paris: OECD Publishing. Retrieved from https://doi.org/10.1787/9789264046535-en
OECD. (2012). International Migration Outlook 2012. OECD Publishing.
OECD. (2013). Coping with Emigration in Baltic and East European Countries. OECD Publishing. Retrieved from http://dx.doi.org/10.1787/9789264204928-en
OECD. (2015). Migration in Ireland: Challenges, Opportunities, and Policies. Paris: OECD Economic Surveys: Ireland.
Ortega, F., & Peri, G. (2009). The causes and Effects of International Migration: evidence from OECD countries 1980-2005. NBER Working Papers 14833.
Ortega, F., & Peri, G. (2014). Migration, Trade and Income. Journal of International Economics, 92, 231-51.
Paterno, A. (2011). Is immigration the solution to population aging? Genus, 67(3), 65-82.
Pelling, L. (2012). Ny väg in: Forskningsstudie om migrationskanaler. Stockholm: Global Utmaning. Peri, G. (2016). Immigrants, productivity, and labor markets. Journal of Economic Perspectives, 30(4), 3–
30.
Persson, J. (2004). The Population Age Distribution, Human Capital, and Economic Growth: The US states 1930-2000. FIEF Working Paper No. 156.
Pettersen, S. V., & Østby, L. (2013). Skandinavisk komparativ statistikk om integrering. Innvandrere i Norge, Sverige og Danmark. Samfunnsspeilet 5/2013.
Prettner, K. (2012). Population aging and endogenous economic growth. Journal of Population Economics, 26, 811-834.
Razin, A., & Sadka, E. (1999). Migration and Pension with International Capital Mobility. Journal of Public Economics, 74(1), 141-150.
Razin, A., & Sadka, E. (2000). Unskilled Migration: A Burden or a Boon for the Welfare State? Scandinavian Journal of Economics, 102(3), 463-479.
Reichlin, P., & Rustichini, A. (1998). Diverging patterns with endogenous labor migration. Journal of Economic Dynamics and Control, 22(5), 703-728.
Rivera-Batiz, L. A., & Romer, P. M. (1991). Economic integration and endogenous growth. Quarterly Journal of Economics, 106(2), 531-555.
Robertson, P. E. (2002). Demographic shocks and human capital accumulation in the Uzawa-Lucas model. Economics Letters , Elsevier, 74(2), 151–156.
Romer, P. M. (1990). Endogenous technological change. Journal of Political Economy, 98(5-2): S71-S102. Sparber, C. (2010). Racial Diversity and Macroeconomic Productivity across US States and Cities.
Regional Studies, 44 (1).
Toda, H. Y., & Yamamoto. (1995). Statistical inference in Vector Autoregressions with possibly integrated processes. Journal of Econometrics, 66, 225-250.
UN. (2000). Replacement Migration: Is it a Solution to Declining and Aging Populations? New York: UN Population Division.
UN. (2019). Internation Migrant Stock 2019. United Nations, Department of Economic and Social Affairs, Population Division. Retrieved from www.unmigration.org
Walder, A. B., & Döring, T. (2012). The effect of population ageing on private consumption – a simulation for Austria based on household data up to 2050. Eurasian Economic Review, 2, 63-80.
Walz, U. (1995). Growth (Rate) Effects of Migration. Zeitschrift f¨ur Wirtschafts- und Sozialwissenschaften, 115, 199-221.
29
Appendix A.
Table 0-1. Independent variable correlation for the Baltic countries
BALTIC IMMIGR EMIGR NAT_POP_GROWTH EDU CAPITAL INVES GOVEXP SAVINGS
IMMIG 1 EMIGR -0.075 1 NAT_POP_GROWTH 0.027 -0.118 1 EDU -0.068 -0.001 0.351 1 CAPITAL -0.002 -0.128 0.221 0.088 1 INVES 0.099 -0.137 -0.160 -0.066 0.335 1 GOVEXP -0.021 -0.026 0.175 0.010 0.138 -0.358 1 SAVINGS 0.156 0.040 -0.177 -0.047 0.143 0.677 -0.302 1 Table 0-2. Independent variable correlation for the Nordic countries
NORDIC IMMIGR EMIGR NAT_POP_GROWTH EDU CAPITAL INVES GOVEXP SAVING CRISIS
IMIGR 1 EMIGR -0.018 1 NAT_POP_GROWTH 0.021 0.123 1 EDU -0.005 0.119 -0.115 1 CAPITAL -0.005 -0.141 0.000 -0.034 1 INVES 0.255 0.191 0.096 -0.080 0.288 1 GOVEXP -0.079 -0.188 -0.201 -0.187 0.202 -0.090 1 SAVINGS 0.067 -0.039 0.127 0.023 0.006 -0.027 -0.719 1 CRISIS -0.129 0.025 0.051 -0.000 -0.093 -0.367 0.473 -0.551 1
Table 0-3. Regression output of real GDP per capita regressed on a constant and period fixed effects for Baltic countries
Dependent Variable: GDP Period fixed effects
Variable Coefficient (Std. Error) c 0.02*** (0.003) R-squared 0.91 Adj. R-squared 0.87 DW stat 1.41 F-statistic 21.65 Prob(F-statistic) 0.00 Obs 81
Notes: 1) Standard error is shown in parenthesis.
30
Table 0-4. Regression output of real GDP per capita regressed on a constant and period fixed effects for Nordic countries
Dependent Variable: GDP Period fixed effects
Variable Coefficient (Std. Error) c 0.01*** (0.001) R-squared 0.71 Adj. R-squared 0.58 DW stat 1.18 F-statistic 5.25 Prob(F-statistic) 0.00 Obs 81
Notes: 1) Standard error is shown in parenthesis.
2) *** denotes significance at 1% level
Graph 1. Changes of total investment share of GDP