Annual report of the Swedish Environmental Objectives Council:
- ‒
.
Although far-reaching action has been taken, in many
respects there has been little appreciable improvement in the state of the environment in the last
ten years. This may be because of the slow rate at which ecosystems change: nature has simply not
had time to respond to the easing of pressures on it.
This is the first report of the Environmental Objectives Council on progress towards Sweden’s 15
environmental objectives, and the fourth publication in the de Facto series. It provides an overall
picture of the environmental situation in Sweden and of the prospects of achieving the objectives.
de Facto
– are we on track?
1
2
3
6
8
10
12
14
16
18
20
22
24
26
28
30
32
34
36
37
38
39
40
Contents
Preface
Glossary
The environmental objectives – are we on track?
Reduced climate impact
Clean air
Natural acidification only
A non-toxic environment
A protective ozone layer
A safe radiation environment
Zero eutrophication
Flourishing lakes and streams
Good-quality groundwater
A balanced marine environment, flourishing coastal areas and archipelagos
Thriving wetlands
Sustainable forests
A varied agricultural landscape
A magnificent mountain landscape
A good built environment
The natural environment
Land use planning and wise management of land, water and buildings
The cultural environment
Human health
Data sources for figures and tables
A p r o g r e s s r e p o r t f r o m t h e S w e d i s h E n v i r o n m e n ta l O b j e c t i v e s C o u n c i l
ISBN
91-620-1226-6
ISSN
0282-7298
objectives
I. the natural environment Swedish Environmental Protection Agency I I. land use planning and wise
management of land,water and buildings
National Board of Housing, Building and Planning
I I I. the cultural environment National Heritage Board
IV. human health
National Board of Health and Welfare 1. reduced climate impact
Swedish Environmental Protection Agency 2. clean air
Swedish Environmental Protection Agency 3. natural acidification only
Swedish Environmental Protection Agency 4. a non-toxic environment
National Chemicals Inspectorate 5. a protective ozone layer
Swedish Environmental Protection Agency 6. a safe radiation environment
Swedish Radiation Protection Authority
7. zero eutrophication
Swedish Environmental Protection Agency 8. flourishing lakes and streams
Swedish Environmental Protection Agency 9. good-quality groundwater
Geological Survey of Sweden
Broader issues related to the objectives
10. a balanced marine enviroment, flourishing coastal areas and archipelagos
Swedish Environmental Protection Agency 11. thriving wetlands
Swedish Environmental Protection Agency 12. sustainable forests
National Board of Forestry 13. a varied agricultural
landscape
Swedish Board of Agriculture 14. a magnificent mountain
landscape
Swedish Environmental Protection Agency 15. a good built environment
National Board of Housing, Building and Planning
address for orders:
Swedish Environmental Protection Agency, Customer Services, SE-106 48 Stockholm, Sweden
telephone:
+46 8 698 1200 fax: +46 8 698 1515 e-mail: kundtjanst@naturvardsverket.se
internet:
www.naturvardsverket.se isbn: 91-620-1226-6 issn: 0282-7298 © Swedish Environmental Protection Agency
editor:
Eva Ahnland, Environmental Protection Agency’s Secretariat for the Environmental Objectives Council
translator:
Martin Naylor design: AB Typoform/Marie Peterson
printed by:
Elanders Tryckeri AB, Falköping, June 2002 number of copies: 2000
This report is also available in Swedish, isbn: 91-620-1225-8. It is printed on environment-friendly paper.
No clear-cut trend
Yes
Favourable
Unfavourable
Very difficult
within time-frame
Possibly, but further
action required
2. Clean air
9. Good-quality groundwater
8. Flourishing lakes and streams
11. Thriving wetlands
10. A balanced marine environment,
flourishing coastal areas and archipelagos
7. Zero eutrophication
3. Natural acidification only
12. Sustainable forests
13. A varied agricultural landscape
14. A magnificent mountain landscape
15. A good built environment
4. A non-toxic environment
6. A safe radiation environment
5. A protective ozone layer
1. Reduced climate impact
E N V I R O N M E N T A L Q U A L I T Y O B J E C T I V E C U R R E N T T R E N D W I L L G O A L S B E A C H I E V E D ? Interim targets? Change in pressures 1997–2001 Change in state 1992–2001 Response
0–5 years
6–30 years
> 30 years
C U R R E N T T R E N D T I M E S C A L E O F R E C O V E R Y W I L L G O A L S B E A C H I E V E D ? T I M E S C A L E O F R E C O V E R Y Environmental quality objective?Environmental quality objectives
This report is published by the Swedish Environmental Objectives Council through the Swedish
Environmental Protection Agency. Draft texts and data for the report have been supplied by the
following agencies with responsibility for the environmental quality objectives or for broader issues
related to them:
The 15 environmental objectives – are we on track?
Progress towards the objectivesThe diagram to the left gives an overall assessment of progress towards the envir-onmental quality objectives, covering the natural environment, cultural heritage, human health and natural resources.
Changes in pressures on the environ-ment are assessed with regard to how emis-sions, land use, pressures on cultural heri-tage etc. have developed over the last five years. Trends in the state of the environ-ment are evaluated over a ten-year period. The neutral face symbol, meaning ‘no clear-cut trend’, is also used when a favour-able trend (e.g. falling levels of PCBs and DDT in the sea) is judged to be offset by an unfavourable one (e.g. rising levels of certain toxic brominated pollutants). A smiley face under ‘change in pressures’ means that pressures on the environment have been significantly reduced and that things are moving in the right direction. The feasibility of achieving the interim targets defined by Parliament (around 70 in all) is assessed overall for each environmen-tal quality objective. Thus, in some cases a neutral face means that one target is consid-ered easy to meet, while another is judged to be more difficult to attain. An appraisal is also given of the prospects of achieving the environmental quality objectives themselves in the time-frame set by Parliament.
Finally, the diagram shows how long it will take for the environment to recover once all the necessary measures have been implemented. We refer to this as the environment’s response to the action taken. Two hour-glasses, for instance, means that recovery is expected to be largely com-plete within a period of 6–30 years.
Preface
In April 1999 the Swedish Parliament adopted environmental quality objectives relating to fifteen areas, describing what quality and state of the environment and natural and cultural resources of Sweden are ecologically sustainable in the long term. To guide efforts to achieve these objectives, in spring 2001 the Government proposed interim targets for each of them, indicating the direction and timescale of the action to be taken. The targets were set out in the bill Swedish Environmental Objectives – Interim Targets and Action Strategies (2000/01:130), which was approved by Parliament in November 2001. Further interim targets in support of the objectives were contained in the Chemicals Bill (2000/01:65, passed in June 2001) and the Climate Bill (2001/02:55, approved in March 2002). The Indoor Environment Bill (2001/02:128), put before Parliament in March and due to be passed in June 2002, also proposes interim targets.
In line with the Environmental Objectives Bill, the Government has set up an Environmental Objectives Council to monitor and report on overall progress towards the objectives. The Council consists of representatives of the Confederation of Swedish Enterprise, county administrative boards, the Geological Survey of Sweden, municipal authorities, the National Boards of Housing, Building and Planning, Fisheries, Forestry, and Health and Welfare, the National Chemicals Inspectorate, the National Heritage Board, the National Institute of Public Health, the National Road Administration, the Swedish Board of Agriculture, the Swedish Energy Agency, the Swedish Environmental Protection Agency and the Swedish Radiation Protection Authority. Members are appointed by the Government.
Each year, the Council is required to present to the Government an overall assessment of progress towards the environmental quality objectives. This is the first of its annual reports. The Council intends to further refine its monitoring and reporting procedures. In addition to the fifteen objectives, this report considers four broader issues related to them: the natural environment, land use planning and wise management of land, water and buildings, the cultural environment, and human health. Progress reports on the environmental objectives have previously been published by the Environmental Protection Agency in the de Facto series (1998, 2000, 2001).
Jan Bergqvist
Chairman, Environmental Objectives Council
g l o s s a r y
2
Alkalinity = ability to resist acidification Anthropogenic = resulting from human
activities
Antifouling systems = agents and
methods used to prevent growth of aquatic organisms on boats, jetties etc.
AOT40 = accumulated exposure (to
ground-level ozone) over the threshold concentration of 40 ppb
Bycatch = unwanted fish and other
marine animals trapped in nets during fishing for a different species
CAP = Common Agricultural Policy of the
European Community
CET = Central European Time CFCs = chlorofluorocarbons, used in
refrigeration, heating and air-conditioning equipment, chemical products and foamed plastics
CLRTAP = Convention on Long-Range
Transboundary Air Pollution
Demographic = relating to the size,
struc-ture and development of populations
Dystrophic = used to denote lakes whose
water is coloured brown by peat or humic acids
EEA = European Environment Agency Eutrophic = nutrient-rich
External dose = amount of radiation from
the surrounding environment
Fennoscandia = geographical and
geologi-cal region comprising Norway, Sweden, Finland, the Kola peninsula and Russian Karelia
FOI = Swedish Defence Research Agency GDP = gross domestic product
Halons, used in fire-extinguishing
equip-ment
HCFCs = hydrochlorofluorocarbons, used
in refrigeration, heating and air-condition-ing equipment, chemical products and foamed plastics
Internal dose = amount of radiation from
radioactive substances in the body. Caesium-137 is ingested with food; potassium-40 occurs naturally in the body.
International bunker fuel emissions =
emissions from fuel sold to ships or air-craft engaged in international transport
IPCC = the UN’s Intergovernmental Panel
on Climate Change
IVL = IVL Swedish Environmental
Research Institute Ltd.
Landscape features = e.g. stone walls,
wooden fences, ditches, solitary trees, avenues, meadow barns
Malignant melanoma = highly malignant
form of skin cancer
MED = minimum erythemal dose, i.e. the
amount of radiation from the sun or a solarium that causes slight reddening of the skin
Mesotrophic = moderately nutrient-rich Methyl bromide, used as a pesticide,
mainly in developing countries
mSv = millisievert, unit of absorbed dose
of radiation
nGy/h = nanogray per hour, unit of
absorbed dose of radiation
OECD = Organisation for Economic
Co-operation and Development
Oligotrophic = poor in nutrients PCBs = polychlorinated biphenyls
PM10 = particulate matter with a diameter
of less than 10 micrometres
ppb = parts per billion (i.e. per one
thousand million)
Ramsar Convention = Convention on
Wetlands of International Importance especially as Waterfowl Habitat, adopted at Ramsar, Iran, in 1971
Recruitment = increase in natural
popula-tion as young animals grow and reach a size qualifying them to be counted as a member of the population
Red List = list of threatened and
near-threatened species
RIVM = Rijksinstituut voor
Volksgezond-heid en Milieu, the National Institute of Public Health and the Environment of the Netherlands
SGU = Geological Survey of Sweden SMF = Stockholm Marine Research
Centre
Stratosphere = layer of the atmosphere
20–50 km above the earth’s surface
Sublittoral = zone of the seashore that is
normally permanently covered by water
Terrestrial = relating to land
Troposphere = layer of the atmosphere
0–20 km from the earth’s surface
UV = ultraviolet
VOCs = volatile (i.e. readily evaporating)
organic compounds
WHO = World Health Organization,
a UN agency
WWF = World Wide Fund for Nature
The environmental objectives
– are we on track?
A p r o g r e s s r e p o r t f r o m t h e E n v i r o n m e n t a l O b j e c t i v e s C o u n c i l
3
t h e e n v i r o n m e n t a l o b j e c t i v e s – a r e w e o n t r a c k ?Objectives and fundamental principles Increasingly, the focus of international coopera-tion is on the environment and sustainable development. Thirty years ago, the first global conference on environment and development under UN auspices was held in Stockholm. The Rio Conference, 20 years later, highlighted the need for both global and local efforts to safeguard the environment. One of the docu-ments adopted in Rio was Agenda 21, a global programme for sustainable development, which has had a powerful impact at the local level in Sweden. ‘Sustainable development’ is a ques-tion of interacques-tion between the natural and cul-tural environments and social and economic development. Sweden’s fifteen environmental quality objectives describe the state of the country’s environment that is necessary to achieving sustainable development.
During the 1990s, the Swedish Parliament introduced around 170 environmental goals. Three years ago, it adopted fifteen new envir-onmental quality objectives, replacing the existing goals. These objectives are intended to
• promote human health,
• preserve biodiversity and the natural
envir-onment,
• preserve the cultural environment and
cul-tural heritage,
• maintain long-term ecosystem productivity and
• ensure wise management of natural resources.
These five fundamental principles were described in de Facto 2001.
The generation goal
The overall goal is to hand over to the next gener-ation a society in which the major environmental problems now facing us have been solved. This means that all the important measures needed in Sweden must be implemented by 2020 (2050 in the case of the climate objective). Nature takes time to recover, so in some cases the desired en-vironmental state will not be attained by 2020, even if very substantial efforts are made.
To achieve the ‘generation goal’, major com-mitments by a wide range of actors are required. Technical advances can help to solve some of the problems. More far-reaching societal changes may also be necessary. For some objectives, Swedish measures will be sufficient, but most require action both in this country and abroad. To tackle the threat of climate change, global agreements are needed, even if the necessary measures must be taken by each country on a national basis – and indeed, by every citizen. Pressures on environment are changing Pollution from point sources is abating. Vehicle exhausts and factory flue gases are becoming cleaner, improving air quality and, in the long term, reducing damage to buildings and cultural artefacts. Lower nitrogen emissions from trans-Will the environmental quality objectives be achieved? Are we making sufficiently rapid progress? trans-Will we be able to hand over to the next generation a society in which the major environmental problems have been solved? Are efforts to safeguard the natural and cultural environments, human health and natural resources adequately integrated with other societal goals, so as to secure the best solutions?
t h e e n v i r o n m e n t a l o b j e c t i v e s – a r e w e o n t r a c k ?
4
port, sewage systems and agriculture mean that a slight easing of the eutrophication problem can be discerned, although the improvement has not been fast enough. We have an inadequate knowl-edge of the environmental effects of diffuse emissions from the growing quantities of chemi-cals in use. Greenhouse gas emissions have not changed appreciably in the last few years.
In forestry, much greater care is now being taken to preserve valuable habitats. Farmers are better placed to manage their pasture land and preserve cultural features, thanks to payments under the Environmental and Rural Develop-ment Plan in Sweden. Wetlands are better pro-tected against drainage and are being restored in farming areas. Adverse pressures on wet-lands, farmland and forests have thus eased significantly in the last five years.
There is still too much pressure on the marine environment. Overfishing has led to the collapse of some stocks and significant shifts in the balance between species. The Baltic cod population is now seriously under threat. Environment’s response is slow
In the case of many environmental and health problems, recovery, or the environment’s response to action taken, is a slow process. The state of the environment therefore does not improve as quickly as pressures ease, as the fol-lowing examples illustrate:
• It will take about 10 years for there to be any
discernible improvement in the ozone layer, and over 50 for it to recover completely, assuming phase-out of ozone-depleting sub-stances continues as planned.
• Persistent toxic pollutants can remain in
water and soil for a very long time after they are emitted. When taken up by plants and animals, they can continue to affect the en-vironment and human health.
• Cancer has a long latency period, which
means that reduced incidence rates are
sometimes not observed until 20 years after the exposure responsible has been reduced. Skin cancer following excessive exposure to UV radiation is a case in point, although its incidence depends very much on people’s lifestyles and outdoor habits.
• Despite successful action in agriculture and
forestry, it will in many cases be a long time before any improvement is seen in the en-vironment. In forests, the time lag is often at least one forest generation, or 70–150 years.
• Greenhouse gas emissions influence climate
for hundreds of years to come, and a temper-ature rise that has occurred will persist for a very long time, even if emissions fall sharply.
Most interim targets can be met, but further action is required
Parliament has adopted numerous interim tar-gets, to be met by specific dates (usually 2010). Many of them will probably be attained with-out additional measures – for example, the tar-gets for sulphur levels in air, hard dead wood in forests, landfill disposal of waste, emissions from ships, conservation of small-scale habitats on farmland, and clean-up of contaminated sites.
In most cases, though, further action is ne-cessary. Carbon dioxide emissions and nitrogen losses from soils are two examples. In a few cases it may prove very difficult to meet the tar-gets, owing for instance to conflicting goals or a lack of knowledge, or because such far-reaching change is needed that it is difficult to persuade all the relevant actors to implement it in the defined time-frame.
Under each environmental quality objective there are interim targets that are easy to meet and others that are difficult to attain. The over-all assessment is thus that the interim targets can be achieved, but that further action needs to be taken. The targets vary in character: some are an integral part of the final objective, while others represent one step towards it.
Consequently, an environmental objective may not necessarily be achieved, even if all the interim targets are met. New interim targets therefore also need to be developed. Will we achieve the overall objectives? Within one generation, i.e. by 2020, the envir-onmental quality objectives are to have been achieved – or at any rate, all the measures ne-cessary to attaining them are to have been implemented. In some cases, it may take longer than this for the environment to recover. Reducing our impact on climate will take more than one generation, and here Parliament has adopted a long-term goal for the year 2050. In several cases, international efforts are crucial to achieving the objectives.
Some of the environmental objectives are judged to be difficult to achieve, even if addi-tional action is taken. This is especially true of the climate goal, but also of those relating to eutrophication, forests and a non-toxic environ-ment. For many of the objectives, develop-ments in the transport, energy and construction sectors are critical to success. In several cases, conflicts with other goals of society create diffi-culties. An adequate supply of energy, for example, is hard to achieve without any impact on climate, aquatic environments or the cultural landscape. Similarly, our need for efficient transport impedes progress towards several of the objectives. Expansion of infrastructure can disturb the natural and cultural environments, and yet appropriately designed infrastructure – making possible sewage treatment, greener transport etc. – can help ensure that environ-mental problems are not exacerbated.
The far-reaching structural changes occur-ring in society are undermining much of the basis for using and conserving our cultural her-itage. If parts of our history are not to be oblit-erated, we need to pursue regional develop-ment policies that promote the survival of exist-ing cultural environments. Otherwise, the
objectives that include conservation and devel-opment of built environments of cultural and historical value could prove difficult to achieve. This is particularly true as regards the farmed landscape, where a continuation of agriculture is essential to preserving both cultural heritage and biological assets in their proper context.
Noise, especially from traffic, is a widespread environmental problem and the form of disturb-ance that affects the largest number of people. An estimated two million Swedes are exposed to noise levels that affect their health. It is expected to be very difficult to achieve the targets for noise by 2020. Radon in homes and other buildings is another problem. Almost half a million homes have radon levels exceeding the interim target proposed in the Indoor Environment Bill. Radon causes some 400 cases of lung cancer every year. Smokers are particularly at risk, accounting for around 350 of these cases. Air pollution, e.g. from road traffic, still causes many deaths.
In several areas it has proved possible to sever the link between economic growth and pressure on the environment. This is true, for example, as regards industrial country emissions of acidifying pollutants, and emissions of nitro-gen oxides. Energy consumption and hence carbon dioxide emissions are closely linked to economic development. Even if less and less energy is used in manufacturing and other pro-cesses, it will be difficult to eliminate this link. The development of our society – and hence success in securing a better environment – is intimately bound up with developments at the international level. Progress can be noted, including the EU’s chemicals strategy and the Gothenburg Protocol on air pollution. The Kyoto Protocol lays the foundations for a global regulatory framework to limit and reduce greenhouse gas emissions. In several fields, Sweden needs to take an even clearer lead, not least within the EU. This is obviously the case in relation to the climate goal, but it is also important for some of the other objectives.
5
t h e e n v i r o n m e n t a l o b j e c t i v e s – a r e w e o n t r a c k ?90 100 110
In the index year 1990, EU emissions of greenhouse gases, expressed as carbon dioxide equivalents, totalled 4199 million tonnes.
Between 1990 and 1999, emissions fell by 4% for the EU as a whole, with Germany and the UK making particularly significant contribu-tions to the overall reduction. Further action needs to be taken, though, if the EU member states are to fulfil their first joint commit-ment under the Kyoto Protocol. Predictions indicate that green-house gas emissions in 2010 will not be below 1990 levels.
1990 2000 2010 index, 1990 = 100
fig. A Index of greenhouse gas emissions in the 15 EU member states, 1990–1999 1995 2005 path to Kyoto Protocol target emissions target for 2008–12
1
o b j e c t i v e
The UN Framework Convention on Climate Change provides for the stabilization of concentra-tions of greenhouse gases in the atmosphere at levels which ensure that human activities do not have a harmful impact on the climate system. This goal must be achieved in such a way and at such a pace that biologi-cal diversity is preserved,food production is assured and other goals of sustainable develop-ment are not jeopardized. Sweden,together with other countries,must assume responsibility for achieving this global objective.
Reduced climate impact
Human activities have affected climateLevels of greenhouse gases in the atmosphere have increased since the Industrial Revolution, and are continuing to rise. The UN’s Inter-governmental Panel on Climate Change (IPCC) has evaluated all the scientific data and con-cludes that there is clear evidence that climate has changed in the last 150 years. The IPCC considers this to be partly a result of human activities. If global emissions continue at their present level, the risk of the climate system being affected to a dangerous degree will increase, in terms of both the scale and the pace of the temperature rise.
Burning of fossil fuels a major cause Combustion of fossil fuels accounts for the largest Swedish contribution to the greenhouse
effect. However, the proportion of the country’s energy supply derived from renewable sources has increased. At the same time, energy use is becoming more efficient, helping to reduce specific energy requirements. This does not always result in an absolute decrease: for exam-ple, carbon dioxide emissions from transport are continuing to rise. Furthermore, emissions vary widely from one year to another, depending on the state of the economy, the availability of hydroelectric power and the weather – the lat-ter especially in winlat-ter, when most heating is required.
In 2000, emissions of greenhouse gases were just under 2% lower than in 1990. Emissions of methane and nitrous oxide fell by an estimated 14% and 9% over this period, and thus account for a large share of the decrease. Carbon di-oxide emissions were 0.5% lower in 2000 than in 1990.
Temperature expected to rise more in Nordic region than worldwide
Climate change is expected to be more pro-nounced in the Nordic countries than in the world as a whole. If the global temperature rise is about 2.5°C on a timescale of 50–100 years, the increase in the Nordic region could be around 4°C. Precipitation could also be marked-ly affected. The consequences for important Swedish sectors such as agriculture and forestry could be far-reaching. Regarding nature conser-vation and biodiversity, there is a risk of sensi-tive ecosystems in mountain areas and the Baltic Sea being eliminated. Furthermore, the basic conditions for sustainable development in other parts of the world could be radically altered, with repercussions for Sweden.
r e d u c e d c l i m a t e i m p a c t
6
-0.4 -0.1 0.4 0.2 0.5 0.3 0.1 0.0 -0.2 -0.3 1880 deviation, °C 1900 1920Since the end of the 19th century, the earth’s tempera-ture has risen by about 0.6°C. The IPCC’s assessment is that most of this rise can be attributed to an increase in atmospheric concentrations of greenhouse gases, resulting from human activities.
1940 1960 1980 2000
fig. 1.1 Deviation of global annual mean temperature from average for 1951–1980 (five-year mean)
7
r e d u c e d c l i m a t e i m p a c tProgress towards the objective Under the Kyoto Protocol, the industrial nations have pledged to limit their emissions of greenhouse gases. By 2008–12, emissions in the EU as a whole are to have fallen by 8% from 1990 levels. Over the same period Sweden is permitted to increase its emissions by 4%, but in March 2002 Parliament adopted an interim target for greenhouse gases, calling for average Swedish emissions to be at least 4% lower in 2008–12 than in 1990. This is to be achieved with no allowance made for uptake by carbon sinks (growing forests which bind carbon diox-ide) or flexible mechanisms (various forms of emissions trading). Progress towards the target is to be monitored, and further measures may be proposed at checkpoints in 2004 and 2008. The latest projections of greenhouse gas emissions, in Sweden’s third national
communi-cation under the Climate Change Convention (2001), indicate that emissions will be stabilized by 2010 and subsequently rise. Additional action may therefore be needed to meet the interim target.
Parliament has also adopted a long-term goal for greenhouse gases. By 2050, Sweden’s total emissions should be below 4.5 tonnes of carbon dioxide equivalents per capita per year, with a further reduction to follow. This means that emissions are to be cut by almost 50% from their present level. On current trends, and with the action strategies adopted so far, this goal will not be achieved.
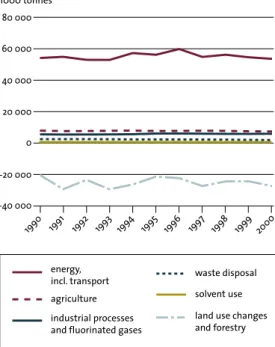
20 000 80 000 60 000 0 -40 000 40 000 -20 000 energy,
incl. transport waste disposal industrial processes
and fluorinated gases agriculture
land use changes and forestry solvent use 1000 tonnes
fig. 1.3 Emissions and uptake of greenhouse gases
1990
Around 80% of Sweden’s greenhouse gas emissions are due to the burning of fossil fuels in industry, the transport sector and at power and district heating plants, with other sectors accounting for the remaining 20%. Forests absorb carbon dioxide by incorporating it in biomass, and in Sweden this uptake corresponds to almost 30% of emissions. 1993 1995 1991 1992 1994 1996 1997 1998 1999 2000 500 600 700 800 400 850 750 650 550 450
10-year smoothed mean annual mean
1860 1880 1920 1960
mean precipitation, mm
fig. 1.2 Annual mean and ten-year mean
precipitation, 1860–2000
1900 1940 1980 2000
Precipitation has increased in Sweden in the last 140 years, although some of the rise reflects improvements in recording instruments and stations over the years. Higher temperatures in decades to come will probably be accompanied by increased precipitation over much of the country.
2
Damage to health, vegetation and materials Air pollutants give rise to a wide variety of adverse effects on health, including respiratory symptoms, allergies, cancer – and even deaths. The pollutants responsible include nitrogen oxides, sulphur dioxide and ground-level ozone, as well as certain volatile organic compounds (VOCs) and airborne particles less than 10 micrometres in diameter (PM10).
In a statistical sample of Sweden’s popula-tion, one-tenth reported medical symptoms that were primarily the result of vehicle exhausts and wood smoke. The incidence of cancer due to urban air pollution in Sweden is estimated at 200 cases a year.
Forest trees and agricultural crops are also affected by air pollutants. In the 1980s, produc-tion losses in Swedish agriculture due to ground-level ozone were estimated at around SEK 1 billion a year. In addition, air pollutants accelerate degradation of metals, limestone, rubber and plastics and damage culturally and historically significant buildings, statues and ancient remains.
Emissions both at home and abroad In urban areas, elevated atmospheric levels of nitrogen oxides, particulates and VOCs are caused by emissions from transport, industry and domestic heating. Use of solvents is an-other source of VOCs, and burning of wood and other biofuels for heating gives rise to emissions of both VOCs and particulates.
The majority of particulate matter measured as PM10 derives from abrasion of road surfaces and brake pads and, in spring, from grit applied to roads during the winter. The largest numbers of airborne particulates consist of very small particles (less than 0.1 micrometres), emitted by engines and other combustion sources.
The air pollution situation in Sweden is also strongly influenced by pollutants carried by winds from other countries.
International and national action
The main frameworks for international efforts to improve air quality are the UN Convention
20 40 100 60 80 86/87 88/89 92/9 3 98/ 99 index, Oct–Mar 1986/87 = 100 90/ 91 96/ 97 00/ 01 94/9 5
fig. 2.1 Air quality index
Emissions of sulphur dioxide in Swedish towns, chiefly from energy production and transport, have decreased by some 90% since the 1970s. Most of the other EU countries, too, have seen a sharp fall in emissions. In the case of nitrogen dioxide and soot, the improve-ments observed in Sweden have been appreciable. As a result of all these factors, corrosion and health problems have been significantly reduced.
The index is based on concentrations of sulphur dioxide, nitrogen dioxide and soot during the winter months (October–March) in some 35 municipalities, weighted for the sizes of their populations. Oct–Mar 1986/87: NO2 31 µg/m3, SO2 17 µg/m3, soot 11 µg/m3
nitrogen dioxide sulphur dioxide soot air, weighted index
Clean air
c l e a n a i r
8
o b j e c t i v e
The air must be clean enough not to represent a risk to human health or to animals, plants or cultural assets.
The objective is intended to be achieved within one generation.
9
c l e a n a i ron Long-Range Transboundary Air Pollution (CLRTAP) and the EU’s Clean Air For Europe (CAFE) programme. The focus here is on pro-ducing data to support revisions of earlier emis-sion reduction agreements: the Gothenburg Protocol – the most recent one signed under CLRTAP – and the EC Directive on national emission ceilings. Under the latter, Sweden is committed to cutting emissions of VOCs (other than methane) to a maximum of 241 000 tonnes by 2010. To honour this commitment, further action will be needed relating to small-scale burning of wood, transport, mobile machinery, industry and evaporation of solvents.
A new directive on air pollution due to ozone is currently being finalized. Work is also
in progress on an EC directive to reduce air pol-lutant emissions from major sources and to establish air quality objectives.
In Sweden, standards have been laid down under the Environmental Code for maximum acceptable levels of sulphur and nitrogen diox-ide, lead and particulates in outdoor air. These standards provide a tool for action at the local level.
Progress towards the objective
Levels of sulphur dioxide already meet existing environmental quality standards. In most places, they are also below the most stringent limits, designed to protect cultural artefacts and materials.
Nitrogen oxide emissions from road trans-port have been reduced by more efficient cata-lytic converters and the more stringent emis-sion standards for heavy vehicles introduced in the mid-1990s. However, concentrations remain high in major urban areas and on streets with heavy traffic. Tougher emission standards are to be introduced for all vehicles. Measures are also needed in the energy and mobile machinery sectors.
Corrosion of materials and health effects due to ground-level ozone will abate, but concen-trations with effects on crops could still be exceeded 20 years from now.
It is primarily in urban areas that people are exposed to particles and carcinogenic sub-stances. These pollutants remain a problem, especially in areas where wood-based heating is common, although concentrations above roof-top level will fall. Measures to reduce larger particulates in air are the easiest to implement. The Environmental Protection Agency has been asked to propose interim targets for small-er particles (PM2.5), too, and will be reporting in the summer of 2003. 30 70 50 10 %
fig. 2.3 Percentage of vehicle fleet fitted with catalytic converters, 1987–2000
1986 1988 1990 1992 1994 1996 1998
When catalytic converters became compulsory on new petrol-engined vehicles, in 1989, air pollutant emis-sions from road traffic began to fall more significantly. From a pollution point of view, this measure can be regarded as the most important one affecting road transport in the 1990s. In 2000, the proportion of traffic (in vehicle-kilometres) accounted for by vehicles fitted with catalysts was 78%.
2000 4 6 8 10 12 2 Rörvik Vavihill Aspvreten
critical level – crops
1989 2001
1000 ppb-hours
fig. 2.4 Exposure of crops to ozone at three sites in southern Sweden
Exposure of crops to ozone is expres-sed in AOT40 (ppb-hours). According to a proposed EC directive, this measure is to be calculated for the period May–July, 8 am–8 pm CET. Since Sweden has longer hours of daylight than this in summer, the real level of exposure may be higher. In the 1990s, the critical level for crops was exceeded at all three sites shown. By 2010, this level is not to be exceeded. 1991 1993 1995 1997 1999 20 40 100 60 80 toluenebenzene index, Oct–Mar 1992/93 = 100
fig. 2.2 Indices of benzene and toluene concentrations
00/ 01 92/9 3 93/9 4 94/9 5 95/9 6 96/ 97 97/ 98 98/ 99 99/ 00
Emissions of benzene entail a risk of cancer, primarily leukaemia: a rough estimate suggests that, in Sweden, current concentrations give rise to some 10 cases per year. One source of benzene is petrol, to which a limit of 1% benzene by volume now applies. Thanks to the use of catalytic converters on vehicles, benzene emissions are falling significantly. The target for this pollutant, to be achieved within one generation, is a concentration in air of 1 µg/m3.
The indices are based on concentrations of benzene and toluene during the winter months (October–March) in some 35 munici-palities, weighted for the sizes of their populations. Oct–Mar 1992/93: benzene 6 µg/m3, toluene 12 µg/m3
50 years of severe acidification have left their mark
Acidification of air, soil and water has had a radical impact on Sweden’s environment, affect-ing more than a fifth of the country’s forest and lake areas. The situation is most serious in the south. Above all, the flora and fauna of lakes and streams have been affected, partly as a result of acidic, aluminium-contaminated water draining from forest land. In addition, vital nutrients have been leached from forest soils.
Other effects of acidifying pollutants include corrosion of water pipes and degradation of buildings, monuments and heritage objects such as rock carvings and buried archaeological remains. Human health can also be affected, e.g. by acidic well water; in some parts of Sweden, groundwater is acidified.
Foreign emissions the main cause
The primary cause of modern-day acidification is atmospheric deposition of sulphur and nitro-gen. In 1996, around 90% of the sulphur, 80% of the nitrogen oxides and 60% of the ammonia deposited in Sweden derived from foreign sources.
The main Swedish sources of sulphur diox-ide are burning of coal and fuel oil and indus-trial processes. Nitrogen oxide emissions come from the transport and energy sectors and mobile machinery, while the principal source of ammonia is agriculture.
In forest areas, forestry also contributes to acidification of soils, lakes and streams, as a result of growth and harvesting of trees.
n a t u r a l a c i d i f i c a t i o n o n l y
10
100 250 150 50 200 1983 1985 2000 1000 tonnesfig. 3.2 Quantities of lime applied to lakes, streams and wetlands in Sweden
1987 1989 1991 1993 1997
Although emissions of acidifying pollutants have decreased, liming remains a necessary remedial measure in many of Sweden’s lakes and streams.
streams wetlands lakes
200 500 300 100 400 1980 1985 2000 1000 tonnes
fig. 3.1 Swedish emissions of sulphur dioxide to air (excl. international bunker fuel emissions)
1990 1995
Since the interim target for sulphur dioxide emissions was set, the emission figures have been revised. As a result, this target has already been achieved.
interim target 2010
Natural acidification only
3
o b j e c t i v e
The acidifying effects of deposi-tion and land use must not exceed the limits that can be tolerated by soil and water. In addition,deposition of acidifying substances must not increase the rate of corrosion of technical materials or cultural artefacts and buildings.
The objective is intended to be achieved within one generation.
11
n a t u r a l a c i d i f i c a t i o n o n l yInternational cooperation bearing fruit Acid deposition has abated in Sweden, thanks to the international agreements reached under CLRTAP and action taken at the EU and national levels in the energy, industrial and transport sectors. The most recent CLRTAP protocol was signed in Gothenburg in 1999.
A national measure that can best be described as a holding action is liming of lakes and streams. In Sweden, some 7500 lakes have been limed – just over 90% of the area acidi-fied.
Progress towards the objective
Deposition of sulphate fell by around 60% in the 1990s. Concentrations of nitrogen in rain and snow have declined over much of Sweden in recent years, but as total precipitation has increased no clear trends in deposition can be seen. If the Swedish natural environment is to recover, even larger emission cuts must be achieved – beyond the Gothenburg Protocol’s targets and the EU’s Emission Ceilings Directive – in Sweden and the rest of Europe.
In 2000 Sweden emitted approx. 57 000 tonnes of sulphur dioxide (excluding international bunker fuel emissions) and the interim target for this pollutant has thus been met. Nitrogen oxide emissions, on the other hand, need to be reduced by almost another 100 000 tonnes.
European estimates, made as a basis for international negotiations, indicate that the area of natural ecosystems where the critical load for acidification is exceeded will decrease from 16% in 1990 to 4% in 2010. However, more detailed Swedish estimates suggest that in 2010 the critical load will still be exceeded in 13% of the area. And even if deposition falls below crit-ical levels, recovery may take several decades.
The trends for forest soils are contradictory, but suggest that acidification is persisting across much of Sweden, with weak signs of a recovery in the south. Recovery will be facilitated by forestry methods adapted to the acid sensitivity of individual sites and by an increased area of forest with a significant deciduous element.
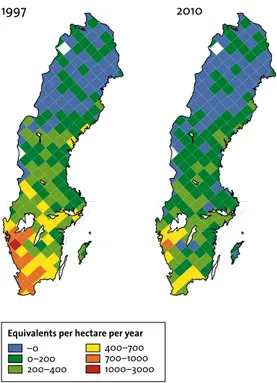
In lakes and streams, recovery began as early as the 1980s and accelerated in the 1990s. Despite this, it is uncertain whether the interim target will be met: studies in south-west Sweden suggest that many lakes will still be acidified in 2010. –0 0–200 200–400 400–700 700–1000 1000–3000 1997 2010
Equivalents per hectare per year
fig. 3.3 Exceedance of critical loads for forest soils and lakes in Sweden, 1997 and 2010 (in line with Gothenburg Protocol)
In 2010, acid deposition in south-west Sweden will still clearly exceed what the natural environment is able to withstand. 150 200 250 300 350 50 100 1990 1992 2000 1000 tonnes 1996 1998 1994 interim target 2010
With the present rate of decrease of emissions, it is uncertain whether the interim target of 148 000 tonnes – relevant to the two objectives Natural acidification only and Zero eutrophication – will be met.
fig. 3.4 Emissions of nitrogen oxides in Sweden
4
Thousands of chemicals in circulation Currently, over 12 000 chemical substances are listed in the National Chemicals Inspectorate’s register of chemical products manufactured in or imported to Sweden. These substances are found in some 64 000 chemical products, which in turn are used in an even larger number of products such as vehicles, plastic items, clothes and building materials. In addition, an unknown number of substances enter the Swedish market in imported goods, and substances are formed unintentionally in industrial processes. Every year, an estimated 160 million tonnes of goods enter circulation in Sweden. Chemicals can be released from products, buildings etc. when they are produced, used or scrapped. The pres-ence of hazardous substances in goods makes recycling more difficult. The global output of chemicals is expected to continue to rise in pace with gross domestic product.
Knowledge gaps and risks must be tackled Major gaps exist in our knowledge of the health and environmental effects of chemicals and pol-lutants, making it difficult to identify all the substances that could damage health or the environment and to assess and reduce the risks. However, we do know that, overall, chemicals in workplaces and in the outdoor and indoor environments have effects on health and the natural environment. A few per cent of the population have too much cadmium in their kid-neys, for example. PCBs and brominated flame retardants can be found in breast milk. A mil-lion Swedes have symptoms linked to the indoor environment, where chemicals are one of the background factors.
In the area of chemicals, adequate EU rules are crucial, since in many cases they define the most stringent requirements that can be imposed nationally. Sweden must therefore continue to seek to influence the design of EU regulations on knowledge requirements, phase-out and risk reduction of dangerous substances. It is also vital that Swedish companies compile data on and phase out such substances, and minimize process emissions of pollutants. A forward-looking approach in this area can bring long-term commercial benefits.
Contaminated sites also require action Apart from the chemicals in products and struc-tures, there are a large number of contaminated sites. In 2001, county administrative boards identified 38 000 sites that are suspected to be contaminated – far more than the earlier esti-mate of 22 000.
A framework for remediating such sites is cur-rently being developed, inter alia by
strengthen-A non-toxic environment
o b j e c t i v e
The environment must be free from man-made or extracted compounds and metals that represent a threat to human health or biological diversity.
The objective is intended to be achieved within one generation.
40 80 200 120 160 1995 2000 2005 index, 1995 = 100
fig. 4.1 Projected growth in world GDP, population and chemicals industry production
2015 2020 2010
The output of chemical products is rising. According to the OECD, the value of world production of chemicals is expected to increase by 85% between 1995 and 2020.
GDP population chemicals production
13
a n o n - t o x i c e n v i r o n m e n ting the resources and expertise of county admin-istrative boards. Legal proceedings to establish precedents in cases of unclear responsibility should help to clarify where remediation is not the responsibility of society at large. Clean-up of sites will take a long time and require major investments by the parties concerned.
Progress towards the objective
The EU’s chemicals strategy, presented in spring 2001, has improved the prospects of achieving this objective. So too have global efforts, e.g. under the Conventions on Persistent Organic Pollutants and on the Control of Harmful Antifouling Systems on Ships.
One interim target is for data to be available on the properties of all chemicals on the market by 2010. A new EU system, with timetables for
testing and registration, is being developed, and this will provide better information about chemicals and their properties. However, whether this system will be sufficiently ambi-tious remains to be seen.
Also by 2010, products are to be labelled with health and environmental information on any hazardous substances they contain. A great deal of work has still to be done to create a cor-responding system at the global level.
Phase-out of substances that are carcino-genic, toxic for reproduction or mutagenic is to be achieved at the EU level, through an author-ization system. The EC Council wants this sys-tem to cover persistent and bioaccumulating substances, too. These issues have yet to be addressed in related directives, e.g. the Plant Protection Products Directive.
In addition, an overall reduction of risks is called for. The EU’s chemicals strategy gives industry a clear responsibility for this.
According to risk indicators calculated for agri-cultural and hortiagri-cultural pesticides, the risks entailed by pesticides entering the market remain undiminished. Steps have, though, been taken to reduce the risks arising from their use.
fig. 4.3 Percentage distribution of chemical products by category of danger
In 2000, the turnover of chemical products on the Swedish market was around 70 million tonnes, of which some 19 million tonnes were exported. Fuels such as petrol and diesel are classed as toxic, and since they are used in large volumes almost half the total quantity of chemical products falls into this category. toxic irritant very toxic corrosive harmful moderately harmful unmarked
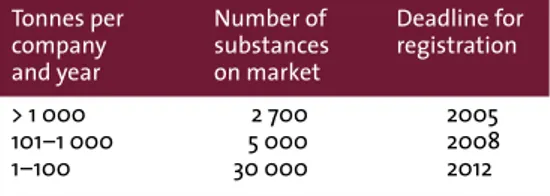
table 4.1 Number of substances and timetable for registration
The EU’s new chemicals strategy is based on registra-tion, evaluation and authorization. All chemicals produced or imported in quantities exceeding 1 tonne are to be registered. Data corresponding to the basic requirements for new substances are only available for 14% of the chemical products currently used in the EU in volumes of more than 1000 tonnes per year. The new system is intended, step by step, to provide us with better knowledge in this area.
> 1 000 101–1 000 1–100 2 700 5 000 30 000 2005 2008 2012 Tonnes per company and year Number of substances on market Deadline for registration 600 1400 1000 200
Classified under Swedish National Chemicals Inspectorate regulations:
1996:5 2001:3 2000:9 1997:5 C N number M R
Within the EU, more and more substances are being classified in the categories mutagenic (M), toxic for reproduction (R), carcinogenic (C) and dangerous for the environment (N). As a result, our knowledge of certain substances with dangerous properties is improving. Classification and labelling help to disseminate information about such chemicals. For many substances, risk reduction measures are necessary. In addition to the substances included in the diagram, 671 complex carbon- and petroleum-based substances are classified as carcinogenic.
fig. 4.2 Numbers of classified substances assigned to different categories
a p r o t e c t i v e o z o n e l a y e r
14
A protective ozone layer
5
o b j e c t i v e
The ozone layer must be replenished so as to provide long-term protection against harmful UV radiation.
Effects of 50 years’ emissions now visible In the last 15 years, the ozone layer has been depleted by about 5% worldwide. Over Antarc-tica, thinning of roughly 50% occurs during the spring months of September–October. At north European latitudes, depletion of 5–10% has occurred in the last 20 years. Measurements of the thickness of the ozone layer above Norr-köping reveal wide seasonal and between-year variations, and no clear trend has been identified.
Ozone depletion is due largely to the last 50 years of emissions of ozone-depleting substances such as CFCs, HCFCs, halons, methyl bromide
and certain chlorinated solvents. These com-pounds often remain in the atmosphere for a very long time before they are broken down, and the impact of emissions persists for several decades. Other factors also influence the thickness of the ozone layer, e.g. particulates and water vapour from high-altitude aircraft and concentrations of greenhouse gases in the atmosphere.
Damage to health and environment A depleted ozone layer allows more ultraviolet (UV) radiation to reach the earth’s surface, caus-ing harm to health and the environment. The main adverse effects include increased risks of:
• sunburn and different types of skin cancer,
• damage to the immune system,
-15 15 -5 5 10 0 -10 -20 -25 trend line %
fig. 5.1 Ozone layer above Norrköping, 1988–2002, relative to ozone layer above Uppsala, 1951–1966 (monthly deviation, %)
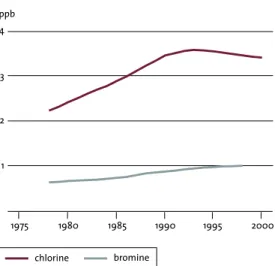
The blue line indicates the deviation of the linear trend for Norrköping over the period. It shows that, on average, the ozone layer has been thinner above Norrköping since 1988 than it was above Uppsala over the period 1951–66. The eruption of Mount Pinatubo in 1991 had a clearly discernible effect on ozone levels in the stratosphere. 1988 1990 1991 1992 1994 1996 1998 2000 2002 Pinatubo 1 4 2 3 1980 1995 ppb
fig. 5.2 Tropospheric concentrations of chlorine and bromine
1985 1990 2000
Chlorine levels in the troposphere peaked around 1993, while the concentration of bromine is still rising. The total concentration of chlorine and bromine in the stratosphere was expected to begin to fall around 2000.
1975
15
a p r o t e c t i v e o z o n e l a y e r• damage to the eyes, e.g. cataracts,
• damage to aquatic and terrestrial ecosystems,
• damage to agricultural crops and forest trees,
• damage to materials.
Progress towards the objective
Up to now, phase-out of ozone-depleting sub-stances has often involved their being replaced in refrigeration equipment and other applica-tions with chemicals which instead have some impact on climate. The Swedish Parliament has decided that the great majority of the country’s ozone-depleting emissions are to be eliminated by 2010. To achieve that aim, alternative, envir-onment-friendly technologies or other methods
need to be made available. At present, ozone-depleting substances are used chiefly in the defence forces, in civil aviation and at certain laboratories. Ozone depleters can also leak from products when they are used or scrapped, although these emissions can be reduced by better monitoring and environmentally sound waste management. In addition, growth in high-altitude flying is increasing emissions in the stratosphere, with possible adverse effects on the ozone layer.
Thanks to measures introduced by Sweden and other countries, atmospheric levels of ozone-depleting substances are now beginning to fall. However, other factors affecting the ozone layer have also changed, partly offsetting this improvement. Assuming that the Montreal Protocol is implemented by all the signatories, levels of ozone depleters in the stratosphere are expected to fall to about 2 ppb chlorine by 2050. It will take at least 100 years for concen-trations to return to their natural level of 0.7 ppb chlorine. The latest assessments by European scientists indicate that there will be no dis-cernible recovery of the ozone layer above Europe until 2010 at the earliest, and that full recovery will take at least until 2050.
change in annual UV dose 11–13% 9–11% 7–9% 5–7% 3–5% 0–3% not measured
fig. 5.3 Estimated increase in ultraviolet radiation in Europe, 1980–1997
As a result of thinning of the ozone layer, levels of ultraviolet (UV) radiation in Sweden rose by 7–11% over the period 1980–97.
Changes in UV radiation have been calculated on the basis of measured total ozone values (assuming cloud-free conditions).
Sources both natural and man-made We are constantly exposed to different sources of radiation in our environment. In the case of certain natural sources, such as radon and ultra-violet (UV) radiation, we ourselves can do something about our levels of exposure. As far as radon is concerned, the synergetic effect of radon and smoking means that most cases of
lung cancer occur among smokers. The radi-ation source with the biggest impact of all on health is UV radiation from the sun and solaria, exposure to which depends largely on individ-ual lifestyles and outdoor habits. Information to persuade people to reduce their annual UV dose is therefore important. To assist in this information effort, a system to provide data on the level of solar UV radiation at any chosen location in Sweden is being developed.
There are also radiation sources that are the result of human activities, such as nuclear power. A major challenge today is to resolve the issue of final disposal of spent nuclear fuel. Other sources of radiation include fallout from nuclear weapons tests and reactor accidents, electromag-netic fields produced for example by mobile phones, radioactive wastes from health care and industry, and enrichment processes in industry.
No protection criteria for environment At present, there are no indicators or radiation protection criteria relating to plants and animals, and no national monitoring programme to pro-vide an overall picture of the radiation environ-ment and any effects of radiation. Among other things, we need to know more about the process-es which redistribute radioactive substancprocess-es in the environment. For example, caesium-137 may be released as an unintentional by-product of a practice, with local effects on the radiation envir-onment – for example, when ash from biofuel-fired plants is recycled to forest soils or landfilled. Natural redistribution processes, too, can result in local enrichment of radioactive substances:
o b j e c t i v e
Human health and biological diversity must be protected against the harmful effects of radiation in the external environment. 20 120 60 80 40 100
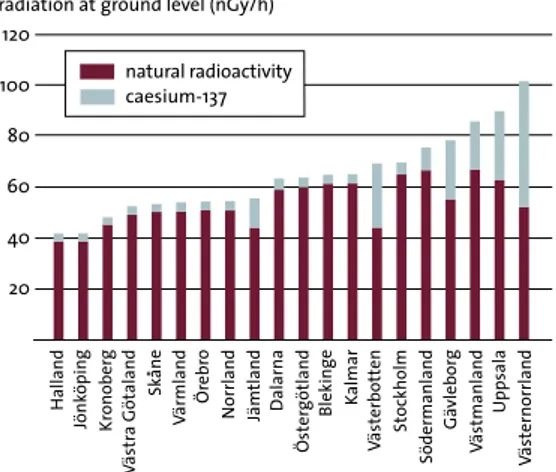
fig. 6.1 External dose at ground level from naturally occurring radioactive substances and fallout of caesium-137, by county, estimated for 2001
(Data for Gotland county not available)
natural radioactivity caesium-137
Halland
radiation at ground level (nGy/h)
Jönk öping Kr onober g V ästr a Götaland Sk åne V ärm land Ör ebr o N orrland Jäm tland Dalarna Öster
götland Blekinge Kalm
ar V ästerbotten Stockholm Söderm anland Gä vlebor g V ästm anland Uppsala V ästernorrland
Caesium-137 began to occur in the environment in the 1950s, as a result of human activities. The largest radioactive releases came in the wake of the nuclear weapons tests of the 1950s and 1960s and the Chernobyl accident in 1986. After the weapons tests, radioactive substances dispersed widely through the atmosphere and fell to the ground with precipitation over several years. The fallout from Chernobyl, on the other hand, was highest in the regions that happened to have rain in the few days following the accident.
a s a f e r a d i a t i o n e n v i r o n m e n t
16
6
A safe radiation
when dissolved in water they may for instance be taken up by wetland plants or accumulate in peat soil. To allow action to be taken, more needs to be known about these processes and their conse-quences for radiological protection.
Progress towards the objective
To achieve the interim target for UV radiation, long-term measures need to be introduced as soon as possible. Thanks to increased funding for 2002, public agencies are now better placed to play a part in reducing the future incidence of skin cancer.
One area relevant to the target for radioactive emissions is the management of spent nuclear fuel and other radioactive wastes. The nuclear power industry must develop a final disposal
sys-tem that meets radiological protection standards and enjoys wide support among decision-makers and the general public. If the target date is to be met, priority must be given to scrutiny of propo-sals, consultation, and definition of standards.
Environmental monitoring and research form an important basis for radiological protection. If such work shows them to be necessary, enforce-ment measures can be introduced, e.g. based on regulations and recommendations. The scale of research in radioecology and radiobiology is once again as limited as it was just before the Chernobyl accident in 1986: in 2001, funding for these areas was virtually non-existent.
Work has begun to develop a national environ-mental monitoring programme for radioactive substances, and it is important that it continues. A programme of this kind will provide a better basis for estimating total radiation doses to human beings and the environment, and also for remedying the current lack of indicators and radi-ation protection criteria for animals and plants.
2 8
4 6
fig. 6.3 Skin cancer cases as a percentage of all cases of cancer in 1999, related to estimated total annual dose of UV radiation at different latitudes in Sweden
1200 1400 1600 1800 2000 2200 2400 UV dose, MED/year %
Malignant melanoma has become more common, increasing from a couple of hundred cases a year in the late 1950s to 1600 cases in 1998. Some 350–400 people die of the disease every year. Since the time between exposure and the development of skin cancer is almost 20 years, it is important that children and young people in particular learn to sunbathe in moderation.
squamous cell carcinoma malignant melanoma 10
0.1 0.01 1
fig. 6.2 Internal dose from the body’s content of caesium-137, in population groups from different regions (Note that the scale of the y-axis is logarithmic)
1965 1970 1975 1980 1985 1990 1995 2000 0.001
0.0001
internal dose from radio-caesium (mSv/yr)
The variation in caesium-137 levels in the body within and between regions is mainly due to the differing concentrations of this substance in people’s diets. The higher values noted in the 1960s and 1970s are a result of fallout from the nuclear test explosions, while those observed after 1986 reflect the accident at the Chernobyl nuclear power plant.
Västerbotten 1988–2001 Härjedalen 1965–1976 Gävleborg 1986-1998 Stockholm 1966–2000 Skåne 1964–1976
17
a s a f e r a d i a t i o n e n v i r o n m e n t7
Biodiversity affected and altered
Eutrophication is caused by high levels of nitro-gen and phosphorus. In many bodies of water, excessive inputs of these nutrients give rise to algal blooms, reduced transparency, oxygen depletion, contracting algal belts and anoxic bot-tom areas. Eutrophication is one of the most serious threats to the sea, and a major problem in many lakes and rivers. Toxic algal blooms can pose a serious health risk to people and animals.
Nitrogen from atmospheric deposition has accumulated in the soils of forests, meadows and pastures. As a result, their vegetation is gradually changing, as species adapted to
nutri-ent-poor conditions are displaced. Also, the risk of nitrogen losses to streams and groundwater is increasing. High nitrate levels in groundwater cause health problems, especially in children. Eutrophication is primarily a problem in south-ern Sweden, but there are also signs of it in the mountain areas of the north.
Farming, sewage and transport are the biggest sources
Nutrient enrichment of forests, heathlands and mires is largely due to deposition of nitrogen, while that of lakes and rivers can mainly be
1 2 4 5 3 1960 1965 1980 1995 µmol/l
fig. 7.1 Nitrate and phosphate levels in surface water at the Gotland Deep
1975 1985 1990 2000 1970
To attain the goal of Zero eutrophication, the nutrient status of coastal and offshore waters needs to be essentially the same as it was in the 1940s. In the surface water of the Baltic proper, nutrient levels have tended to fall somewhat in recent years, but they are still significantly higher than in the 1940s. What is more, in bottom water, levels of phosphorus have risen by about 20% since 1995, owing to oxygen depletion.
phosphate nitrate 10 20 50 30 40 60 1995 1000 tonnes/year 2000 interim target 2010
Inputs from point sources (municipal sewage works serving more than 2000 people, factories, and single-household sewage systems) have fallen by about 4000 tonnes, i.e. 20%, whereas agricultural inputs are estimated to be basically unchanged. Action in the farming and forestry sectors takes a long time to feed through into reduced inputs to the sea.
fig. 7.2 Total anthropogenic nitrogen inputs to sea areas south of the Åland Sea, 1995 and 2000
total of which, from point sources
o b j e c t i v e
Nutrient levels in soil and water must not be such that they adversely affect human health, the conditions for biological diversity or the possibility of varied use of land and water.
The objective is intended to be achieved within one generation.
z e r o e u t r o p h i c a t i o n