J
Ö N K Ö P I N GI
N T E R N A T I O N A LB
U S I N E S SS
C H O O LJÖNKÖPING UNIVE RSITY
D o e s S w e d e n e x p e r i e n c e
Jo b l e s s G r ow t h ?
An Empirical Study of the Relationship between Unemployment and Growth in
Sweden
Bachelor Thesis in Economics Author: Jessica Lund
Kandidatuppsats inom Nationalekonomi
Titel: Upplever Sverige tillväxt utan jobb? Författare: Jessica Lund
Handledare: Prof. Lars Pettersson, PhD. Kristina Nyström Datum: June 2006
Ämnesord: Tillväxt utan jobb,Svensk ekonomi, arbetsmarknad, sysselsättning, arbetslöshet
———————————————————————————————————
Sammanfattning
Syftet med den här studien är att analysera om Sverige upplever fenomenet tillväxt utan jobb inom den privata och den offentliga sektorn. Även vilka förändrigar som har skett över tid och när fenoment uppstod. Studien omfattar tidsperioden 1976 till 2003. Många har hävdat att fenomenet existerar, där bland United Nation Development Program (UNDP). Tillväxt utan jobb beskrivs som en ökning i reell BNP samtidigt som att arbetslösheten ökar. För studera problemet har sekundär data analyserats, men även lämplig teori och historisk bakgrund har legat till grund. Den här uppsatsen finner att den offentliga sektorn uppvisar tillväxt utaan jobb sedan tidigt 1990-tal. Den privata sektorn har delats in i tjänste- och industri sektorer, tjänste sektorn påvisar en minskad arbetslöshet samtidigt som den reella BNP ökar, vilket påvisar att tillväxt utan jobb inte existerar inom denna sektor. Samtidigt kan man hitta tillväxt utan jobb så tidigt som i slutet på 1970-talet inom den industriella sektorn, vilket visar att fenomenet tillväxt utan jobb inte är ett nytt fenomenet men begreppet visar sig vara nytt. Faktorer som ligger bakom tillväxt utan jobb är teknologiska framsteg och en ökning av maskinisering, vilket resulterar i att färre arbetare behövs för att utföra samma arbete.
Bachelor Thesis in Economics
Title: Does Sweden Experience Jobless Growth? Author: Jessica Lund
Tutors: Prof. Lars Pettersson, PhD. Kristina Nyström Date: June 2006
Subject terms: Jobless Growth, Swedish economy, labor market, employ-ment, unemployment
———————————————————————————————————
Abstract
The purpose of this study was to determine if Sweden was experiencing jobless growth, and if so, to ascertain when that jobless growth began, and in what ways it has affected the private and the public sectors, and to see how the sectors have been developing over time. This thesis will observe if jobless growth has occurred in the private and public sector during the time period of 1976 to 2003. The existence of the phenomenon of jobless growth is claimed to be present by several authorities, among others the United Nations Development Program, UNDP. Jobless growth is seen as an increase in real GDP while unemployment ratios increase simultaneously. The importance of this is to analyze why jobless growth appear and if there are other factors that underlies the problem. To proach the problem an analysis of secondary data has been used, as well as ap-propriate theory and historical background. This study concludes that the public sector is experiencing jobless growth since yearly 1990s. The private sector has been divided into two sectors; industry and service. The service sector shows de-creasing unemployment ratios as the level of real GDP grows, which means that jobless growth does not exist in this sector. Finally, the industrial sector illustrates that jobless growth have been present since the late 1970s, which underpins the fact that jobless growth is not a new phenomenon, but the concept appears to be new. The underlying factor for jobless growth is technological advances which enhance effectiveness and efficiency, and workers have been replaced with ma-chinery.
Table of Contents
1
Introduction ... 1
Theory of growth and unemployment ... 3
1.1 Defining Growth ...3
1.2 Growth Accounting ...3
1.3 Exogenous Growth Theory...4
1.4 Endogenous Growth Theory ...4
1.5 The Labor Market ...4
1.6 Unemployment...5
1.7 Population Distribution of Labor ...6
1.8 Okun’s Law ...7
2
Development of the Swedish economy ... 9
2.1 Historical Background ...9
2.2 Employment ratios and working hours in Sweden...9
2.3 Employment in different sectors ...10
3
Data analysis and Emperical analysis ... 11
3.1 Comparison of Total employment, employment in the public sector, the industrial sector, and the service sector ...12
3.2 Comparison of Real GDP and Employment ...13
3.3 Comparison of Real GDP and Unemployment...14
3.4 Correlation between real GDP and employment between 1976-1993 15 3.5 Correlation between real GDP and employment between 1976-1990 16 3.6 Correlation between GDP and Employment between 1994-2003 ...17
3.7 Correlation between GDP and Unemployment between 1976-1993 18 3.8 Correlation between GDP and Unemployment between 1994-2003 19 3.9 Comparison of Real GDP and Emplyoment in the Public Sector ...20
3.10 Comparison of Total Real GDP and Employment in the Private Sector 21
4
Conclusions... 22
4.1 Further Research ...23
1 Introduction
The United Nations Development Program (UNDP) Human Development Report 1994 states that “many parts of the world are witnessing a new phenomenon called jobless growth.” Jobess growth occurs when a nation’s Gross Domestic Product (GDP) increases while its unemployment rate simultaneously increases. Countries such as France, Germany and the United Kingdom, are examples of nations undergoing this phenomenon. It has been suggested that Sweden is one of many countries whose economy is struggling with this new trend (Anthuvan, 2005).
According to the International Labour Organisation (ILO), the world is currently experiencing the worst employment crisis since the Great Depression of the 1930’s. The ILO reports that over 30% of the world’s labor force is either unemployed1 (120 million) or underemployed2 (700 million) (Anthuvan, 2005). On March 14, 1994, the New York Times reported: “Seen from Europe, unemployment is the biggest security problem facing the western world today, and the G-73
is simply acknowledging that. Because if we don’t find answers to that problem, our entire system will collapse on itself.”
The existence of unemployment is generally due to an existing market failure caused by decreased demand for goods and services and, hence, decreased demand for the labor to produce those goods and provide these services. John Maynard Keynes asserted that government policies aimed at increasing effective demand would in time make the entire economy, employment included, return to equilibrium. It has long been assumed that once a recession is turned into an economic downturn, unemployment levels naturally take a dive (Anthuvan, 2005).
Growth and productivity are considered important indicators of the economic stability of a country. The ability to produce depends on how well technology and human capital coexist with each other (Caballero, 1997).
Sweden transformed itself from one of the poorest to one of the richest countries in the world within the space of a century. From 1870 to 1970, Sweden had one of the world’s highest growth of GDP per capita. Its labor market, which once supported itself mainly on agriculture, underwent structural changes to become a world-leading industrialized economy. The expansion of the educational system in the mid-19th
century was a contributing factor to this industrialization: In terms
1
Unemployment: defined as a person that is available and willing to work at existing wage rate, and that is unable to find a paying work. Source: (Wikipedia, n.d.).
2
Underemployed: defined as employed workers that are overqualified for their prevailing jobs. Source: (Wikipedia, n.d.).
of literacy, Sweden was the only country in the world that could compete with the United States in the late 19th
century (Schön, 2000). coordinate
This evolution greatly improved living conditions in terms of health issues, education, work issues and living arrangements. But this progress came to a halt in the 1970s when the oil crisis gave other countries the opportunity to improve their economic development while Sweden stood by and watched. Since the beginning of the 1990s, however, the economic growth of Sweden has been reasonably good. It has been characterized by steady growth and a low rate of inflation. Since 1993, growth has been increasing by an average of 3% annually, which corresponds to the total output growth of the 1980s. A major part of this continuous growth is believed to be the fact that Swedish companies successfully have managed to gain large profits through exports and foreign direct investments (FDI) (Södersten, 2002).
The purpose of this thesis is to determine whether Sweden is experiencing jobless growth and, if so, to ascertain when that jobless growth began, and in what ways it has affected the private and the public sectors, and to see how the sectors have been developing over time. This thesis is built upon research from literature and articles of scientific character. This study uses data collected from Statistics Sweden (SCB). I limited my self to this source since they have the most accessible databases with regard to studying growth and unemployment. The data collected is between 1976-2003, since I wanted to see if any changes had happen over time. This time period is used since data before 1976, concerning employment and unemployment are not comparable. The outline of the thesis will be according to the following. Chapter two outlines theoretical models used in this thesis. Chapter three gives a historical background to the Swedish economy in terms of growth and development. Chapter four presents an empirical analysis along with a data analysis. Chapter 5 contains the conclusion of the thesis and gives further research suggestions.
Theory of growth and unemployment
1.1 Defining Growth
Growth theory and growth accounting are tools that help us determine what our future standard of living is. Growth accounting tells us which production factor (labor, capital, etc.) is contributing to a change in total output, while growth theory facilitates our understanding of the economic decision-making process (e.g., how a change in today’s savings rate affects the capital stock in the future) (Dornbusch, 2004).
The most fundamental determinants used to define growth of output are labor, capital and technology. Through the increased input of capital, output can be made to grow which in turn both increases the demand for labor and improves productivity through enhanced technology (Dornbusch, 2004).
The production function is used to illustrate the relationship between output and input. It shows how output (Y) is dependant on labor (N), capital (K) and level of technology (A):
Y = AF(K,N) 1.1
The above production function helps to calculate real GDP based on the amount of labor, capital and level of technology used for production (Dornbusch, 2004).
1.2 Growth Accounting
The Growth Accounting equation shows the link between input growth and enhanced productivity of growth in output. It shows how changes in output growth depend on changes in labor growth, capital input and technological progress :
Y/Y = [(1- ) * N/N] + ( * K/K) + A/A 1.2 Where : Y/Y : change in output
(1- )* N/N : contribution of labor to growth of output
* K/K: contribution of capital to change in output
A/A : technological progress
By rearranging the growth accounting equation, one can derive the per capita form by reducing population growth on both sides of the equation. The equation in per capita form then becomes:
Y/Y= x
*
k/k + A/A. 1.3The k term signifies the labor-capital ratio, which denotes the numbers of machines per worker (Dornbusch, 2004).
1.3 Exogenous Growth Theory
Robert M. Solow made an important contribution to growth theory with the simple Solow growth model (also known as the neo-classical or exogenous growth model). The main implication of this model is that the economy will always converge back toward a steady state rate of growth, depending mainly on technological progress and the rate at which labor grows (Dornbusch, 2004). According to this model, the relationship between the number of people in the labor market and the output is proportional. For example, if the number of em-ployed people rises, both the capital per worker, and output per employee should correspondingly increase (Dornbusch, 2004).
One major flaw with this model however is that it does not explain what makes technological progress occur. This omission led to the development of
Endogenous growth theory (Dornbusch, 2004).
1.4 Endogenous Growth Theory
Endogenous growth theory deals with productivity improvements and can be related to a rapid speed of investment in human capital and innovation. It points out the importance of a government sector, private sector, and market institutions in order to encourage a more intuitive innovation milieu for individuals. Knowledge plays an important role in enhancing productivity growth, as advances in a high value-added knowledge economy will sustain a competitive advantage in growth production in the global market. Endogenous growth focuses mainly on a few key concepts that explain what factors lead to improvement in growth (Romer, 2001).
The main point is that one should not take technological progress as given, but rather that suitable govenrnment policy can lead to a lastingly higher growth rate for a country. This is especially true if the country is able to maintain its competitive advantage in the market and attain a higher rate of innovative strategies. It also shows the importance of private investment in R&D (research and development), which can be protected by patents or property rights (Romer, 2001).
Lastly, it also puts significant weight on human capital, which includes person’s skills, abilities and knowledge, all crucial factors for growth enhancement. The scale of how the labor force acquires human capital reflects how effectivly a country can produce. Thus, a greater amount of human capital increases its productivity and thereby improves the competitiveness of the country in the global market. Endogenous growth theory, therefore, shows and explains the key factor in having skilled labor in order for the economy’s GDP to grow (Romer, 2001).
1.5 The Labor Market
The labor market consists of both private and public organizations. Demand and supply for labor determines the real wage rate and wage differences between different sectors in the market. The wage structure influences our choices concerning education, profession, the number of hours we work, and the neighborhood in which we choose to live. How well the labor market is
functioning, determines what level of employment that is possible to reach in the long run (Södersten, 2002).
How much one is willing to work, and whether or not one wants to work at all is an individual’s choice. Preferences about how much one is willing to work arise with the opportunity cost of how profitable it is to work with regards to other activities. The higher the wage rate, the greater the opportunity cost of not working. Therefore, one may not increase the amount of hours worked if one can afford to buy more leisure as the real wage rate increases. There are two effects that result from a higher level of income. The first, the substitution effect, predicts that an increase in the real wage rate will result in an increased amount of hours worked while the second affect, the income effect, predicts the opposite situation (Södersten, 2002).
1.6 Unemployment
Milton Friedman developed the theory of natural rate of unemployment after concluding that a nation should settle for the lowest level of unemployment that does not start off an acceleration of inflation. He meant that monetary policy could not be used to reach a zero employment level in the economy. This definition has come to be referred to as NAIRU, Non-Accelerating Inflation of Rate of Unemployment, so as to preclude the assumption that zero employment can never be reached (Tobin, 1996).
There are four different classifications of unemployment: frictional, structural, seasonal and cyclical. Frictional unemployment occurs when there is a natural flow of people entering and leaving the labor market. This turnover is a completely healthy and normal process in a growing and developing economy. Structural unemployment occurs when technological development and international competition change the demands in regard to labor skills and location of jobs in the market. Structural unemployment lasts notably longer than frictional unemployment due to the fact that laborers need to relocate and reeducate themselves in order to find employment. Seasonal unemployment depends mainly on seasonal weather conditions. Depending on the sector, unemployment decreases or increases during a particular season. Jobs affected by this type of unemployment include fruit pickers, construction workers and seasonal ski workers. Cyclical unemployment occurs when output is below its full-employment level; it is the excess level of frictional unemployment. This type of unemployment follows the changes in the business cycle (Tobin, 1996).
1.7 Population Distribution of Labor
Figure 1 - Source: SCB (Statistics Sweden). Labor force patterns.
In the figure above, one can see how the population is distributed in the labor market. The labor force consists of either the Employed or unemployed. A person is considered to be employed if he or she worked at least one hour during a reference week, and was paid for it. One is considered to be unemployed if a person were not employed during one reference week, but were able and willing to work, and have been seeking for work during a four week period. Persons with in the labor force are between the ages 16-64. People that are not in the labor force, that desires to work are either students, retirees, liable for military service, and people doing house work (housewife). People that do not desire to work have either been ill for a very long time or they are currently abroad. (SCB, 2005)
This kind of division of the population is helpful in order to get a clearer picture of how the labor market is structured. One of the government’s goal is to decrease the open unemployment, and this is often done by educating the unemployed people. Following will happen; when a person is unemployed he or she is considered to be within the labor force, but when a person starts an educational program he or she will be considered to not be in the labor force. Thus, the labor force appears to be smaller than it acctually is, which makes the number of people unemployed seem less that what it acctually is.
Unemploye d Temporarily absent Workin g Employed
Labor force Not in the Labor force
Desire to work Do not desire to work Prevented from working Available for work POPULATION
The Swedish government declared in 2005 that unemployment was not only a scourge for the individual, but for the society as a whole. Unemployment is a problem that Sweden still faces today. Long periods of unemployment lower in-dividuals’ self-esteem, and it cause also their knowledge and competencies to diminish over time. Reducing unemployment and increasing the employment ra-tios are not easy tasks. The government’s goal is to decrease open unemploy-ment to four percent and raise regular employunemploy-ment to 80 percent for the popula-tion between the ages of 20 to 64 years. Decreasing unemployment and increas-ing employment are both short-term goals, but in the long run, the goal is to achieve full employment (Regeringen, 2005).
Another important factor is that the problem with unemployment is greater than what the actual open unemployment measures. In the beginning of 1990s, the to-tal supply of labor declined simultaneously as the employment ratios decreased, which is the case when a recession is present in the economy. When a recession is present, it is normal for not only the employment ratio decrease, but also the number of people wanting a job to decline. Even though Sweden’s economy has been characterized by high generally economic growth, the employment ratio has never fully recovered since the downturn in the beginning of 1990s. This im-plies there are still people of working age that are not in the labor force, which means that hidden unemployment exists in addition to open unemployment. Surprisingly, open unemployment did not decrease more than during the 1990s recession, which means that the labor market does not work properly (Bergström, 2004).
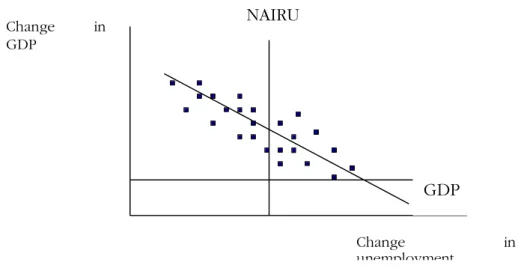
1.8 Okun’s Law
Employed workers contribute to the production output and hence the growth of GDP, whereas unemployed people do not raise GDP. This fact can be used to point out that a decrease in the unemployment level would produce an increase in growth of GDP. This relationship has been studied and formulated by Arthur Okun, a Nobel prize winner from Yale University.
Okun’s law is an empirical estimation of the negative relationship between change in unemployment and real GDP. Professor Okun stated that one percentage change in unemployment would lead to an approximate change in GDP by 2 percent (Lee, 2000).
Figure 2 – Source: (Dornbusch, R. et al. 2004). Okun's Law
The diagram above shows that growth in real GDP will contirbute to deacrease the rate of unemployment.
The price of unemployment is distributed unequally among individuals. One reason for the large distributional disparity may simply be the result of the timing in which different students graduate: those graduating during a recession will have a harder time finding employment than those fortunate enough to have graduated during a boom (Dornbusch, 2004).
The insider-outsier model helps to explain why it is more difficult for new entrants in the labor market to find employment. Workers can be divided into two categories: insiders, current employees, and outsiders, potential employees. The explanation is that firms are not willing to decrease the wage level so new entrants can find eployment because employers, for efficiency reasons, do not want to lower wages. The firm wants to encourage its workers to be productive, not the other way around (Romer, 2001).
Employing new workers is a very costly process and employers consider it more efficient to increase wages than to employ new workers and decrease wages for current workers. For example, if a manager were to hire an outsider, the outsider would need to receive on-the-job training from insiders. This would cause the in-siders to, in essence, receive a lower wage rate (as they’d be doing more work for the same pay) and thereby lose their bargaining power. Thus, the insiders do not want to train the outsiders unless they receive an equal or higher wage rate (Dornbusch, 2004). Change in unemployment Change in GDP NAIRU GDP
2 Development of the Swedish economy
2.1 Historical Background
During the 1950s, Sweden was one of the most wealtiest countries as a result of a long excellent economic growth. In the middle of the 19th century Sweden went through an industrialization. The transformation happened relatively quick. Some of the factors that helped the progress were Sweden’s natural assets, a reasonably high ratio of education, and a healthy environment for companies to work and promote innovations. For most countries, the period after the Second World War (1950-1960) was characterized by considerable good economic growth. The Swedish economy grew faster than ever, but other countries in Europe grew even faster. Sweden’s GDP grew from 3.4-4.8 percent during this period, whereas the other European countries grew at rates that ranged from 3.8 percent to 4.9 percent (Södersten, 2002).
During the 1970s and 1980s, the western part of the world experienced a period of recession, and Sweden experienced a lower growth rate than most other countries. In fact, Sweden saw almost the least growth compared to the other countries. GDP per capita increased by 69 percent in the other European countries, whereas Sweden only experienced a 44% increase. Looking at the relationship between consumption and GDP per capita, one can see that consumption decreased more than GDP per capita. During the 1970s, the GDP per capita in Sweden was ranked among the four highest among all OECD countries. In contrast, Sweden ranked 15 percent below the OECD countries in 1998. During the last three decades, the population growth in Sweden decreased by 20 percent and has been below other industrialized countries by 25-27 percent. Sweden is no longer as rich as it used to be, and most Nordic and European countries are considered to have a higher standard of living (Södersten, 2002).
The Swedish economy today contends with a much greater level of international competition than it did during the 1970s and 1980s. Competition today is global and is not only limited to our traditional trading partners, but has expaned to include other countries as well. It also requires ability for changeover and a greater ability to adapt in the business world. The risk of inflation in the Swedish economy is not as overwhelming as it used to be. The decrease in the level of inflation is not only noticeable in Sweden, but also in many other countries. The main cause of this pattern is related to the change in economic policy that occurred during the 1990s. Thus, inflation can be expected to be lower than during the 70s and 80s. Increased competition and lower rates of inflation have changed the circumstances compared to the 1970s and 1980s. Before, the main concern was the risk of inflation, but today it is the permanent increase in unemployment, which results if the wage formation increases faster than for the foregin competiors. An increased wage level gives immediate effects of decreased employment, whereas before, wage increases caused inflation and, thus, a decrease in competitiveness (Heikensten & Vredin, 1998).
only 50 percent while men’s working ratio was nearly 90 percent. By the 1990s, women’s participation rate had increased to almost 80 percent, while men’s had decreased to 75 percent. The drop in employment for men was caused mainly by a reduction in the employment ratio for men between the ages of 55-64 years. It was also partially due to the greater number of men who began to educate themselves (Södersten, 2002).
In the beginning of the 1970s there was a transformation in the law concerning married couple’s taxation, having changed to an individual taxation with progressive taxation. The new way of taxation made it more profitable for married couples to work (Södersten, 2002).
Employment ratios depend on the business cycle. During years with good economic growth, the demand for labor is higher than in periods that are signified by recession. In the beginning of the 1990s unemployment started to rise significantly for both men and women. It appears, thus, that high unemployment and difficulties in finding work leads to diminished activity in seeking work. This is known as the discouraged worker effect. Women’s appearance in the labor market increased the overall labor participation, but there has not been an increase in the amount of hours worked in the economy. Working hours had decreased from the middle of the 1960s to the beginning of the 1980s. The average amount of hours worked decreased by five hours for both men and women until the 1980s. The years from 1980 and onwards, however, shows a clear rise in working hours (Södersten, 2002).
The development of women’s advance in the labor market can be explained by an increase in the real wage rate, which has increased at a faster pace than men’s wages since 1960. Empirical studies show a positive relationship between labor supply, employment participation, working hours and real wage rate after taxation. Men, on the other hand, are less responsive to differences in the real wage rate and taxes. A third factor is the increase in the public sector, with more jobs in the public sector being performed by females (Södersten, 2002).
2.3 Employment in different sectors
After the post-war period, employment in different sectors was rearranged heavily in Sweden, as well as in many other countries. The number of people employed in agriculture and forestry decreased from 5 percent in 1950 to 3 percent in the 1990s. Simultaneously, employment in the service sector increased prominently. This has been shown in all developed market economies and is driven by technology. In Sweden, the service sector expanded a great deal but it occurred especially in the public sector. The public sector enlarged from 20 percent in the 1960s to nearly 40 percent in the 1980s. During the 1980s the expansion in the public sector stagnated, and during the recession between the years 1990-1993 the number of workers began to decrease. The structure of the private and public sector does not have a significant correlation with the amount of unemployment. Although a large public sector requires a higher tax rate and leaves less room for private consumption, it decreases employment in the private sector. International comparisons have also shown that there is no clear relationship between the public sector and the amount of unemployment (Södersten, 2002).
3 Data analysis and Emperical analysis
This thesis will examine if jobless growth exist in all sectors or only in a particu-lar sector(s), and it will therefore contribute with a more extensive analysis of the labor market condition in Sweden. It will examine how employment in the pub-lic sector and the private sector has changed during the time period between 1976-2003. The public sector is divided into the industry sector and service sec-tor.
A previous study made by the former governor of the Bank of Sweden, Mr. Ur-ban Bäckström, in 1998 says that Sweden have had a good economic growth for the last 15 years, with a low rate of inflation and a rising annual rate of GDP. At the same time, however, the unemployment rate has not decreased at the same pace as the increasing growth rate. This shows that increasing output and a high level of demand is not necessarily followed by a decreasing development of the unemployment level. In a speech by Böckström in 1998 he referred to this phenomenon by saying that: “If an economy is characterized by the combination of high, stable growth and weak employment, this points to the existence of structural problems.” (Bäckström, 1998 page 3).
Although Sweden’s growth has been rather good during the past five years, the country has seen no decrease in unemployment. Growth since 1993 has been characterized by an upswing in output, with unemployment being relatively unaffected. The growth rate in Sweden has been rising since 1993 at an annual rate of roughly 3 percent. This shows that it is neither the poor demand nor a low growth rate that is the main cause for the weak improvement in employment (Bäckström U. 1998). Sweden has not experienced a corresponding reduction of the unemployment despite the good economic growth which has been prevalent in Sweden since the beginning of the 1990’s. Increased unemployment ratios have mainly been seen in sectors that are capital intensive. Thus, a more balanced growth in the different sectors would more likely result in an equal demand for labor within all sectors. Sweden’s labor market started to change decades ago when business activates were leaning more towards an increase in capital intensive sectors, which required less labor (Bäckström, 1998).
Total production has started to recover from the recession in the beginning of the decade, and is now showing an even higher level than the 1990s best. GDP has increased by a faster pace than during the 1970s and 1980s. Production in industries has been the greatest since the 1960s. Although the unemployment level is the lowest level since 1974, an employment gap has prevailed. The cause of jobless growth have been debated by many, there among the United Nations and the International Labour Organisation, which referers to that the source of jobless growth appers to be a rapid transformation mechanism that is driven by technological change and the internationalization that requires a more severe labor market in each country. The stucture of the labor market have changed significanly, which implies that workers have been required to change both work and branch, but even moving to another location can be neccesary. Adjustment to the new market conditions are inconvinient for individuals and therefor not easily applied (Bergström, 2005).
The data in this section is collected from statistics Sweden. Real GDP is obtained in year 2000s prices, and is calculated in billions. Employment is calculated in thousands. The correlation between real GDP and employment/unemployment are calculated by using the CPI-index.
3.1 Comparison of Total employment, employment in the
public sector, the industrial sector, and the service sector
0 500 1000 1500 2000 2500 3000 3500 4000 4500 5000 1976 1978 1980 1982 1984 1986 1988 1990 1992 1994 1996 1998 2000 2002 Year E m pl o y e es ( in th o u sa n d s)
Total Employment (in thousands) Employment, Industry Sector (in thousands)
Employment, Public Sector (in thousands) Employment, Service Sector (in thousands)
Figure 3 - Source: SCB (Statistics Sweden). Figure constructed by author.
Figure 3 gives an overall picture of how the Swedish labor market have developed between 1976 to 2003, it shows the total employment aswell as employment within the different sectors. The total employment shows a steady increase from 1976-1990, which is a raise by 10.3 percent people employed. After this time period the employment ratio starts to drop drasticlly, between 1990 to 1994, employment decreased by 12.86 percent. It takes until 1998 until the total employment starts to recover.
The public sector shows a relative strong growth from 1976 until 1991, the public sectors employment increased by 8.69 percent between theses years. The public sector started to stagnate in the early 1980s, and later in the beginning of 1990s the sectors sized started to diminish due to a recession as well as heavily employment reductions lay ground. The idustrial sector continued to decline during the hole time span, and the number of people employed was reduced by 37.5 percent between 1976-2003. The service sector shows an steady increase in employment through the hole time period of 1976-2003. Compared with the other sectors, the service sector appears to be the only sector that do not show a great drop in the level of employment in the beginning of 1990.
Jobless growth implies an increase in real GDP while the employment ratio simoultaneously decrease. The different sectors will later be compared to real GDP to conclude if jobless growth is present.
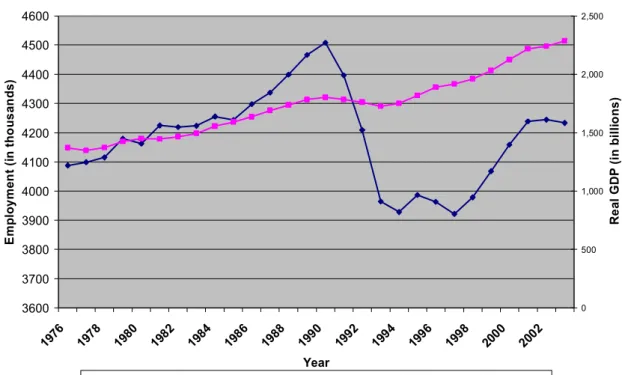
3.2 Comparison of Real GDP and Employment
3600 3700 3800 3900 4000 4100 4200 4300 4400 4500 4600 1976 1978 1980 1982 1984 1986 1988 1990 1992 1994 1996 1998 2000 2002 Year Em p lo y m ent ( in th ou sa nd s) 0 500 1,000 1,500 2,000 2,500 Re al GDP (in b illi o n s )
Employment (in thousands), left scale Total Real GDP (in billions), right scale
Figure 4 - Source: SCB (Statistics Sweden). Figure constructed by author.
Figure 4 shows how GDP and Employment have fluctuated during the years 1976-2003. The Employment ratio increased heavliy during the 1970s and 1980s with the exception of the first years of the 1980s. Between 1990 and 1994, employment decreased by 12.9 percent. The trend of the decreasing employment ratio can be seen as well in the level of GDP. By 1997 both GDP and the number of people employed began to rise again. Between 1997-2001, the employment increased by 8.1 percent. In conclusion, jobless growth is not present since both GDP and employment decreased at the same time.
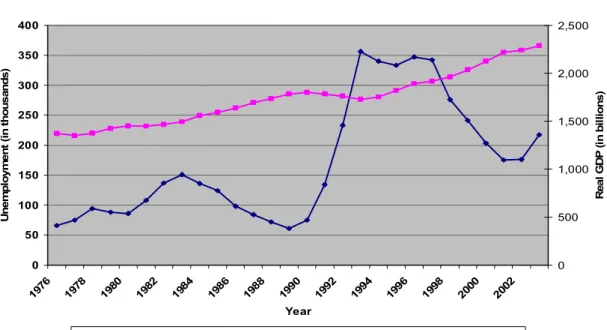
3.3 Comparison of Real GDP and Unemployment
0 50 100 150 200 250 300 350 400 1976 1978 1980 1982 1984 198 6 198 8 199 0 199 2 199 4 199 6 1998 2000 2002 Year U n e m pl oy m e nt ( in t hous ands ) 0 500 1,000 1,500 2,000 2,500 R ea l G D P ( in bi ll io ns )Unemployment (in thousands), left scale Real GDP (in billions), right scale
Figure 5 - Source: SCB (Statistics Sweden). Figure constructed by author.
Figure 5 shows how GDP and unemployment changed during the period from 1976 to 2003. Starting in 1969, the level of unemployment was relatively low and coupled with a fairly good GDP. When glancing over Figure 7, the level of GDP have been less volatile than the level of unemployment. However, for the time period from 1976-1990, the unemployment rate was 2 percent with the exception of the period between 1982-1984, when the unemployment rate was 3 percent. Starting with the year 1990, Sweden had an unemployment rate of 1.6%. As one can observe, this would not be a long lasting rate. By 1992, the Swedish economy started to experience a higher level of unemployment, which was 4.2 percent, and decreased growth. At the end of 1992, GDP started to decrease quickly and the unemployment rate increased to 5%. Furthermore, the Swedish economy started to grow rapidly in 1994 after a few years of economic slowdown, but the economy was also characterized by higher rates of unemployment, around 6 percent throughout the 1990s. The unemployment rate was consistently high even though GDP started to increase over the years 1994-1998. It is this phoneomena that gave rise to the term ‘jobless growth’. For the remaining years from 1999 to 2003, unemployment decreased slightly, but later started to increase as GDP increased.
It is important to observe that the unemployment rate has not been below 2% since 1990. However, GDP has increased to a level of 30%, which is the phe-nomenon of ‘jobless growth’. That is, the output production in the economy is growing but the labor market is below its equilibrium level.
Comparing the unemployment rates from 1970-1980 with the rates after 1992, we see that there have not been any larger differences between the percentage changes in GDP. In 1997, the unemployment rate was 8% and actual GDP was at $247,316 million, while in 1980, the rate of unemployment was just round 2% and real GDP decreased by 0.21 percent.
The government’s goal of reaching an 80% employment rate is relatively far away; by 2005, the employment level reached 76.6 percent, and the open unemployment level was at 5.9 percent, compared to their 4 % goal. (Regeringen. 2005, 30 September.) As explained earlier, these numbers are most likely incor-rect since hidden unemployment is much greater than it appears to be, which generates inaccurate measures of employment.
In the section below I have measured the yearly change in real GDP vs. yearly change in employment/unemployment. I have chosed to divided them in to different time periods to see if the degree of correlation changes after jobless growth starts to be present in the economy. The first time period is between 1976-1993, and the second one is between
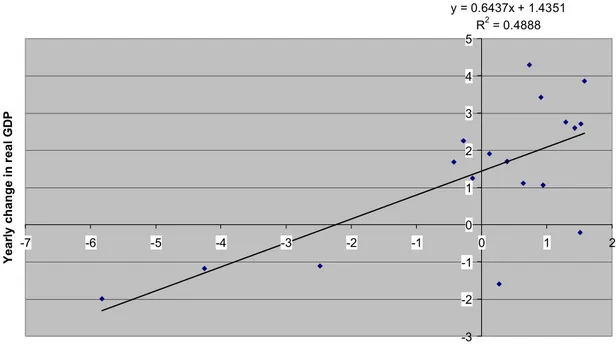
3.4 Correlation between real GDP and employment between
1976-1993
Figure 6 - Source: SCB (Statistics Sweden). Figure constructed by author.
Figure 6 shows the relationship between real GDP and employment between the years 1976-1993. The figure shows a positive relationship between GDP and employment. So when GDP raises then employment will also impove.
y = 0.6437x + 1.4351 R2 = 0.4888 -3 -2 -1 0 1 2 3 4 5 -7 -6 -5 -4 -3 -2 -1 0 1 2
Yearly change in employment
Y ear ly change i n r eal G D P
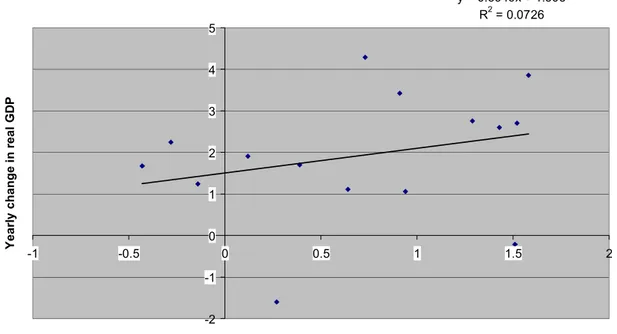
3.5 Correlation between real GDP and employment between
1976-1990
y = 0.5949x + 1.503 R2 = 0.0726 -2 -1 0 1 2 3 4 5 -1 -0.5 0 0.5 1 1.5 2Yearly change in employment
Y ear ly change i n r eal G D P
Figure 7 - Source: SCB (Statistics Sweden). Figure constructed by author.
I ran a second correlation to see if there were any major changes if one would exclude the three variables one the left hand side, since they can be seen as random error terms. By excluding the years 1991, 1992. It still shows a positve relationship, but less strong.
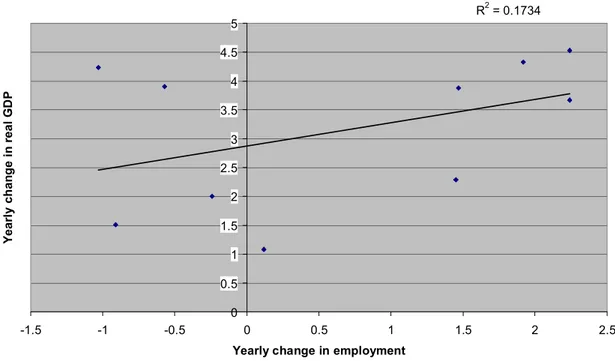
3.6 Correlation between GDP and Employment between
1994-2003
y = 0.404x + 2.8717 R2 = 0.1734 0 0.5 1 1.5 2 2.5 3 3.5 4 4.5 5 -1.5 -1 -0.5 0 0.5 1 1.5 2 2.5Yearly change in employment
Y ear ly chan ge i n r eal G D P
Figure 8 - Source: SCB (Statistics Sweden). Figure constructed by author.
This figure displays the relationship between real GDP and employment involving the years 1994-2003. They show a positive relationship, which implies that when real GDP increases, the level of employment will also increase. The R2 signifies that it is only 17 % of the change in GDP can be explained by the change of employment, which concludes that the relationship is less significant. During this time period, if comparing to the figure 9, then the relationship has weekend, which can be explained by a decreasing level of employment as GDP increase.
3.7 Correlation between GDP and Unemployment between
1976-1993
y = -0.0506x + 2.0211 R2 = 0.6531 -3 -2 -1 0 1 2 3 4 5 -40 -20 0 20 40 60 80 100Yearly change in Unemployment
Y ear ly change i n r eal G D P
Figure 9 - Source: SCB (Statistics Sweden). Figure constructed by author.
Figure 9 shows the correlation between the yearly change in real GDP and un-employment during the time period 1976-1993. This diagram shows a negative relationship between the two variables, indicating that when GDP increase a re-duction should be seen in the rate of unemployment. The R2 of 0.6531 indicates a fairly strong relationship between of the change in GDP the change in unem-ployment. As mentioned above about Okun’s law in the theory section, this states that when the level of GDP goes up then the level of unemployment goes down. So this relationship can be strengthening by theory. Concluding that when GDP grows the unemployment ratios will improve, and hence confirming that the phenomenon of jobless growth have not started to appear.
3.8 Correlation between GDP and Unemployment between
1994-2003
y = -0.0352x + 2.9959 R2 = 0.1158 0 0.5 1 1.5 2 2.5 3 3.5 4 4.5 5 -25 -20 -15 -10 -5 0 5 10 15 20 25 30Yearly change in Unemployment
Y ear ly c h a n ge i n r eal G D P
Figure 10 - Source: SCB (Statistics Sweden). Figure constructed by author.
This figure displays the relationship between real GDP and unemployment from 1994-2003. The regression shows a negative correlation, suggesting that a raise in GDP would bring decline in the rate of unemployment. As can be seen from both the beta value and the R2 the relationship between GDP and unemployment has become weaker. This is most likely caused by that jobless growth is appar-ent.
3.9 Comparison of Real GDP and Emplyoment in the Public
Sector
0 200 400 600 800 1000 1200 1400 1600 1800 1976 1978 1980 1982 1984 1986 1988 1990 1992 1994 1996 1998 2000 2002 Year Em pl o y m e nt i n P ubl ic S ect or ( in th ou s a nd s ) 0 500 1,000 1,500 2,000 2,500 Tot al R eal G D P ( in b il li o ns)Employment, Public Sector (in thousands), left scale Total Real GDP (in billions), right scale
Figure 11 - Source: SCB (Statistics Sweden). Figure constructed by author.
The figure above shows how real GDP and employment in the public sector have varied from 1976 to 2003. In the period from 1976 to 1990, GDP and em-ployment show a direct pattern. After 1990 and onwards, GDP starts to rise as employment decreases. This phenomenon becomes very clear after 1992 and forward, for each year that passes the difference becomes greater. In the 1980s, the public sector started to stagnate and in the early 1990s, employment de-creased due to a recession, also heavy employment reductions within the sector caused the employment ratio to decrease. In conclusion one can say that the phenomenon of jobless growth is present from the early 1990s.
3.10
Comparison of Total Real GDP and Employment in
the Private Sector
0 200 400 600 800 1000 1200 1400 1600 1800 2000 1976 1978 1980 1982 1984 1986 1988 1990 1992 1994 1996 1998 2000 2002 Year Em pl oym e nt i n I ndust ry & S e rv ice ( in thou s a n d s) 0 500 1,000 1,500 2,000 2,500 Tot al R e a l G D P ( in bi ll ions)
Employment, Industry Sector (in thousands), left scale Employment, Service Sector (in thousands), left scale Total Real GDP (in billions), right scale
Figure 12 - Source: SCB (Statistics Sweden). Figure constructed by author.
The above diagram deals with the changes in GDP vs. employees in the private sector between the years 1976-2003. When glancing at the diagram, one can see a positive correlation between the two variables: as GDP increases or decreases, employment in the service sector follows. The employment level in the service sector shows a modest growth between the years 1976-1984, with around 1100 workers. By 1985 the sector starts slowly to expand along with increasing GDP level. After 1992 there is a small decrease in the workforce and also a drop in GDP can be seen, but it only lasted for two years. The following years between 1994 and 2003 shows steady increase in both GDP and employment in the ser-vice sector. The serser-vice sector have been overall been increasing with real GDP, and no signs of jobless growth can be found.
The Industrial sector shows a continuous decrease in employment from 1976-1994, whereas the level of GDP has been increasing. The drop can be explained by the fact that Sweden improved technologically, and less workers were needed to perform the same type of work, which means that the sector is becoming more capital intensive (The Swedish Institute, 2003). Thus, the production proc-ess became more efficient. As a result the level of GDP increases and the level of employment decreases. But a more significant drop can be seen from the 1990-1993, however a drop can also be observe in the level of GDP. The later years shows mostly an increase in both GDP level and employment in the industry, but where the growth in GDP is significantly greater than in the level of employment (The Swedish Institute, 2003).
structural changes in the Swedish economy occurred, where technological im-provements and economies of scale underlies the change.
4 Conclusions
As noted in the introduction, the The UNDP Human Development Report 1994 states that “many parts of the world are witnessing a new phenomenon called jobless growth,” which is the simulataneous increase of real GDP and unemployment. It has been said that Sweden, along with many other countries, is experiencing this phenomenon. This thesis has analyzed the different sectors in the Swedish market to determine whether Sweden experiences jobless growth and, if so, in what sectors the phenomenon can be found.
In the public sector (Figure 11), the data indicated that jobless growth appeard in the beginning of the 1990s. The increased unemployment rates was a result of the 1980s stagnation, economic recession during the 1990s, and major cutbacks of employyes.
The private sector (Figure 12) indicates that jobless growth starts to become visible in the early 1990s in the industrial sector, but the service sector shows no sign of jobless growth. The industry sector shows a downward trend from 1976 and onward, where as the GDP shows a continues increase, which implies that jobless growth have been all along. Around this time period, the Swedish econ-omy started to develop technologically, which made the econecon-omy less dependent on workers. Machinery replaced employees and the production process became more efficient. The service sector has followed the same pattern as GDP during the analyzed time span, and therefore no signs of jobless growth can be seen. In conclusion, jobless growth appears became more noticeable in the beginning of the 1990s, although it can be found in the industry sector from the mid-1970s. An explanation to why it became more apparent in the 1990s in the Swedish economy might be because of the reductions in employment in the public sector. The underlying cause of jobless growth in Sweden can be associated with that the service sector have not expanded fast enough to be able to absorb all the unemployed people that have been laid off from the public sector and the indus-trial sector. The public sector experience large reductions in employment, which was a cause of 1980s stagnation, 1990s recession, and major cutbacks of workers. The industrial sector has become more capital intensive than before, which means that employees have been replace by machinery. As pointed out in sec-tion 1.3 (Exogenous growth theory) and 1.4 (Endogenous growth theory) it is technology that drives growth. Thus, an improved technology will generate growth in real GDP. With advanced technology and more machinery, the growth of GDP will increase at a faster pace than rate of employment, which is evident in the industrial sector. As stated in section 1.8 (okun’s law) the relationship be-tween GDP and unemployment, which points out that growth in GDP will de-crease the level of unemployment. This can be seen in the service sector, which has increased/decreased with GDP.
As indicated by figure 6 (1976-1993) and figure 7 (1994-2003), which illustrates the change in GDP and change in unemployment between 1976-2003. Figure 6 shows a relative stronger positive correlation whereas figure 7 demonstrates a weaker, but positive correlation. It can be explained by that jobless growth starts
to be is apparent in the second period, since figure 7 indicates that when GDP increases, employment rations will increase less than before. Figures 8 and 9 shows that the change in GDP and unemployment have a negative relationship, so when GDP increase, reductions in the rate of unemployment can be seen. Where figure 8 displays a stronger relationship, and where figure 9 shows that less reductions in unemployment will take place when GDP increases. Figure 8 draws the same conclusion as Okun’s law.
As mentioned above by the former governor Urban Bäckström, that an economy appears to suffer from structural problems if the economy undergoes steady growth and weak ratios of employment combined. Appears to contradict with findings in this thesis, where the reason to why employment ratios do not follow GDPs path, seem to be explained by that the service sector do not have the ca-pacity to absorb the unemployment resulting from the public sector and the in-dustry sector.
4.1 Further Research
Interesting areas for further research:
• Political aspects related with jobless growth.
• What would happen to the Swedish social welfare if the population would choose to work less?
• Why are we striving to work as much as possible when our average salary is less than in other countries?
5 References
Literature
Anthuvan, V.L. (2005) Jobless Growth and Unemployment: A Global Phenomenon. World Affairs. Volume 9, Number 1 (January-March 2005).
Caballero, R.J. (1997) Jobless Growth: Appropriability, Factor Substitution and Unemployment. Working Paper 6221. Cambridge MA; National Bureau of Economic Research.
Dornbusch, R., et al. (2004) (9 Ed.). Macroeconomics. New York, NY; McGraw-Hill Irwin.
Edvinsson, R. (2005) Growth, Accumulation, Crisis. With new macroeconomic data for Sweden 1800-2000. Stockholm; Almqvist & Wiksell International. Lee, J. (2000) The Robustness of Okun’s Law: Evidence from OECD Countries.
Journal of Macroeconomics. Volume 22, Number 2, pp.331-356. (Spring 2000)
Schön, L. (2000). En modern svensk ekonomisk historia – Tillväxt och omvandling under två sekel. Borås; SNS Förlag.
Statistiska centralbyrån (1960-2005). Statistisk Årsbok för Sverige. Stockholm; Publikationstjänsten
Statistiska centralbyrån. (1984). Arbetsmarknaden 1970-1983; Arbetsmarknadsstatistisk årsbok 1984. Stockholm; SCB Förlag
Statistiska centralbyrån. (1978). Arbetsmarknadsstatistisk årsbok 1977. Stockholm; SCB Förlag.
Statistiska centralbyrån. (1989). Arbetsmarknaden i siffror – Sysselsättning, Arbetslöshet, m.m. Stockholm; SCB Förlag.
Romer, D. (2001) (2 Ed.). Advanced Macroeconomics. New York, NY; McGraw-Hill Irwin.
Södersten, B (red.). (2002) (5 Ed.) Marknad och Politik. Stockholm; SNS Förlag. Tobin, J. (1996) Full employment and growth. Cheltenham; Edward Elgar
Publishing, Inc. Internet Sources
BBC News. (2005, 23 September.) Europe’s jobless millions. Retrieved 2005-09-23 from http://news.bbc.co.uk/1/hi/world/europe/687918.stm
Bergström, V. (2004, 4 November.) Rår Riksbanken för arbetslösheten? Retrieved 2005-09 25 from http://www.riksbank.com
Bäckström, U. (1998, 13 November.) The current situation for monetary policy in Sweden. Retrieved 2005-09-22 from http://www.riksbank.com
Heikensten, L. & Vredin, A. (1998, n.d.) Swedish monetary policy – experience and problems. Retrieved 2006-06-27 from http://www.riksbank.com
Regeringen. (2005, 13 April.) Sysselsättningspaketet. Retrived 2005-12-19 from http://www.regeringen.se
Regeringen. (2005, 30 September.) Mål för den ekonomiska politiken. Retrieved 2006-03-02 from http://www.regeringen.se
Statistiska centralbyrån. (2005, 21 November) Sysselsättning och arbetslöshet 1976-2004. Reterived 2006-06-27 from http://www.scb.se
Sveriges Riksbank. (2000, March.) The labour market and resource utilisation. Re-trieved 2005-11-25 from http://www.riksbank.com
The Swedish Institute. (2004, 25 August.) Service Sector in Sweden. Retrieved 2006-03-03 from http://www.sweden.se/
The Swedish Institute. (2003, 23 August.) Swedish Industry. Retrieved 2006-03-03 from http://www.sweden.se/
Wikipedia, the free encyclopedia.(n.d.) Reterived 2006-06-13 from