POSSIBILITES FOR OPTIMIZATION OF
THE DRY DIGESTION PROCESS
Eva Thorin, Eva Nordlander, Johan Lindmark, Sebastian
Schwede, Tim Freidank, Vygintas Daukšys, Silvia
Drescher-Hartung, Thorsten Ahrens
September 2014
Report no: O4.6
Disclaimer
This publication has been produced with the assistance of the European Union (in electronic version provide link to http://europa.eu). The content of this publication is the sole responsibility of authors and can in no way be taken to reflect the views of the European Union.
Index
INDEX ... 2
1. INTRODUCTION ... 3
1.1LITHUANIAN PILOT RUNS ... 3
1.2ESTONIAN PILOT RUNS ... 3
1.3SWEDISH PILOT RUNS ... 3
2. PARAMETERS POSSIBLE TO OPTIMISE ... 4
2.1ORGANIC LOADING RATE ... 4
2.2SUBSTRATE MIXTURE AND PRE-TREATMENT ... 4
2.3TS CONTENT ... 4
2.4ENERGY USE ... 5
3. TECHNICAL OPTIMIZATION ... 5
3.1CONTROL UNIT AND DATA MANAGEMENT ... 5
3.2FEEDING DEVICE ... 5
3.3GAS UTILIZATION ... 5
4. MODELLING AND SIMULATION ... 6
4.1LITERATURE STUDY ... 6
4.1.1 Existing application of ADM1 on dry digestion ... 6
4.1.2 How to consider influence of solid particles on dry digestion ... 7
4.1.3 Hydraulics ... 8
4.1.4 Other references of interest ... 10
4.1.5 Literature study conclusions ... 10
4.2MODELLING PILOT B ... 10
4.2.1 Energy model ... 11
4.3SIMULATIONS ... 11
1. Introduction
In the ABOWE project a dry digestion pilot plant has been tested at three different locations in the Baltic Sea area, in Lithuania, Estonia and Sweden. The aim of the pilot runs in the two first countries was to spread knowledge about the biogas technology and test different organic waste material as substrate for the process. In Sweden there is already a high
knowledge about biogas production, instead the dry digestion pilot process can provide more knowledge about possibilities to utilise more complex waste substrates with the aim to increase biogas production from waste resources.
In this report the possibilities to optimise the performance of a dry digestion biogas plant will be discussed based on the results and experiences from the pilot runs as well as based on knowledge on modelling and simulation of biogas processes.
1.1 Lithuanian pilot runs
In Lithuania three different substrate cases were tested during the pilot plant runs: co-digestion of cow manure and bioethanol distillery waste, co-co-digestion of cow manure, food waste and algae, digestion of cow manure. The plant was operated at mesophilic conditions (42°C). The biogas production in the pilot plant reached similar values as the possible production calculated from the biogas production results from batch tests on the different substrate mixtures used.
1.2 Estonian pilot runs
In Estonia cow manure was used as the substrate. Small amounts of corn silage was also co-digested with the cow manure for a shorter period of time of the pilot runs in Estonia. The plant was run under thermophilic conditions (55°C). No batch tests were made for the substrate used in Estonia.
1.3 Swedish pilot runs
The substrate used in the pilot runs in Sweden was the residual fraction of municipal solid waste (MSW) after source sorting of biowaste. The plant was run under thermophilic
conditions (55°C). Batch tests in both mesophilic and themophilic conditions were done. The duplicate batch tests showed a big difference in biogas production, one giving higher
methane production than the pilot plant and the other giving lower biogas production than the pilot plant. This might be a result of large variations in the substrate composition. In parallel also a garage fermentation pilot plant was tested with the same substrate, though with the difference that no sorting of the substrate was done. In the plug flow pilot plant about 10-25 % of the waste material was removed before feeding the pilot. The garage fermentation plant showed a biogas production per fed material that was about 70 % of the production in the plug flow pilot.
2. Parameters possible to optimise
2.1 Organic loading rate
The good agreement between the measured biogas production in the plant while operated in Lithuania and the calculated biogas production from the batch tests on the substrate
mixtures used in the Lithuanian case shows that the pilot process design can provide process conditions for optimal utilisation of the biogas potential of those substrates.
The measurements of volatile organic acid and total anorganic carbonate ratio (VOA/TAC), which is an indicator for the fermentation performance, showed low values indicating that a higher feeding rate, giving a higher organic loading rate, should have been possible. By increasing the feeding rate the capacity of the plant is better utilised improving the biogas output per reactor volume. The pilot runs in Lithuania shows a potential for optimisation of the organic loading rate for the substrates used in the Lithuanian cases.
In the Swedish pilot runs the organic loading rate was increased from about 1.5 to 4.0 kg VS/m³*day during the operation time. The VOA/TAC values and content of organic acids in the produced digestate also increased. Still, no reduction in the biogas production from the plant could be observed, indicating that further optimisation of the organic loading rate might be possible.
2.2 Substrate mixture and pre-treatment
The residual fraction of municipal solid waste (MSW) after source sorting of biowaste used as substrate in the Swedish pilot runs was crushed and partly sorted before feeding into the pilot plant. The properties of the substrate also showed large variations which indicates that this pre-treatment is necessary for optimising the process. Un-digested material can also form sediment that build up in the reactor and those decrease the reactor volume. Pre-treatment can therefore also be a way for optimising the process from an optimal reactor volume use point of view.
2.3 TS content
The TS content of the substrate has an impact on the practical operation of the dry digestion plant and the possibilities to feed the substrate through the reactor. A higher TS content makes it possible to utilize the reactor volume in a more optimal way since more degradable substrate per reactor volume is then possible. However, there are also studies indicating that too high TS contents can cause inhibition of the digestion process and that lower TS values give higher biogas production (Koch et al., 2010; Motte et al., 2013).
Motte et al., 2013 identifies three different parameters that are of importance for dry
digestion: TS content, ratio of substrate to inoculum (S/X) and particle size. Furthermore the authors try to explore how these factors affect the operations of dry digestion. Motte et al. (2013) conclude that S/X is most important during the start-up of solid-state digestion. TS become the most important factor after the start-up; lower levels of TS gave higher biogas
production. However there was also a connection between TS and the size of the particles. Large particles size was favourable for high levels of TS.
In the Estonian piloting case the substrate used had a low dry matter content. For better utilization of the reactor volume dewatering of the substrate prior to the digestion could be an option. Another possibility would also be to use a wet digestion tank process instead of the plug-flow dry process.
2.4 Energy use
Another potential parameter that can be optimized in the process is the energy used in the plant for stirring, pumping and heating. This has not been considered in the piloting.
Also substrate pre-treatment and digestate treatment after the digestion process influence the overall energy use of the plant and can be important to consider for overall energy optimization of the pant.
3. Technical optimization
As there have been no mayor technical difficulties during the project, no big issues
concerning technical optimization can be given. But minor improvements would lead to a more satisfying operation. They will be mentioned in the following chapter.
3.1 Control unit and data management
The control system consisting of a LabVIEW based program could be improved regarding more online control. Meaning that parameters for stirrers, temperatures and so on could be changed during the normal operation without restarting the test. At the moment any change must be confirmed and data recording starts with a new file.
Also a little bug fixing regarding the recording of non-sense data should be done. This would make the evaluation of the data much quicker and easier.
3.2 Feeding device
The feeding device installed at the moment is not able to give a constant feeding flow. The material forms blockages in the funnel that stops the material from reaching the screw conveyor.
A constant feeding would allow even better simulation of full scale plants.
3.3 Gas utilization
During the project the biogas has been stored in 2-3 gas bags with a volume of approx. 500 liters each. An external biogas storage would be easier to handle. The bags had to be pumped empty almost every day, depending on the production rate.
In the project the gas has been utilized by burning with a two-flame gas cooker. A small CHP unit could be substituting a small amount of external energy and work in a 24h mode when attached to a larger gas collecting system.
3.4 Improvement of operators comfort
A water supply consisting of a small hand wash basin and an additional water tap could be installed inside the container. It would allow the cleaning of lab material as well as the hands of the operator. The water tap could be used to flush the fermenter or to clean the floor.
4. Modelling and simulation
To be able to control and optimise the biogas process in the design of the process or at process changes, as for example changes of substrate type or amount, a model of the process and simulation of the process outcomes can be a valuable tool.
4.1 Literature study
To investigate what work already had been done on modelling of dry digestion plug-flow digesters a short literature study on modelling and simulation of dry digestion was conducted with focus on the Anaerobic Digestion Model No. 1 (ADM1). The ADM1 is a model created by the International Water Association (IWA) Task Group for Mathematical Modelling of Anaerobic Digestion Processes and was first published in 2002 (Batstone et al., 2002). It is within the anaerobic digestion field the most well-known and used model and therefore a good starting point for a simulation study.
4.1.1 Existing application of ADM1 on dry digestion
Bollon et al. (2011) describe the modifications made to the ADM1 in order to adapt it to anaerobic dry digestion processes. The focus is on the biological steps and they assume complete mixing, so nothing new is added in regards of hydraulics of dry digestion. The system they validate against is a batch system. The modifications consist of a number of simplifications. The disintegration, hydrolysis and acidogenesis step is made into a single step which they choose to call DHA and model using first-order kinetics. It is assumed that microbial mass is constant within the digester and biochemical substrate is therefore only dependent on substrate concentration. In the model a volumetric unit is not used instead concentrations are expressed based on wet mass basis. The concentrations units are then not kgCODm-3 but gCODkg-1. The simplifications make it easier to calibrate each parameter
(since they are fewer). The model was tested using data from batch experiments and the results showed a good fit. In addition Bollon et al. (2011) investigated the effects of moisture content (MC). Four different MC-levels were tested: 82%, 80%, 75% and 65%. The authors found that the MC had impact on the kinetic parameters of the model. The half saturation value for acetate (Ksac) was found to have a linear relationship with MC (with the exception of an MC of 65%). According to Bollon et al. (2011) this is typical of systems with diffusion-limited kinetics, such as biofilm systems. They found similar linear relationships for some of the other kinetic parameters. The authors state that within the 75-82% MC range there are few biological or kinetic disadvantages but the effects on the degradation is high for lower MC.
Koch et al. (2010) models the digestion of grass silage using the ADM1, the TS content of the digester varies between about 10% to 16%. The process is therefore on the verge of dry digestion. Koch et al. (2010) state that high solid content in the digester can inhibit the AD
process. Koch et al. (2010) therefore choose to include an equation (Eq.1) in the ADM1 to take into account the effect of solids on the hydrolysis rate. Equation 1 replaces the standard rate equations for proteins, carbohydrates and lipids. In Eq.1 𝜌𝑗 is the kinetic rate (kg CODm -3d-1), 𝑘
ℎ𝑦𝑑 is hydrolysis rate (d-1), X is the concentration of the particulate matter
(carbohydrates, proteins or lipids) (kgCODm-3), TS is the concentration of solids (kgTSkgFM-1),
𝐾ℎ𝑦𝑑is the hydrolysis influence coefficient (kgTSkgFM-1) and 𝑛ℎ𝑦𝑑is the corresponding degree
index (Koch et al., 2010). 𝜌𝑗= 𝑘ℎ𝑦𝑑𝑋 1
1+( 𝑇𝑆
𝐾ℎ𝑦𝑑)
𝑛ℎ𝑦𝑑 (1)
The standard rate equations found in ADM1 can be found below (Eq.2) (Batstone et al., 2002)
𝜌𝑗= 𝑘ℎ𝑦𝑑𝑋 (2)
The results of the model were compared with the results of an experimental run using two loop reactors with a volume of 50l each. Koch et al. (2010) use Weender analysis (for more information about the method see references given in Koch et al. (2010)) to characterize the substrate into raw proteins, raw fat, raw fibre, nitrogen free extracts, neutral detergent fibre, acid detergent fibre and acid detergent lignin. The different analysis fractions is multiplied with each calculated theoretical oxygen demand (ThOD) and the sum of all is then put into the composite material (XC) state variable of the model. The fraction f-factors (how much
protein, carbohydrates and so on the Xc disintegrates into) are also adjusted according to the Weender analysis results.
4.1.2 How to consider influence of solid particles on dry digestion
In the two examples given of application of ADM1 to dry digestion the first example did not do any special considerations when it came to solid particles and the second did. In the original ADM1 model no special considerations are made for solid particles, so the question is, is it something that should be included when modelling dry digestion?
Vavilin et al. (2008) gives an overview of the kinetics of hydrolysis of particulate organic matter. The authors state that first-order kinetics can be insufficient to model the hydrolysis of complex substrates. It is important to also take it to consider the part of the substrate that is hard to biodegrade. It can be achieved either by adding a term for it in the first-order kinetics equation or by using other types of kinetics. Vavilin et al. (2008) suggest two improved models for the hydrolysis kinetics, Contois kinetics and the two-phased kinetics. The first considers growth of biomass and the second hydrolysis as consisting of two phases. The two main phases of hydrolysis kinetics is first bacteria colonization and then
degradation. In the first phase the bacteria cover the surface of the solid. The bacteria, either on or near the surface, produce enzymes while releasing monomers. The daughter cells of the bacteria fall of the solid surface and try to attach themselves to another surface place. In the second phase the bacteria has covered all available surface and then degrade the surface at a constant depth per time (Vavilin et al., 2004). The two phase model (also called the surface-related model) is described by Eq.(3). 𝑋 is the volatile solids concentrations, 𝐵𝐻 is the concentration of hydrolytic biomass, 𝐾𝐵 is the equilibrium constant equal to the ratio
𝜌𝐻 = 𝜌̂𝑚𝐾𝐵𝐻
𝐵+𝐵𝐻
𝑋
𝐾𝑋+𝑋 (3)
The Contois is similar to this model and is according to Vavilin et al. (2004) equally good at fitting the data as the surface-related model. The Contois kinetics is described by Eq.(4). 𝜌𝑚𝐻= is the maximum specific hydrolysis rate and 𝐾̂𝑋 is the half-saturation coefficient for the
ratio 𝑋/𝐵𝐻.
𝜌𝐻 = 𝜌𝑚𝐻𝐵𝐻𝐾̂𝑋/𝐵𝐻
𝑋+𝑋/𝐵𝐻 (4)
Esposito et al. (2011) models the co-digestion of sewage sludge and the organic fraction of municipal waste (OFMSW) using a modified version of ADM1. The disintegration step for the sewage sludge is the same as in the ADM1 but for the OFMSW the particle size is taken in into account.
Martin (2003) discusses concepts of hydrolysis in solid-state digestion. According to Martin (2003) for the AD of small particles in a slurry or a suspension the main reaction zones will be the liquid phase and the surface of the solids. However for a bed of solid organic it is likely that there is also a reaction within the solids. In the ‘reaction front’ model there is the concept of the ideal seed particle (ISP) in which the methanogens in the middle are protected from excessive acidity by a buffer layer. Outside the buffer layer lays a thin layer where the hydrolysis, acidogenesis and acetogenesis take place (Martin, 2000). The surface then expands and the ‘reaction front’ moves on. Martin (2003) emphasizes the importance of viable seed bodies, from which the reactions can start. The author states that in a landfill both the reaction-front mechanism and liquid-phase digestion can co-exist. The dominant reaction mechanisms depend on the initial conditions.
4.1.3 Hydraulics
One of the obstacles to using ADM1 for dry digestion is that the mixing will not be the same as in a continuous-flow stirred-tank reactor (CSTR). The implementation example given in (Batstone et al., 2002) is for a CSTR and it is stated that solid phase digestion would need a different hydraulic model.
If the examples of dry digestion given earlier are studied there are three different cases of hydraulics that can be observed: Plug-flow (the plug-flow reactors), leach bed (leach bed reactors and batch reactors) and the UASB reactor. The main focus here will be on plug-flow hydraulics.
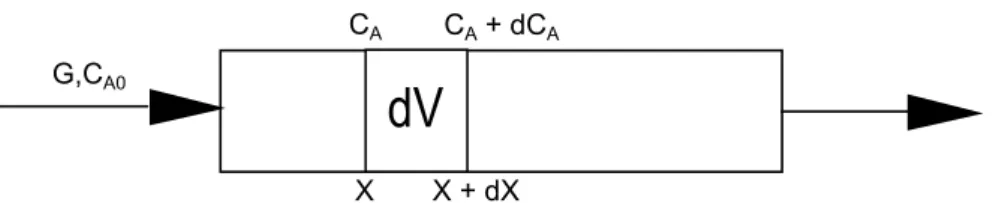
If the plug-flow reactor is considered, the basics of the plug-flow are that that there is exchange of material or mixing in the radial direction but not in the axial direction. If we consider a volume element in the plug-flow reactor, see Figure 1, then that volume element will be perfectly mixed. (Simonsson, 1988)
Figure 1The plug-flow reactor, G is the volume flow (m3s-1), CA, the is the concentration of the substrate A (kmolm-3), CA0 is the initial concentration of substrate A (kmolm-3), X is the distance to the volume element (m). Adapted from Simonsson (1988)
The balance of substrate A in the reactor is: 𝐼𝑛 + 𝑃𝑟𝑜𝑑𝑢𝑐𝑡𝑖𝑜𝑛 = 𝑂𝑢𝑡 + 𝐴𝑐𝑢𝑚𝑢𝑙𝑎𝑡𝑒𝑑 (5)
For the steady state plug-flow reactor for the volume element this becomes: 𝐺𝐶𝐴+ 𝑟𝐴𝑑𝑉 = 𝐺(𝐶𝐴+ 𝑑𝐶𝐴) + 0 (6)
Which also can be expressed as:
𝑉 𝐺= ∫ 𝑑𝐶𝐴 𝑟𝐴 𝐶𝐴 𝐶𝐴0 (7)
Eq. (5)-(7) can be found in (Simonsson, 1988). If varying volume flow is also included or dynamic state the complexity of the equation increases. It is also possible to model the plug-flow digester as a series of stirred tank reactors (STR). The more reactors in the series the closer it will be to the plug-flow. Batstone et al. (2005) examines the hydraulics of UASB reactor using modelling it either using STRs in series or plug-flow hydraulics. The goal of the study is not to compare STR vs. plug-flow but looking at the result it is still possible to see that the result using 8 STRs in series is very similar to that of using plug-flow hydraulics. It is important before choosing a hydraulic model to know what kind of hydraulics is to be
expected. A reactor designed for plug-flow might not have plug-flow hydraulics, for example, see Koch et al. (2013).
The UASB reactor will not be discussed so much in this report. A review of modelling of biofilm systems can be found in Saravanan and Sreekrishnan (2006). In short, according to Saravanan and Sreekrishnan (2006), to apply ADM1 to UASB reactors, the substrate
utilization kinetics should be replaced with a biofilm model and the hydraulics should also be changed. Saravanan and Sreekrishnan (2006) recommend using a combination of CSTRs and a plug flow system.
For a batch reactor the system and the problems should in some ways be similar to the biofilm system described by Saravanan and Sreekrishnan (2006), that the reactions are limited by diffusion. Saravanan and Sreekrishnan (2006) explains that in ADM1 there are no mass transfer limitations for movement of the substrate from the liquid phase to the cells. While in biofilms the transportation rates is controlled by diffusion, as the substrate from the bulk liquid diffuses within the biofilm. In a batch system it could be expected that there is a similar system. There is a “pile” of solids in which the leachate liquid with the biomass will diffuse. So for a batch reactor it could be possible to either look at how the mass-transfer is described for biofilm model, see for example Saravanan & Sreekrishnan (2006) or Pontes and Pinto (2006) or look at the reaction front model given by (Martin, 2003).
4.1.4 Other references of interest
García-Bernet et al. (2011) have conducted a study on water distribution in biowastes and digestate from dry digestion reactors. The authors look at free water and bound water and it might not be directly applicable in a dry digestion model but it might be of interest.
4.1.5 Literature study conclusions
There are several considerations to be made when modelling the anaerobic dry digestion system. There are a few applications of ADM1 already on dry digestion systems. One of the studies found simplifies ADM1 before using it on dry digestion, in order to simplify the parameter estimation. Another study includes a term to include the effect of high solid contents on the hydrolysis and also uses Weender analysis for the characterization of the substrate. Dry digestion can be expected to include a lot of particulate matter. One way to address this is to use Contois kinetics or use a special term to take into account particle size. TS, substrate to inoculum ration (S/X) and particle size influence the dry digestion. One study found that after start-up TS has the greatest (sole) impact on the process. It could be seen to support the use of a term for TS inhibition on the hydrolysis. Furthermore also according to the results, large particles were favourable for high levels of TS. If the particle size is included in a model care should be taken how this will influence the degradation, if particle size is only considered negative the possible positive effects of large particles at high TS is not taken into account. The hydraulics of the dry digestion could also be considered. What kind of hydraulics should be used depend on what kind of dry digestion system is in focus. A plug-flow system could either be modelled by plug-flow hydraulics or using STRs in series. For batch system other types of hydraulics should be considered.
4.2 Modelling pilot B
It is not known whether the flow in pilot B will be a plug-flow or not. To know that a study of the flows would need to be conducted. There are valves on the sides of the digester but they are too small in relationship to the material. It would not be possible to take out material through them, otherwise samples could have been taken out to examine the degradation pattern within the digester. However, the aim is that the digester should be a plug-flow digester and also that a full-sized digester should be operating under plug-flow conditions. Therefore the initial assumption will be that the flow is plug-flow. The ADM1 can be used and the plug-flow can be modelled by putting STRs in series.
One of the challenges with using ADM1 is how the substrate should be characterized. In the differential and algebraic equation implementation there are 26 possible input parameters (Batstone et al., 2002). It is possible to use all of these input parameters but most authors focus only on the ones that are deemed significant for their substrate. In the case of the substrate used in Swedish pilot runs no other study has been found using that substrate. But there are studies on using the organic fraction of municipal solid waste. Many authors seemed to put great weight on the carbohydrates, proteins and lipids content of the material. These are either measured directly (Sun et al., 2013) or calculated using other analysis (Yu et al., 2012; Zaher et al., 2009) or by using both measurements and calculations (Espositio et al., 2012).
The base unit for ADM1 is Chemical Oxygen Demand (COD) which can be challenging when looking at anaerobic digestion outside of wastewater treatment plants (which have a long tradition of measuring the COD). Koch et al., (2010) discusses this challenge when modelling the digestion of grass silage and suggest calculating the COD using the Theoretical Oxygen Demand (ThOD) of the substrate components (carbohydrates, proteins, lipids and inert in that case). To avoid having to use COD another alternative is to use a correlation between volatile solids (VS) and COD (Lübken et al., 2007) (but then that correlation needs to be found for the particular scenario).
Many type of substrates used in dry digestion, as for example the one used in the Swedish piloting, are challenging substrates to try to characterize but the characterization might be possible to simplify. It is suggested that it can be assumed that the majority of the COD of the material will be in the particulate fraction and that the material can be characterized mainly in terms of proteins, fat, carbohydrates and inert material. To characterize the following analysis is suggested:
COD-Cr Dry matter
Organic dry matter Kjeldahl Nitrogen
Kjeldahl Ammonium Nitrogen
From this analysis the proteins and carbohydrates could also be calculated.
4.2.1 Energy model
The basic model only includes the anaerobic process of the digester. However for the investigation of a full-scale plant it would also be of interest to include the energy balance. Lübken et al. (2007) includes in their study energy balances in their model. They model the dynamic energy balance as:
𝑑𝑃𝑛𝑒𝑡
𝑑𝑡 = (𝑃𝑒𝑙𝑒𝑐𝑡𝑝𝑟𝑜𝑑− 𝑃𝑝𝑢𝑚𝑝𝑙𝑜𝑠𝑠 − 𝑃𝑠𝑡𝑖𝑟𝑙𝑜𝑠𝑠) + (𝑃𝑡ℎ𝑒𝑟𝑚𝑝𝑟𝑜𝑑 − 𝑃𝑟𝑎𝑑𝑙𝑜𝑠𝑠− 𝑃𝑠𝑢𝑏_ℎ𝑒𝑎𝑡𝑙𝑜𝑠𝑠 + 𝑃𝑚𝑖𝑐_ℎ𝑒𝑎𝑡𝑝𝑟𝑜𝑑 )
Where 𝑃𝑛𝑒𝑡 is the net energy production of the digester, 𝑃𝑒𝑙𝑒𝑐𝑡𝑝𝑟𝑜𝑑is the produced electrical energy and 𝑃𝑡ℎ𝑒𝑟𝑚𝑝𝑟𝑜𝑑is produced thermal energy production. 𝑃𝑝𝑢𝑚𝑝𝑙𝑜𝑠𝑠 is the power loss due to
pump, 𝑃𝑠𝑡𝑖𝑟𝑙𝑜𝑠𝑠 is the power loss due to the stirring, 𝑃
𝑠𝑢𝑏_ℎ𝑒𝑎𝑡𝑙𝑜𝑠𝑠 is power loss due to substrate
heating and 𝑃𝑚𝑖𝑐_ℎ𝑒𝑎𝑡𝑝𝑟𝑜𝑑 is heat gained due to microbial activity (Lübken et al. ,2007).
The authors also suggest equations for each component of the balance. This balance and the equations would need to be adapted for use in the ABOWE-scenario, for example we might not produce heat and electricity from the biogas but rather upgrade it for use as vehicle fuel. In addition the process layout with stirring and pumping system might look different. But the basic concept is still applicable.
4.3 Simulations
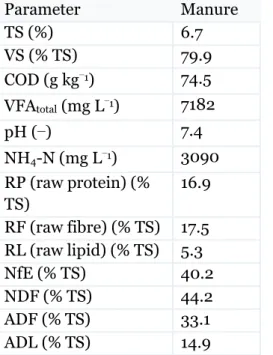
Table 1 Results of manure analysis presented in Lübken et al. (2007) Parameter Manure TS (%) 6.7 VS (% TS) 79.9 COD (g kg−1) 74.5 VFAtotal (mg L−1) 7182 pH (−) 7.4 NH4-N (mg L−1) 3090 RP (raw protein) (% TS) 16.9 RF (raw fibre) (% TS) 17.5 RL (raw lipid) (% TS) 5.3 NfE (% TS) 40.2 NDF (% TS) 44.2 ADF (% TS) 33.1 ADL (% TS) 14.9
The authors uses the ADM1 inputs Xch (carbohydrates), Xpr (proteins), Xli (lipids), Xi (particulate inerts) as well as Xbacteria (in the ADM1 it is called by other names but is the biomass that is used for uptake/degradation of sugars, amino acids, long-chain fatty acids, valerate, propionate and butyrate) and Xmethanogens (which is the biomass that is used for uptake/degradation of acetate and hydrogen).
𝑋𝑝𝑟 = 𝑄𝑖𝑛∗ 𝑅𝑃 ∗ 𝑇𝑆 ∗ 𝑖𝐶𝑂𝐷/𝑉𝑆 [1] 𝑋𝑙𝑖 = 𝑄𝑖𝑛∗ 𝑅𝐿 ∗ 𝑇𝑆 ∗ 𝑖𝐶𝑂𝐷/𝑉𝑆 [2] 𝑋𝑐ℎ= 𝑄𝑖𝑛 [𝑅𝐹 + 𝑁𝑓𝑒 − 𝐴𝐷𝐿 − (𝐴𝐷𝐹 − 𝐴𝐷𝐿)𝑛𝑜𝑡 𝑑𝑒𝑔𝑟𝑒𝑑𝑎𝑏𝑙𝑒] ∗ 𝑇𝑆 ∗ 𝑖𝐶𝑂𝐷/𝑉𝑆 [3] 𝑋𝑖 = 𝑄𝑖𝑛 [𝐴𝐷𝐿 + (𝐴𝐷𝐹 − 𝐴𝐷𝐿)𝑛𝑜𝑡 𝑑𝑒𝑔𝑟𝑒𝑑𝑎𝑏𝑙𝑒] ∗ 𝑇𝑆 ∗ 𝑖𝐶𝑂𝐷/𝑉𝑆 [4] 𝑋𝑏𝑖𝑜𝑚𝑎𝑠𝑠 = 𝑄𝑖𝑛∗ 𝑁𝑐𝑒𝑙𝑙∗ 𝑓𝑏𝑎𝑐∗ 𝑚𝑐𝑒𝑙𝑙∗ 𝑖𝐶𝑂𝐷/𝑋𝑏𝑎𝑐∗ 10−3 [5] 𝑋𝑚𝑒𝑡ℎ𝑎𝑛𝑜𝑔𝑒𝑛𝑠 = 𝑄𝑖𝑛∗ 𝑁𝑐𝑒𝑙𝑙∗ 𝑓𝑚𝑒𝑡ℎ𝑎𝑛𝑜𝑔𝑒𝑛𝑠∗ 𝑚𝑐𝑒𝑙𝑙∗ 𝑖𝐶𝑂𝐷/𝑋𝑏𝑎𝑐∗ 10−3 [6]
Qin is the flow of material into the digester, iCOD/VS is a conversion factor between COD and VS
used in Lübken et al. (2007). RP (raw proteins), RL (raw lipids), RF (raw fibre), Nfe (N-free extract), ADL (acid detergent lignin), ADF(acid detergent fibre) are all analysis made in Lübken et al. (2007). ADF- ADL is the cellulose and (ADF-ADL)not degradable is the part of the
cellulose that is not degradable. In Lübken et al. (2007) it was found to be 28%. Ncell is the
cells, fmethanogens is the fraction of methanogens in relationship to total cells, mcell is the weight
of one bacteria cell and iCOD/Xbac is the conversion factor between biomass weight and COD.
The model was implemented in Matlab/Simulink (version R2014a), the structure of the model can be seen in Figure 2
Figure 2 Structure of digester model
If the digester model can be validated against the experimental data then simulations can be made of a full-scale plant. With addition of the energy model it would be possible to simulate different scenarios regarding seasonal variations of temperature and sizes of the digester.
5. References
Batstone, D.J., Hernandez, L.A., and Schmidt J.E. 2005. Hydraulics of Laboratory and Full-Scale Upflow Anaerobic Sludge Blanket (UASB) Reactors. Biotechnology and
Bioengineering, 91(3), pp. 387-391.
Batstone, D.J., Keller, J., Angelidaki, I., Kalyuzhnyi, S.V., Rozzi, A., Sanders, W.T.M., Siegrist, H., Vavilin, V.A. 2002. Anaerobic Digestion Model No. 1 (ADM1). International Water
Association. 13.
Bollon, J., Le-Hyaric, R., Benbelkacem, H. and Buffière, P. 2011. Development of a kinetic model for anaerobic dry digestion processes: Focus on acetate degradation and moisture content. Biochemical Engineering Journal, 56, pp. 212-218.
Bollon, J., Benbelkacem, H., Gourdon, R. and Buffière, P. 2013. Measurement of diffusion coefficients in dry anaerobic digestion media. Chemical Engineering Science, 89, pp. 115-119. Esposito, G., Frunzo, L., Panico, A., Pirozzi, F. 2011. Modelling the effect of the OLR and OFMSW particle size on the performances of an anaerobic co-digestion reactor. Process Biochemistry, 46(2), pp. 557-565.
Esposito, G., Frunzo, L., Panico, A., Pirozzi, F. (2012). "Enhanced bio-methane production from co-digestion of different organic wastes." Environmental Technology 33(24): 2733-2740.
García-Bernet, D., Buffière, P., Latrille, E., Steyer, J.P. and Escudié, R. 2011. Water distribution in biowastes and digestates of dry anaerobic digestion technology. Chemical Engineering Journal, 172 (2-3), pp. 924-928.
Koch, K., Lübken, M., Gehring, T., Wichern, M., Horn, H. 2010. Biogas from grass silage – Measurements and modeling with ADM1. Bioresource Technology, 101(21), pp. 8158-8165. Koch, K., Egger, F., Braun, A., Briesen, H. 2013. Simulation of mixing in an anaerobic plug-flow digester treating maize silage with OpenFOAM in: 13th World Congress on Anaerobic Digestion: Recovering (bio)Resources for the World Santiago de Compostela, Spain. Kusch, S., Schäfer, W., and Kranert M. 2011. ”Dry Digestion of Organic Residues." In Integrated Waste
Lübken, M., Wichern, M., Schlattmann, M., Gronauer, A., & Horn, H. (2007). Modelling the energy balance of an anaerobic digester fed with cattle manure and renewable energy crops. Water Research, 41(18), 4085-4096.
Lissens, G., Vandevivere, P., De Baere, L., Biey, E.M., Verstraete, W. 2001. Solid waste digestors: process performance and practice for municipal solid waste digestion. Water Science and Technology 44(8), pp. 91-102.
Martin, D J. 2000. A novel mathematical model of solid-state digestion. Biotechnology Letters 22, pp. 91-94.
Martin, D.J., Potts, L.G.A., Heslop, V.A. 2003. Reaction mechanisms in solid-state anaerobic digestion - I. The reaction front hypothesis. Process Safety and Environmental Protection, 81(B3), pp. 171-179.
Motte, J.C., Escudié, R., Bernet, N., Delgenes, J.P., Steyer, J.P., Dumas, C. 2013. Dynamic effect of total solid content, low substrate/inoculum ratio and particle size on solid-state anaerobic digestion. Bioresource Technology, 144(0),pp. 141-148.
Nkemka, V.N., Murto, M. 2013. Two-stage anaerobic dry digestion of blue mussel and reed. Renewable Energy, 50(0), pp. 359-364.
Pontes, R.F.F. and Pinto, J.M. 2006. Analysis of integrated kinetic and flow models for anaerobic digesters. Chemical Engineering Journal, 122 (1-2), pp. 65-80.
Saravanan, V., Sreekrishnan, T.R. 2006. Modelling anaerobic biofilm reactors—A review. Journal of Environmental Management, 81(1), pp. 1-18.
Simonsson, D. 1988. Kemisk Reaktionsteknik. Stockholm: Kungliga Tekniska Högskolan. Vavilin, V.A., Lokshina, L.Y., Jokela, J.P.Y., Rintala, J.A. 2004. Modeling solid waste decomposition. Bioresource Technology, 94(1), pp. 69-81.
Sun, Y., Wang, D., Qiao, W., Wang, W., Zhu, T. 2013. Anaerobic co-digestion of municipal biomass wastes and waste activated sludge: Dynamic model and material balances. Journal of Environmental Sciences, 25(10), 2112-2122.
Syu, M.-J. 2001. Biological production of 2,3-butanediol. Applied Microbiology and Biotechnology. 55(1). 10-18.
Vavilin, V.A., Fernandez, B., Palatsi, J., Flotats, X. 2008. Hydrolysis kinetics in anaerobic degradation of particulate organic material: An overview. Waste management, 28(6), pp. 939-951.
Weiland, P. 2010. Biogas production: current state and perspectives. Applied Microbiology and Biotechnology, 85 (4), pp. 849-860.
Yu, L., Zhao, Q., Ma, J., Frear, C., Chen, S. 2012. Experimental and modeling study of a two-stage pilot scale high solid anaerobic digester system. Bioresource Technology, 124(0), 8-17.