ANNA SENNEBY
RE-EVALUATION OF
METHODS TO IDENTIFY
INDIVIDUALS WITH
INCREASED RISK OF CARIES
DOCT OR AL DISSERT A TION IN ODONT OL OG Y
R E - E V A L U A T I O N O F M E T H O D S T O I D E N T I F Y I N D I V I D U A L S W I T H I N C R E A S E D R I S K O F C A R I E S
Malmö University, Faculty of Odontology
Doctoral Dissertation 2017
© Anna Senneby, 2017 Cover illustration: Johan Birger ISBN 978-91-7104-722-9 (print) ISBN 978-91-7104-723-6 (pdf) Holmbergs, Malmö 2017
ANNA SENNEBY
RE-EVALUATION OF
METHODS TO IDENTIFY
INDIVIDUALS WITH
INCREASED RISK OF CARIES
Malmö University, 2017
Faculty of Odontology
Malmö, Sweden
This publication is also available in electronic format at: www.mah.se/muep
CONTENTS
LIST OF ARTICLES ... 10
ABSTRACT ... 11
POPULÄRVETENSKAPLIG SAMMANFATTNING (IN SWEDISH) ... 14
ABBREVIATIONS AND DEFINITIONS ... 16
INTRODUCTION ... 19
Oral Health and Diseases ... 19
Coronal Dental Caries ... 19
Etiology ... 19
Prevalence ... 22
Interventions ... 24
Diagnosis of Disease ... 25
Quantification of Probabilities and Uncertainties ... 26
Validity, Reliability and Agreement ... 29
Caries Lesion Detection ... 30
Caries Lesion Classification ... 32
Caries Lesion Progression ... 33
Caries Risk Assessment Methods ... 34
OBJECTIVES ... 36
MATERIAL AND METHODS ... 37
Guidelines ... 38
Systematic Review ... 38
Clinical, Radiographic and Microbiological Examinations ... 40
Evaluation of Diagnostic Methods ... 43
Previous Caries Experience ... 44
Dentists´ Risk Assessments ... 44
Acid Tolerance of Dental Biofilm ... 44
Reference Standard – Caries Lesion Progression ... 45
Rater Agreement ... 46
Radiological Assessment of Approximal Caries Lesions and Caries Lesion Progression ... 46
Assessment of Proportion Acid Tolerant Cells ... 47
RESULTS ... 48
Systematic Review ... 48
Assessment of Risk of Bias ... 49
Sample Characteristics Concerning Caries Status ... 50
Acid Tolerance in Dental Biofilm ... 50
Validity of the Interval Scale and Consistency of Acid Tolerance Assessment Method ... 52
Diagnostic Accuracy of Methods to Identify Individuals with Increased Risk of Caries Development ... 52
Previous Caries Experience ... 55
Dentists´Risk Assessments ... 56
Acid Tolerance of Dental Biofilm ... 56
Rater Agreement ... 56 Evidence ... 57 DISCUSSION ... 60 Guidelines ... 60 Methodological Considerations ... 63 Patient Selection ... 64 Index Tests ... 65
Reference Standard – The Not So Golden Standard ... 68
Flow and Timing ... 70
Diagnostic Accuracy ... 72
General Reflections ... 72
Some Factors Influencing Accuracy Estimates ... 73
Previous Caries Experience ... 75
Dentists´ Risk Assessments ... 76
Microbiological Tests ... 76
Risk ... 78
Transparency and Research Waste ... 81
Evidence – or Rather the Absence of Evidence ... 82
Clinical Importance ... 84 CONCLUSIONS ... 85 FUTURE RESEARCH ... 87 ACKNOWLEDGEMENTS ... 89 REFERENCES ... 92 PAPERS I – IV ...107
LIST OF ARTICLES
This thesis is based on the following articles, referred to in the text by their Roman numerals. All articles are reprinted with the permission from the copyright holders and appended to the end of the thesis. I. Diagnostic accuracy of different caries risk assessment methods.
A systematic review. Senneby A, Mejàre I, Sahlin NE, Svensäter G, Rohlin M. J Dent. 2015;43(12):1385-93. doi: 10.1016/j. jdent.2015.10.011.
II. A novel classification system for assessment of approximal caries lesion progression in bitewing radiographs. Senneby A, Elfvin M, Stebring-Franzon C, Rohlin M. Dentomaxillofac Radiol. 2016;45(5):2016. doi: 10.1259/dmfr.20160039.
III. Acid tolerance properties of dental biofilms in vivo. Senneby A, Davies JR, Svensäter G, Neilands J. Submitted to BMC Microbiol. 2017.
IV. Threshold Values Affect Diagnostic Accuracy of Caries Risk Assessment Methods. Senneby A, Neilands J, Svensäter G, Axtelius B, Rohlin M. To be submitted to Acta Odontol Scand.
ABSTRACT
The overall aim of this thesis was to re-evaluate methods used to identify individuals with increased risk of coronal caries lesion development. The specific aims were to:
• evaluate diagnostic accuracy of different methods used to
identify individuals with increased risk of developing coronal caries lesions (study I)
• design and pilot a novel classification system for the
assessment of caries lesion progression in bitewing radiography and to report rater agreement of the system (study II)
• assess intra-individual differences in biofilm acid-tolerance
between different tooth surfaces and inter-individual variation as well as stability of acid tolerance over time (study III)
• estimate threshold effects on diagnostic accuracy of (i)
previous caries experience, (ii) dentists’ risk assessments and
(iii) acid tolerance of dental biofilm to identify adolescents
with increased risk of developing coronal caries lesions (study IV).
Study I comprised a systematic review of caries risk assessment methods. Following methods were included for final analysis: previous caries experience, tests using microbiota, buffering capacity, salivary flow rate, dental plaque, dietary habits, and sociodemographic variables. The included studies were assessed for risk of bias with the aid of QUADAS-2, which resulted in identification of methodological limitations concerning study design, test technology and reporting. There was low evidence for methods using previous caries experience and salivary mutans streptococci and there was no evidence regarding other methods. The overall evidence concerning the validity of analysed methods used for caries risk assessment is limited. As methodological quality was low, there is a need to improve study design. Furthermore, candidate biomarkers for caries risk assessment was called for.
In study II a classification system with drawings and text was designed to assess caries lesion progression in bitewing radiographs. Guidelines for Reporting Reliability and Agreement Studies, GRRAS were used to design and report the study. Pairs of posterior bitewing radiographs (baseline and 1-year follow-up) of teeth with different status concerning caries lesion progression were selected and 10 raters assessed the radiographs with the aid of the classification system. Seven raters repeated their assessments.
Kappa for the interrater agreement of 10 raters assessing progression was 0.61, indicating substantial agreement. Corresponding intrarater agreement was substantial (kappa 0.66–0.82). This classification system can provide a common framework for clinical decision-making on caries interventional methods and patient visiting intervals. Scientifically, the system allows for a comparative analysis of different methods of prevention and treatment of caries as well as of different caries risk assessment methods.
In study III dental biofilms were collected from supragingival approximal surfaces in adolescents at baseline and after 3 days as well as after 1, 6 and 12 months. After exposure to pH 3.5 for 2
hours, biofilm bacteria were visualized with LiveDead® BacLightTM
staining and vitality examined using an inverted confocal scanning laser microscope. Bacteria stained green (live) were considered
acid-tolerant and red bacteria (damaged) not acid-acid-tolerant. Images of the biofilm were assessed using a scale (score 1-5) to determine the proportion acid-tolerant bacteria in each sample.
A majority of the adolescents showed low scores of biofilm acid tolerance. In 14 of 20 individuals, no differences were seen between three dental sites of the same individual. At 51 of total 60 sites, scores for acid tolerance were unchanged over a 3-day period. However, scores for acid tolerance changed over a 1-year period in 50% of the individuals. Thus, acid tolerance of dental biofilm seems to be a candidate method that may be implemented in caries risk assessment after clinical prospective studies have been performed.
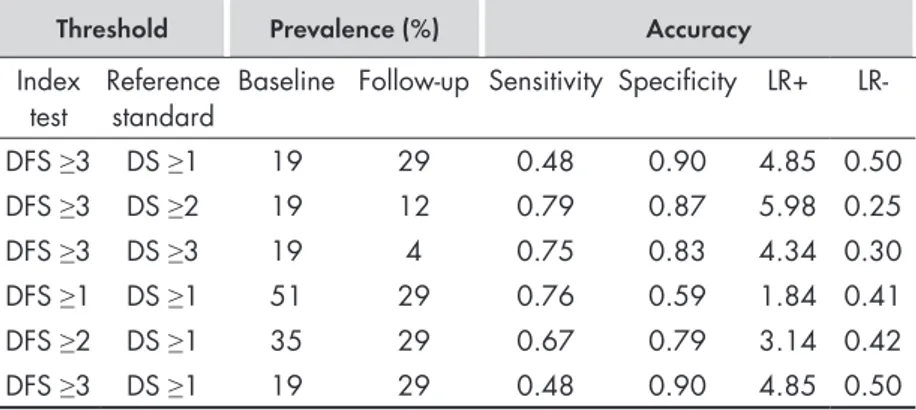
For the purpose of study IV, the STARD-statement “Standards for Reporting of Diagnostic Accuracy” was implemented for design and reporting of the study. Adolescents, aged 12, visiting two public dental clinics were examined by visual/tactile examination and bitewing radiography of posterior teeth at baseline and after 1 year. Two established methods (previous caries experience and dentists’ risk assessments) and one candidate method (acid tolerance in dental biofilm) were applied with pre-specified thresholds. The reference standard comprised coronal caries lesion development after 1 year. Caries lesion progression occurred in 29% of the adolescents, mainly as approximal lesions within enamel.
Diagnostic test accuracy varied with thresholds of the index tests, of the reference standard and with different caries status and caries lesion progression. Most positive likelihood ratios for the methods were <5 indicating small increases in the post-test probabilities. Therefore, it may difficult to design a universal model for caries risk assessment.
POPULÄRVETENSKAPLIG
SAMMANFATTNING (IN SWEDISH)
Med en tillförlitlig riskbedömningsmetod kan man säkrare förutspå vem som får kariesskador i framtiden. Då ökar chansen att man sätter in förebyggande åtgärder till de patienter som har nytta av åtgärderna. Det medför också att besöksintervallet hos tandvården bättre kan anpassas utifrån patientens behov. De riskbedömningsmetoder som används inom tandvården idag, och som återfinns i vetenskaplig litteratur, är inte tillförlitliga. Resultatet blir att patienter med ökad risk för kariesutveckling kan missbedömas. De övergripande målen med denna avhandling var att grundligt utvärdera befintliga riskbedömningsmetoder för kariesutveckling samt skapa en plattform för nya bättre metoder.
När man utvärderar om en riskbedömningsmetod är tillförlitlig behöver man bedöma kariesutvecklingen hos de patienterna som genomgått metoden. En grundläggande förutsättning för detta är att bedömningen av kariesutvecklingen dvs. kariesprogressionen i en röntgenbild är adekvat. Därför har överensstämmelsen mellan olika tandläkare, som använt sig av en ny mall för att bedöma kariesprogression i röntgenbilder, analyserats. Tandläkarnas bedömningar stämde väl överens både mellan tandläkarna och när en tandläkare upprepade sin bedömning.
En ny metod för riskbedömning har utvärderats i avhandlingen. I korthet innebär den att man bedömer proportionen syratoleranta bakterier i placket på tandytor. En hög andel syratoleranta bakterier är rimligen en förutsättning för att en kariesskada ska utvecklas. Syratoleranta bakterier favoriseras av en sur plackmiljö på tandytan, medan andra bakterier inte klarar sig i en sådan miljö. Resultaten i denna avhandling ger vissa belägg för att detta kan vara en användbar metod, men metoden behöver vidareutvecklas och utvärderas i fler och större vetenskapliga studier. Två andra metoder har också utvärderats i avhandlingen. Dessa bygger på att man bedömer patientens tidigare karieserfarenhet, dvs. om patienten har eller har haft kariesskador på tänderna. Metodernas tillförlitlighet varierar beroende på olika faktorer, till exempel sjukdomsförekomst och sjukdomspanorama (fördelning av svår respektive lindrig sjukdom) hos patienterna. Detta innebär att en metod, som är bra för en grupp patienter inte nödvändigtvis presterar lika bra om den används i en annan grupp av patienter.
Således är de vetenskapliga bevisen, ”evidensen”, för riskbedömning av kariesutveckling hos patienter inte tillräckliga för att avgöra om metoderna fungerar på ett tillförlitligt sätt. Framtida studier behöver vara tydligare i sin beskrivning av de metoder som använts och hur de har använts för att man ska kunna avgöra i vilket sammanhang de har utvärderats och kan användas.
ABBREVIATIONS AND DEFINITIONS
Agreement Agreement is defined as the degree to which
scores or ratings are identical i.e. how close the results of the repeated measurements are, by estimating the measurement error in repeated measurements (Kottner et al., 2011). The term includes reliability and reproducibility of methods as well
Caries increment Number of new caries lesions between two
points in time Caries lesion development
(synonym: caries lesion progression)
Development of a caries lesion from sound tooth surface to detectable lesion in enamel or dentin or from detectable to more extensive lesion
Caries risk assessment (synonym: caries prediction)
Methods/tests used to identify individuals with increased risk of developing coronal caries lesions
Diagnostic accuracy The capacity to discriminate among the
alternative states of the object under study (Swets & Pickett, 1982)
Diagnostic test Diagnostic procedures, such as laboratory
tests and x-rays, routinely performed on all individuals or specified categories of individuals in a specified situation, e.g., patients being admitted to the hospital (U.S. National Library of Medicine, 2017a)
DMFS/DMFT Decayed Missing Filled Surfaces/
Decayed Missing Filled Teeth (permanent teeth)
ICDAS International Caries Detection and Assessment System (Ismail et al., 2007)
Index test Test/method under evaluation (Cohen et al.,
2016)
Prevalence The proportion individuals exhibiting dental
caries lesions (in percentage) or the amount of dental caries in an individual or a group of individuals (DMFT/DMFS) (WHO, Oral health database)
Rater
(synonym: observer)
Every person who makes a judgement about a person or object (Kottner et al., 2011)
Reference standard The best available method for establishing the
presence or absence of the target condition (Cohen et al., 2016)
Risk The probability that an event will occur. It
encompasses a variety of measures of the probability of a generally unfavourable outcome (U.S. National Library of Medicine, 2017b)
Risk of dental caries We considered coronal caries as an
unfavourable outcome for the individual. Risk of dental caries was therefore defined as “The development either (i) from sound tooth surface to detectable lesion in enamel or dentin: i.e., from health to disease or (ii) from detectable to more extensive lesion: i.e., from disease to more severe disease
Threshold value (synonym: cut-off)
A point dividing a population in subgroups depending on the disease presence or severity
INTRODUCTION
The objective of this thesis was to develop, assess and validate methods to identify individuals with increased risk of coronal caries development.
Methods to identify individuals with increased risk of coronal caries lesion development are used daily in general dental practice and often form the basis for decisions concerning interventions and patients´ visiting intervals. A prerequisite for increased effectiveness of preventive interventions is the accurate identification of target individuals i.e. those with an increased risk for future caries development and those not at risk for caries development (Mejàre et al., 2015). However, a knowledge gap exists regarding diagnostic
accuracy of caries risk assessment methods.
Oral Health and Diseases
Dental caries is considered a serious public-health problem and oral diseases is the fourth most expensive disease to treat worldwide (WHO, 2007). Therefore, promotion of oral health is not only a cost-effective strategy, but also an integral part of health promotion in general, as oral health is a determinant of general health and quality of life. Dental caries experience in children of different ages
is associated with a negative oralhealth-relatedqualityoflife (Do &
Spencer, 2007; Filstrup et al., 2003).
Coronal Dental Caries
Etiology
Throughout history, many theories on the aetiology of dental caries have been formed. These include tooth worms, parasites, disturbance
of nutrition and many more (Miller, 1890). Already in the seventeenth century, Leeuwenhoek (1684) saw “little animals” in the scruff of teeth in his microscope, however for a long time his findings were doubted and even dismissed (Lane, 2015). In the twentieth century, the existence of Leeuwenhoek’s’ “little animals” was confirmed by the discovery of bacterial cells (Lane, 2015). Bacteria are one of the oldest known life forms on earth and definitely the most numerous. When mammals appeared on our planet bacteria had been established for billions of years (Amyes, 2014).
Today we believe that the human oral cavity exhibits a high degree of bacterial diversity with more than 700 taxa (Jenkinson, 2011). The oral microbiota is important to oral health as it prevents colonisation of pathogenic species and is thereby beneficial to the host (Marsh, 1994).
Numerous studies of the composition of microflora from sites with caries disease have been undertaken. As sites are normally colonised by complex microbial communities, the assessment of data presents a challenge. It is difficult to determine which species contribute to the development of disease, which ones have accumulated as a result of the disease, and which ones are merely innocent bystanders (Marsh, 2003).
The “non-specific plaque hypothesis” entered the field of caries aetiology in the 1960s and proposed that disease is a result of the overall interaction of all groups of bacteria in plaque and the amount of plaque. This theory is compromised by the fact that a limited subset of bacteria is consistently recovered in high numbers of diseased sites (Marsh, 2003).
For decades, Streptococcus mutans was considered the bacterial species principally responsible for the development of dental caries in humans (Keene & Shklair, 1974; Tanzer et al., 2001) and most diagnostic, preventive, and therapeutic strategies have been targeted towards this microorganism (Simon-Soro & Mira, 2015). Less frequently carious lesions were believed to be related to the activity of other streptococci or Lactobacillus spp (Loesche & Straffon, 1979). This “specific plaque hypothesis” thus proposes that only a small proportion of the species in plaque cause caries (Loesche, 1976). However, the oral ecosystem is inhabited by hundreds of bacterial species, most of which are considered commensals, and species
regarded as pathogens are frequently found in healthy individuals (Simon-Soro & Mira, 2015). Caries can occur without mutans streptococci or mutans streptococci can be present without caries lesions developing (Marsh et al., 1989).
Since the mid-1980s, the “ecological plaque hypothesis” has prevailed. This hypothesis explains disease as a result of the characteristics of the microflora (phenotype) rather than as a result of which microorganism (genotype) that inhabits it (Marsh, 1994). Plaque-mediated disease is a consequence of a change in the local environment caused by enrichment of “oral pathogens” which disturbs the balance and thus the stability of the resident microflora (Marsh, 2003; Marsh, 1994; Marsh, 1991; Marsh & Bradshaw, 1997).
Several bacteria, such as mutans streptococci and Actinomyces, is now considered to contribute to the demineralisation of tooth tissues (Beighton, 2005). Studies have shown that diseased sites are different from healthy ones in that they contain an increased amount of acidogenic and aciduric species, such as mutans streptococci (Streptococcus mutans and Streptococcus sobrinus) and lactobacilli, that contributes to demineralisation of enamel (Marsh, 2003).
As well as causing demineralisation, acids generated from carbohydrate metabolism by members of the biofilm affect the ecology of the biofilm itself. Support for a positive correlation between a flora with a higher acid-tolerance potential and lower plaque pH values has been found (Lingström et al., 2000). In the acidic environment created, these bacteria will have a competitive advantage and continue to flourish and achieve numerical dominance at the expense of more acid-sensitive species (Marsh, 2003). Consequently, an acid-tolerant microbiota will emerge promoting further change the oral ecosystem (Figure 1).
It has been shown that older biofilms have a higher proportion of acid-tolerant cells than newly formed biofilms (Welin-Neilands & Svensäter, 2007). However, little is known about the alteration
over time of an acid tolerant biofilm in vivo. It is also not known if the biofilm acid tolerance is a site-specific phenomenon or if acid tolerance varies between different sites of the oral cavity. Furthermore, the proportion of acid tolerant bacteria in dental biofilm may be a candidate method to identify individuals at increased risk of caries lesion development.
Figure 1. Factors on different levels influencing and contributing to caries lesion development. Original figure by Gunnel Svensäter, Malmö University.
Prevalence
Throughout history, humans, and indeed even the Neanderthals, have suffered from dental caries, albeit in low quantities (Topic et al., 2012). Iron Age remains found in Monte Bibele (Bologna) show a caries prevalence of about 10% (Gualandi, 1992). A similar frequency of carious teeth (7%) was observed in remains from the Bronze Age found in Pakistan (Lukacs, 1992).
Teeth found in the Forum Romanum shows that some ancient Romans suffered from severe and prevalent caries (Fejeskov et al., 2012). This is comparable to contemporary populations in Africa and China without access to dental care (Luan et al., 2000; Manji et al., 1989). However, studies of skeletal remains from ancient Rome actually suggest that the caries prevalence among slaves and the middle-class was quite low, caries affected no more than 4–6% of the teeth found (Manzi et al., 1999).
There was an increase in both caries lesions and severity from the middle Ages to the seventeenth century. This is believed to be connected to the dietary innovations of the seventeenth century, which included the consumption of cane sugar and refined flour (Moore & Corbett, 1975). Prevalence of caries lesions continued to increase during the seventeenth century (Corbett & Moore, 1976).
In Sweden, caries prevalence increased dramatically during the late 1800s and the early 1900s. In the early 1960s, approximately one fourth of those over the age of 16 were completely edentulous due to caries or periodontal diseases, and nearly 100 per cent of all children and adolescents suffered from caries to a greater or lesser extent (SBU, 2002). This is in line with the first global map with data on DMFT for 12-year-olds during this period (1969), showing a high prevalence of caries in “industrialised countries” and lower values in “developing countries”. Over the years, a change in caries prevalence with increasing levels of caries in certain “developing countries” and a decline in caries in many “industrialised countries” has occurred (WHO, 2017).
Thus, there have been improvements in the oral health of the populations of several countries, but in spite of this a global problem still persists. The problem is particularly noticeable among underprivileged groups in both developing and developed countries (Petersen, 2008). Trend of improving oral health has not been universal, it appears to have been reversed for some age groups in some of the countries in Eastern Europe during the period following the collapse of Communism (Künzel, 1996). This is especially the case in countries such as Bosnia and Herzegovina that have suffered wars (Ivankovic et al., 2003).
Major inequalities still exist, both within (The Swedish National Board of Health and Welfare, 2015) and between countries, in terms of disease severity and prevalence (Petersen et al., 2004). A decline in the prevalence and the severity of dental caries is particularly observed in countries with established public health programs using fluoride for dental caries prevention, coupled with changing living conditions, healthier lifestyles, and improved self-care practices (Petersen & Ogawa, 2016).
In Sweden, the Swedish National Board of Health and Welfare (2017) states that the number of caries-free 19-year-olds has increased
in recent years. Caries-lesion prevalence in Sweden is in accordance with WHO goals for 2020, lower than 1.5 DFT for 12-year-olds (0.70). In 2011, 65 % of 12-year-olds were caries free which is an improvement with 2 units as compared to 2010 (The Swedish National Board of Health and Welfare, 2013).
However, according to Christensen et al. (2010) and Petersen (2008), there is also a striking difference between the social classes in the Nordic countries and a difference between regions is also evident (The Swedish National Board of Health and Welfare, 2017). The typically skewed distribution in caries prevalence seen in adolescents levels out during early adulthood (Mejàre et al., 2004).
Interventions
Fluoride enhances remineralisation of enamel, increasing mineral content of early carious lesions (Gao et al., 2016). To promote remineralisation, we need to detect early caries lesions (Ekstrand et al., 2001; Longbottom et al., 2009). Therefore, it’s important to include bitewing radiography in the risk assessment enabling identification of individuals before cavity occur. There is a growing trend to delay operative intervention of caries lesions (Vidnes-Kopperud et al., 2011), emphasising early non-invasive intervention on the caries process (Pitts & Wefel, 2009; SBU, 2002) instead of operative interventions. However, caries operative treatment thresholds, based on radiographic images, vary between dentists in different countries (Espelid et al., 1994; Gordan et al., 2009) and Scandinavian dentists predominantly restore surfaces that involve dentin (Espelid et al., 2001; Lith et al., 2002). In general dental health care, clinicians often have access to a series of radiographs of their patients taken over a period of several years. The decision concerning intervention of approximal caries can then be based not only on the clinical examination and the detection of caries lesions and lesion depth in the radiographs but also on the caries lesion progression rate.
Despite of extensive research undertakings, there are still uncertainties about evidence and the effect of non-surgical methods in relation to the prevention of caries (Axelsson et al., 2004; Mejàre et al., 2015; Tellez et al., 2013b) as well as the effectiveness of prevention in so-called “high risk” individuals (SBU, 2002). However, this does not mean that preventive methods are ineffective or that they should
not be used (Axelsson et al., 2004). Several studies have found evidence for a caries-preventive effect including fluoride (Axelsson et al., 2004; SBU 2002; Tellez et al., 2013b). “Daily use of toothpaste with fluoride is an effective method of preventing caries in permanent teeth of children and adolescents (evidence grade 1)” (SBU, 2002). In locations where fluoride in toothpaste has been available for decades it is considered to be a main contributor to the decline in dental caries (Petersen & Ogawa, 2016).
Diagnosis of Disease
When experiencing new symptoms, we wonder; what is wrong with me? This question relates to the diagnosis of disease, which is crucial for further treatment and prognosis (Whiting et al., 2008). The diagnosis is often reached through an investigation of patient history and diagnostic tests that can include clinical examination and imaging procedures (Whiting et al., 2008). The information will aid the clinician in making a proper diagnosis (Weinstein et al., 1980), thus benefiting the patient through an appropriate patient management process (Fryback & Thornbury, 1991, Whiting et al., 2008) and prognosis (Whiting et al., 2008). Accurate diagnosis is also needed for professional communication, documentation, quality assurance, clinical research, theory building, and legal and reimbursement purposes (Kottner et al., 2011b).
But, clinical judgements and decisions on diagnosis are made under conditions of uncertainty. They are hampered by errors in clinical data, variations of interpretation, ambiguities in results, and uncertainties about relations between clinical information and presence of disease as well as about the effects of interventions (Weinstein et al., 1980). The uncertainties about the relationship between clinical information and presence of disease relates to the diagnostic accuracy of tests. Diagnostic tests should ideally provide information that enables the patients to be divided into two groups - those who have and those who do not have the target condition, this will enable the clinician to decide on who will need treatment and who will not. Then, the diagnostic test can modify our prior expectation that the patient in question has the disease (Weinstein et al., 1980). Characteristics of diagnostic tests are quantified in diagnostic accuracy studies, comparing the results of the index test, the diagnostic test under
evaluation, with the results of the reference standard, previously known as the “gold standard” (Leeflang et al., 2008; Whiting et al., 2008). For a robust reference standard, three universal criteria should be fulfilled. As formulated by Hinze & Wenzel (2003) “it should (1) be reproducible, (2) reflect the patho-anatomical appearance of the disease to be detected, and (3) be independent of the diagnostic tests under assessment”.
Quantification of Probabilities and Uncertainties
Probability is a perception of the decision-maker. The results of a test alter the decision-maker’s perception of how probable it is that the patient has the disease in question. The first probability is that of a positive (pT+) or negative (pT-) test result. The second probability is that the patient has (pD+), or does not have the disease (pD-). The third type of probability is the conditional probability that the patient has the disease (pT+D+), or does not have the disease (pT-D-) given the content of the clinical information (Weinstein et al., 1980) (Figure 2). Health True Negative (TN) Disease True Positive (TP) False Negative FN False Positive FP
Figure 2. Visualisation of a population healthy (green) and diseased
(red) individuals and the index test dividing them into four subgroups, true positive (TP), false positive (FP), false negative (FN), true negative (TN).
The true positive rate (TPR), or the sensitivity (pT+D+), is the proportion of patients with the disease who have a positive test result (Figure 2). The true negative rate (TNR), or the specificity (pT-D-), is the proportion of patients without the disease who have a negative test result (Weinstein et al., 1980; Yerushalmy, 1947). As clinical decisions of diagnosis are made under conditions of uncertainty, not all patients will be included in the TPR or TNR.
Tests have two features. The first is a measurable property related to a disease, for example radiolucency in tooth substance in bitewing radiographs relating to a caries lesion. The second is a positive criterion, a threshold value or cut-off point. This is a value of the measurable property distinguishing patients defined in the decision-making process as healthy/normal/acceptable from the diseased patients (Weinstein et al., 1980). The threshold could be caries visualised as radiolucency in enamel or in dentin. By defining this criterion, we dichotomise the results into only two categories; but the disease may or may not have numerous possible threshold values. This threshold, or thresholds, subsequently affects the distribution of patients in the pT-D- and pT+D+ groups.
Then, how about the uncertainties? As far as we know, no test is perfect. Therefore, some patients with the disease will exhibit negative test results (false negative rate, FNR) and some patients without the disease will exhibit positive test results (false positive rate, FPR) (Weinstein et al., 1980). These can be visualised using a cross tabulation, also called 2 x 2 table, from where measures of test accuracy can be derived (Figure 3).
Beside commonly known measures of sensitivity and specificity, it is possible to calculate the predictive values and likelihood ratios from such tables (Loong, 2003; Mulherin & Miller, 2002). The probability of an index test giving the correct diagnosis for a patient is not provided by the sensitivity and specificity in the clinical situation (Altman, 1984). Instead, data from the test result itself when performed for a patient needs to be considered. The positive predictive value (PPV) is defined as the proportion of patients with a positive test result who are correctly diagnosed, and the negative predictive value (NPV) as the proportion of patients with a negative test result that are correctly diagnosed (Altman, 1984). This gives information on the test’s usefulness in practice. The PPV and the NPV are commonly known to be adversely affected by disease prevalence (Altman, 1984) and this is also true for sensitivity and specificity (Bossyut et al., 2015; Feinstein 2002; Lachs et al., 1992; Leeflang et al., 2013; Mulherin & Miller 2002).
Figure 3. 2 x 2 table of true positive (a), false positive (b), false negative (c), true negative (d) individuals (numbers from study IV, threshold DFS 3 for index test previous caries experience and reference standard DS 1. Estimates for calculating test accuracy (sensitivity, specificity, predictive values and likelihood ratio).
The likelihood ratio (LR) (positive likelihood ratio ((pT+D+)/ (pT+D-)) and negative likelihood ratio ((pT-D+)/ (pT-D-)) is defined by Grimes and Schulz (2005) as “the percentage of ill people with a given test result divided by the percentage of well individuals with the same result” (Figure 3). Preferably, ill people should have a high percentage of positive test results and the positive likelihood ratio should be high. The size of the discrepancy is therefore of clinical importance (Grimes & Schulz, 2005). Likelihood ratios have the advantage of incorporating all four cells of a 2 x 2 table and, according to Grimes and Schulz (2005), likelihood ratios refine clinical judgment stating that “application of a likelihood ratio to a working diagnosis generally changes the diagnostic probability, sometimes radically”. Other common measures of diagnostic accuracy are the diagnostic odds ratios (ORs) and summary receiver operating characteristic curves (ROC-curves). In the ROC-curve, the FPR (1-specificity) is plotted against TPR (sensitivity) and the area under the curve indicates the test accuracy. Sub-group variation of sensitivity and specificity can also be examined by choosing a group based on relevant study characteristics and employing a chi-square test of association (Mulherin & Miller, 2002).
Validity, Reliability and Agreement
Validity refers to the ability of a test or method to actually measure what is intended referring to the true state of the attribute estimated by a suitable reference standard (Chien & Khan, 2001). A high validity requires a high reliability, but the reliability of a method can be high even though validity is low (SBU, 2004).
The last century’s technical progress challenges the human eye and brain. Errors and variations in interpretation create a weak link and it directly affects the value of diagnostic tests and other measurements in clinical practice (Robinson, 1997). Errors or variations in interpretation have to be taken into account when evaluating methods and in any diagnostic yield. Numerous studies of reliability and agreement show a lack of transparency and incomplete reporting on crucial items (Kottner et al., 2011b). Because of inadequate reporting, interpretation and synthesis of the results becomes difficult (Kottner et al., 2009; Kottner & Dassen 2008; Ratanawongsa et al., 2008; Stochkendahl et al., 2006).
It has been argued that there are important differences between agreement and reliability (Streiner & Norman, 2008; de Vet et al., 2006). Kottner and Streiner (2011) suggest that much of the confusion surrounding reliability and agreement estimation was and is caused by conceptual ambiguities. Reliability is defined as the ability of scores of a measuring device to differentiate among subjects or objects (Kottner et al., 2011a). It answers the question ‘‘How reliable is the measurement?’’ In other words, how well can patients be distinguished from each other, despite measurement errors? de Vet et al. (2006) defines reliability as follows: “reliability parameters assess whether study objects, often persons, can be distinguished from each other, despite measurement errors”.
Agreement is defined as the degree to which scores or ratings are identical, i.e. how close the results of the repeated measurements are, by estimating the measurement error in repeated measurements (Kottner et al., 2011a). This is useful for clinicians because it answers the question ‘‘How good is the agreement between repeated measurements?’’ This concerns the measurement error and assesses exactly how close the scores for repeated measurements are (de Vet et al., 2006). Thus, it reflects the degree to which scores or ratings are identical between raters (inter-rater agreement) or between different points in time for the same objects and rater (intra-rater agreement).
There are several statistical approaches used in literature concerning the measurement of reliability and agreement according to GRRAS (Kottner et al., 2011a). Kappa statistics, intra-class correlation coefficients (ICC) and weighted kappa are examples of commonly statistical approaches. Agreement is also measured as percentage agreement (Kottner et al., 2011a; de Vet et al., 2013).
Caries Lesion Detection
Caries lesions can be detected by visual and tactile examination and/ or by using radiography. Gimenez et al. (2015) found that visual inspection presents good accuracy in the detection of carious lesions in teeth, with a trend towards a higher specificity than sensitivity. However, limited external validity and heterogeneity in results were present (Gimenez et al., 2015).
Bitewing radiography is “still state-of-the-art as an adjunct method in diagnosing carious lesions in clinically inaccessible approximal
surfaces” (Wenzel, 2014). Its advantages include the possibility to detect approximal enamel lesions and the images provide a permanent record that permits assessment of longitudinal monitoring of caries lesions (Pitts, 1991). Visual and tactile examination in combination with radiography shows the highest accuracy for detection of caries lesions (SBU, 2007). In a study by Hintze and Wenzel (1993) of surfaces that first underwent clinical examination and then bitewing radiography, radiography detected enamel caries in 9% of the clinically sound approximal surfaces, and dentinal caries in 1%. No histological validation was performed. This is in line with Pitts (1991) who found numerous additional approximal lesions including all severities when adding bitewings to the clinical examination; numbers were fewer of including dentinal lesions. Pitts (1991) concluded that “for posterior approximal surfaces, radiographic diagnosis will inevitably detect many more lesions than clinical examination alone”.
According to a recent meta-analysis (Schwendicke et al., 2015), the sensitivity for radiographic caries detection of approximal lesions (any severity) in clinical studies was 0.24 to 0.42 and corresponding specificity was 0.70 to 0.97. For approximal dentin lesions, sensitivity was higher, 0.36 and specificity was 0.94.
There are different methods for validation of caries lesions, such as clinical examination, radiography, and histology (Hinze & Wenzel 2003; Wenzel et al., 1993). For an in vitro evaluation of the accuracy of caries diagnostic methods, sectioning of the teeth with an assessment of the sections in a stereomicroscope has been confirmed to be an accurate validation (performed for occlusal caries lesions) (Hintze et al., 1995).
It is widely accepted that limited agreement is inherent to radio-graphic caries diagnosis (Wenzel & Hintze, 1999a). Reported rater agreement varies among radiographic studies of caries detection (Pliskin et al., 1984; SBU, 2007; Senel et al., 2010; Wenzel, 2001). This may be owing to differences in the underlying sample characteristics, such as lesion depth, dentition, surface location, and caries prevalence, and to methodological heterogeneity, such as the number of surfaces, number of raters, and scoring categories.
There is ongoing research on the development of new clinical methods for caries detection, with varying accuracy. For this thesis, other more uncommon methods for caries detection occasionally
included in caries prediction models, for example, fiber-optic trans-illumination or infrared trans-trans-illumination technology, will not be considered.
Caries Lesion Classification
Caries lesion classification may facilitate patient-care giver communication and guide dental practitioners in treatment planning and prognosis assessments. Also, it is important for policy makers to have a reliable picture of the caries situation and development in a specific population. Giminez et al. (2015) found that studies using well-established scoring systems showed higher accuracy in detecting carious lesions in the proximal and occlusal surfaces of teeth when compared with studies that did not report the method used or that used their own criteria.
Since the late nineteenth century numerous systems for caries lesion classification have been developed. Ismail et al. (2004) investigated the content validity of a sample of caries detection criteria reported in the literature between January 1, 1966, and May 1, 2000. They found 29 criteria systems with considerable variability in disease processes measured, inclusion and exclusion criteria, and examination conditions. The most widely used carious lesion classification system
is the one proposed by the WHO (WHO 4th ed.). It includes clinical
examination and caries is registered when cavitation is present. Its purpose is to allow meaningful comparison of the caries situation in various populations. When the diagnostic threshold was changed to include all lesions, DMFT values almost doubled in an examination of Hong Kong children as it went from 3.0 with dentinal lesions to 5.9 including enamel lesions (Pitts & Fyffe, 1988) and in Scottish schoolchildren a similar discrepancy (Rimmer & Pitts, 1991) was found when using clinical examination.
In 2001 a group of dental researchers took the initiative to develop a caries assessment system called ICDAS, based on visual⁄ tactile examination (Ismail et al., 2007). ICDAS is the result of an attempt to find a common caries assessment system based on the many available systems. This system includes codes for recording stages of carious lesions in enamel and in dentine, each in ascending order of severity. For radiographic studies a classification system of approximal decayed and filled surfaces was presented by Gröndahl et al. (1977).
Enamel caries lesions were included in this system, which was demonstrated to offer advantages compared with systems only taking new lesion into account.
Caries Lesion Progression
In general dental care, clinicians often have access to radiographs of their patients from different years. Such radiographs facilitate the assessment of changes of hard tissues over time. Clinical decisions on interventions can then be based on not only caries lesion detection but also on the assessment of caries lesion progression
Assessment of caries lesion progression is crucial also in studies of caries risk assessment, as caries increment, i.e. the development of new or more severe disease, comprises the reference standard of choice. For caries risk assessment studies, the caries increment is established through subtraction of baseline caries experience (number of lesions) from the results at the follow-up, in this way the number of new lesions is calculated (Mejàre et al., 2014). It is common to assess the reference standard through a visual and tactile examination (Bankel et al., 2011; Demers et al., 1992; Grindefjord et al., 1995b). The accuracy of this method has been deemed inadequate, for approximal lesions and for assessment of caries progression (SBU, 2007).
In view of the clinical and scientific importance of the radiographic assessment of caries lesion progression, an established classification system for this assessment could prove valuable. Accuracy of
radiographic assessment of caries lesion progression in terms of sensitivity and specificity is difficult to achieve owing to difficulties in obtaining a reference standard. Wenzel et al. (1998) stated, “when no valid expression of the true state of the disease can be obtained a study of precision… is appropriate”. Swets and Pickett (1982) also highlighted that observer performance could be considered as a measure of the extent to which the inaccuracy of a system is the result of decision-making errors. The level of agreement among raters for radiographic assessment of caries lesion progression is however, largely unknown. Only one previous study was found regarding the agreement of caries lesions progression (Wenzel et al., 2000). Based on the reported variation among dentists in the detection and depth estimation of caries lesions, it can be expected that this variation may also exist for the assessment of caries lesion progression.
Caries Risk Assessment Methods
Contemporary caries risk assessment methods include previous caries experience, salivary parameters such as buffering capacity and salivary flow rate, oral hygiene measures such as plaque amount, tests using microbiota such as amount of genotypes in saliva or from dental biofilm, most common amount of S. mutans and Lactobacillus, dietary measures such as frequency of intake and/or economic- or socio-demographic variables such as educational years (Mejàre et al., 2014: SBU, 2007; Tellez et al., 2013a; Twetman, 2016). A perfect risk marker has a sensitivity of 100% and a specificity of 100%, implying no errors in risk assessment. Unfortunately, no such caries risk assessment method exists. In general, the validity of caries risk assessment methods remains uncertain (Mejàre et al., 2015; Tellez et al., 2013a).
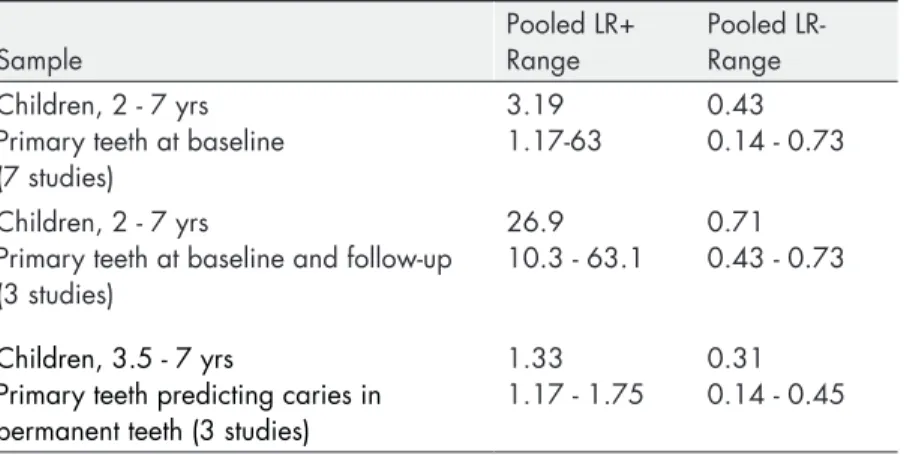
Previous caries experience is probably the most used and evaluated method to identify individuals with increased risk of dental caries lesions. This may be due to it being readily accessible, as it constitutes an integral part of the clinical examination. The method includes a visual- or a visual and tactile examination of teeth and, more uncommon in the scientific literature, bitewing radiography (Mejàre et al., 2014). Previous caries experience is considered to be the single best predictor in children (Mejàre et al., 2015; Tellez et al., 2013a; Hausen 1997; Zero et al., 2001). Baseline caries prevalence as index test performed better in pre-school children than in schoolchildren (Mejàre et al., 2015). For pre-school children, the sensitivity was 80% and specificity 79% to predict future caries lesions. In school children, specificity was higher than sensitivity (SBU, 2007). For children, the quality of the evidence was generally low and the studies were methodologically deficient (SBU, 2007). Tellez et al. (2013a) found only one risk assessment method that was validated, the Cariogram (multifactorial model), and it was found to be clinically useful in identifying caries risk levels using cavitation as disease threshold (Campus et al., 2012; Tellez et al., 2013a). Still, the external validity for this method, inside and outside Scandinavia, is unknown (Tellez et al., 2013a), this is probably the case for external validity in most caries risk assessment methods.
Salivary secretion rate and buffer capacity were found to have a small impact on caries prediction in a multifactorial model (Cariogram) when predicting new caries lesions in children (Petersson et al., 2010). This is in line with the results of a systematic review (Mejàre et al. 2014) that there was not any increase in the predictive potential in models when implementing buffer capacity. Furthermore, there was no evidence for sociodemographic/economic methods, buffering capacity, salivary flow rate and oral hygiene measures as single factors for caries prediction. These methods showed low and scattered accuracy values (Mejàre et al., 2014).
Microbiological methods in caries risk assessment methods often includes measurements of amount of genotypes present in dental biofilm or in saliva, collected with, for example, a swab or a spatula (Mejàre et al. 2014; SBU 2007) possibly assessed with different threshold values (Kingman et al., 1988). Frequently, mutans streptococci or lactobacilli are evaluated as index tests in caries risk
assessment studies (Bankel et al., 2011;Demers et al.1992;
Mattos-Graner et al.,2000; Meurman & Pienihäkkinen,2010; Mejàre et al.,
2014; SBU 2007). Mutans streptococci as a single predictor show inadequate accuracy for caries development in children (SBU, 2007).
OBJECTIVES
The objectives of this thesis were to:
• Evaluate the diagnostic accuracy of different methods used to
identify individuals with increased risk of developing coronal caries lesions (study I)
• Design and pilot a novel classification system for the
assessment of caries lesion progression in bitewing radiography and to report rater agreement of the system (study II)
• Assess intra-individual differences in biofilm acid-tolerance
between different tooth surfaces and inter-individual variation as well as stability of acid tolerance over time (study III)
• Estimate threshold effects on diagnostic accuracy of
(i) previous caries experience, (ii) dentists’ risk assessments and (iii) acid tolerance of dental biofilm to identify adolescents with increased risk of developing coronal caries lesions (study IV).
MATERIAL AND METHODS
Firstly, scientific literature on methods used to identify individuals with an increased risk for caries development was critically evaluated through a systematic literature review (I). Thereby, knowledge gaps within the field were identified. The results from the systematic review influenced the planning, design, and reporting of studies II, III and IV. In an observer study (II), a novel classification system for radiographic assessment of caries lesion progression was designed and evaluated with regards to rater agreement. Study III constituted a clinical and laboratory pilot trial, evaluating a candidate method for identifying individuals with increased risk for caries development, acid tolerance of dental biofilm, with respect to distribution and stability in adolescents. Study IV comprised a prospective clinical trial on three methods to identify individuals with increased risk for caries development.
Knowledge on common deficiencies in study design and reporting from study I was used to avoid some pitfalls. The classification system for assessing caries lesion progression (study II) was implemented as one part of the reference standard (studies III and IV) and the acid tolerance of dental biofilm (study III) applied as one of three caries risk assessment methods (study IV). Study IV was designed to validate established methods on caries risk assessment, such as previous caries experience, which was identified as a necessity in future studies in the systematic review (study I).
Study II, III and IV involved adolescents from two public dental health clinics in the counties of Blekinge and Kronoberg, Sweden. The studies II, III, and IV followed the Declaration of Helsinki guidelines. Ethical approval was granted by the Regional Ethical Review Board,
Lund, Sweden (studies II and IV, registration number: OD62-2012/122, study III registration number: 2016/146). Subjects in study III and IV received compensation upon completion of their participation.
Guidelines
In order to achieve an approach that was accurate and transparent, thus enabling the readership to assess potential bias, applicable guidelines were considered (Table 1). A modified QUADAS-2 protocol for risk of bias (low, high or unclear) was applied in four domains (study I): (i) sample selection, (ii) index test, (iii) reference standard, and (iv) flow and timing (Whiting et al., 2011). In accordance with QUADAS-2, the first three domains were also assessed for concerns regarding applicability. Protocols were piloted according to the problem specification of the review and different protocols were designed for the different index tests. Studies deemed to present a high risk of bias concerning the index test or reference standard were excluded from the final analysis in the review. The quality of evidence based on results of three or more studies was rated in four grades (high, moderate, low, very low) according to GRADE (Atkins et al., 2004). Limitations in study quality, inconsistency of results across studies, uncertainty about directness of the evidence, imprecise or sparse data and high risk of reporting bias lowered the grade of evidence. “Directness refers to the extent to which the people, interventions, and outcome measures are similar to those of interest” (Atkins et al., 2004).
Systematic Review
PubMed and two additional databases were searched. After reviewing the retrieved abstracts, selected publications were assessed in full-text according to inclusion and exclusion criteria formulated in accordance with recommendations from Centre for Reviews and Dissemination (CRD, 2009). Inclusion criteria were: primary studies/systematic reviews with a prospective and longitudinal design (1 year), attrition <40% and clinically applicable methods described to permit replication. Reference standard was caries increment/development. Data on included methods should allow for calculation of diagnostic accuracy. To facilitate comparison of results from different studies of the index test salivary mutans streptococci, the values concerning bacterial counts presented in the publications were re-calculated to counts per ml saliva.
Sample
Adolescents, aged 12, visiting two public dental clinics, one in Kronoberg (clinic A) and one in Blekinge County (clinic S) (studies II, IV), Sweden, were approached during their regular dental check-up appointments. Individuals fulfilling the inclusion criteria were consecutively enrolled. For the purpose of an ongoing intervention study, some adolescents were randomly allocated to an intervention group. In addition to their normal oral hygiene routines, the patients drank a dose of fluoride solution (0.75mg for children aged 12 years and 1.0mg for children >13 years) in 200 ml of cow’s milk or water on a daily basis. Patients in another group consumed 200 ml fluid without fluoride daily. Between baseline and the 1-year follow-up, one general dental practitioner (GDP) at each clinic assessed the need for additional interventions individually and their decision was based
Table 1. Guidelines applied: PRISMA (Preferred Reporting Items for
Systematic Reviews and Meta-Analysis) (Moher et al., 2010), AMSTAR (Assessing the Methodological Quality of Systematic Reviews) (Shea et al., 2007), CRD guidance for undertaking reviews in health care (Centre for Reviews and Dissemination, 2009), QUADAS-2 (Quality Assessment for Diagnostic Test Accuracy Studies) (Whiting et al., 2011), GRADE (Grading of Recommendations Assessment, Development and Evaluation) (Atkins et al., 2004), STARD (Standards for the Reporting of Diagnostic Accuracy Studies) (Bossyut et al., 2003), GRRAS (Guidelines for Reporting Reliability and Agreement Studies) (Kottner et al., 2011a). Study/ guideline I Systematic review II Observer study III Clinical trial/ laboratory study IV Prospective clinical trial PRISMA x AMSTAR x CRD x QUADAS-2 x x GRADE x STARD x x GRRAS x x
on the results of the visual-/tactile and radiographic examination and was performed in accordance with the guidelines of each public dental clinic.
Clinical, Radiographic and Microbiological Examinations
All clinical examinations of individuals were performed by one and the same GDP at each clinic at baseline and follow-up (study IV). The clinical examinations included each tooth surface being examined separately (all surfaces of incisors and cuspids; occlusal, buccal and lingual surfaces of premolars and molars). The surfaces were scored according to ICDAS (Ismail et al. 2007), with a score from 0 to 6. At baseline, radiographic assessment was performed of the approximal surfaces of the posterior teeth in bitewing images of right and left side (all visible mesial and distal surfaces) by two oral- and maxillofacial radiologists in consensus (study IV). Surfaces were assessed at baseline as sound, caries lesion in the outer enamel, caries lesion in the inner enamel (reaching the dento-enamel junction) and caries lesion in the dentine.In studies II and IV the equipment (dental X-ray units and imaging plate systems) was checked for the following parameters prior to the radiographic examinations: tube voltage, exposure time (reproducibility and linearity), low contrast, and spatial resolution. The doses of radiation (microgray) for different exposure times were recorded. In addition, dose ratios (milligray per second) were recorded for applicable exposure times (0.2, 0.25 and 0.32 s). Regarding tube voltage, thresholds for kilovoltage were adjusted (60, 63, 66 and 70 kV) and the actual tube voltage was recorded with RaySafe ThinX Intra equipment (Unfors RaySafe, Fluke Biomedical, WA). When exposure times were registered, a scheme of five repetitions was adopted for the reproducibility control.
Further, a series ranging from 0.01 to 0.5 s of exposure time was used for the linearity control. Doses of radiation were measured throughout and dose ratios calculated on the obtained values. Spatial resolution was measured by exposing a spatial resolution phantom three times with different exposure times intended to produce optimal visualization of the object in the computer software used. Two plexiglass plates served as a phantom meant to represent the soft tissues of patients, thus being placed in between the spatial resolution
phantom and the imaging plate. A value, visible lines per millimetre, was obtained by reviewing the radiographic image (expressed as a number of 1– 10). In order to obtain the best possible image of low contrast reproducibility, a plexiglass rectangle with depressions of different depths was used. All images were exported as digital imaging and communication in medicine files (DICOM) to portable storage media from the digital viewing software programs. The images were
then imported to Romexis® software (Planmeca, Finland) and were
anonymised (studies II, IV).
For the microbiological examinations, all collections of dental biofilm were performed by one and the same GDP at clinic A and S (study IV) respectively at the time of baseline examinations. The dental biofilms were sampled with Quicksticks (Dab Dental AB, Upplands Väsby, Sweden). Each sample was transferred into a separate sterile microfuge tube, sealed, and sent to the laboratory for further analysis. Laboratory method included each sample from the clinic being exposed to acid shock at pH 3.5 and after incubation the
cells were stained using LIVE/DEAD® BacLightTM Fluorescent Stain
(Molecular Probes, Eugene, USA). Each biofilm sample was examined using an inverted confocal scanning laser microscope (Nikon Eclipse TE2000, Nikon Corp., Tokyo, Japan). Live bacteria (acid tolerant) appear green, while dead (non-acid tolerant) bacteria appear red. For every adolescent, ten random images were recorded from each of the pooled dental sites on each occasion. All ten images were scored separately by one oral microbiologist according to an interval scale (Figure 4) with 5 possible scores representing the proportion of acid tolerant cells in the biofilm (studies III, IV). The most representative score from the ten images was used to represent the sample (III, IV).
For half of the individuals in study III (n = 20) samples were taken from all supragingival approximal surfaces between second premolars and first molars (four sites) and pooled to give one sample for each individual. Samples were taken at baseline and after 6 and 12 months. In the other half of the individuals (n = 20) dental biofilms were sampled and pooled in the same manner from all approximal surfaces between second premolars and first molars (four sites), between canines and first premolars (four sites) and between the central incisors in both jaws (two sites). This sampling took place at baseline, after three days and after one month. In study III, a change
Figur
e 4.
Images representing scores 1-5. Acid tolerant bacteria appear green and non-acid tolerant bacteria appear red
when being stained with LIVE/DEAD
® BacLightTM V
in the level of acid tolerance was defined as an increase or decrease of 2 scores according to the interval scale. This corresponded to a difference of at least 20% in the proportion of acid-tolerant cells in the images.
Evaluation of Diagnostic Methods
Diagnostic methods were evaluated with regards to diagnostic accuracy and rater agreement. Diagnostic accuracy of methods for caries risk assessment was calculated through cross-classifying the number of true positive (TP), false positive (FP), false negative (FN), and true negative (TN) individuals for available (I) or selected threshold values (IV). Threshold values for the index tests and reference standard were pre-specified in study IV based on: thresholds assumed relevant for clinical practice, current risk assessment program of the public dental service in one region (Blekinge), and on acid tolerance scores implemented in an ongoing intervention study.
The sensitivity, specificity, predictive values and likelihood ratios, along with their corresponding 95% confidence intervals were calculated from the cross-classifications. In study I, forest plots on accuracy measures were generated for selected subgroups of individuals using the statistical software Meta-DiSc (Zamora et al., 2006). Heterogeneity was assessed visually, using the forest plots, and statistically, using a chi-square test, with P <0.05 indicative of heterogeneity across studies.
Available measures of rater agreement were extracted (study I) or assessed for the classification system on caries lesion progression (study II) and for caries detection (study IV) as well as for acid tolerance (studies III, IV). The assessments included kappa values, with 95% confidence intervals, for intra-rater (studies II, III, IV), inter-rater (studies II, IV) and pair-wise rater agreement (studies II, IV) as well as agreement in percentage for intra-rater and pair-wise rater agreement. Inter-rater agreement calculations were based on the first reading (studies II, IV). Kappa values, varying from -1 to 1, were categorised according to the scale suggested by Landis and Koch (1977). According to this scale, values less than zero are considered as poor agreement, 0.00 to 0.20 as slight, 0.21 to 0.40 as fair, 0.41 to 0.60 as moderate, 0.61 to 0.80 as substantial, and values higher than 0.81 as almost perfect agreement.
Previous Caries Experience
Previous caries experience in study IV was based on the visual and tactile examination of all permanent teeth and bitewing radiography of the posterior teeth. The pre-specified thresholds of previous caries experience were defined as:
– DMFS 1, 2, 3, 4 or 5
Decayed Missing Filled Surfaces of permanent teeth. Decayed included all coronal surfaces and caries lesion severities, missing were included if it was due to caries. Only fillings due to caries were included.
Dentists´ Risk Assessments
Dentists´ risk assessments in study IV was based on the visual and tactile examination of primary and permanent teeth and bitewing radiography of the posterior teeth. Each tooth surface was assessed as healthy, with enamel or dentine lesion. The GDP in each clinic performed a risk assessment on the basis of the results from their previous and present clinical and radiographic examinations. Since all adolescents had attended the clinics for two years or longer, it was possible to acquire their records and assess coronal caries lesion progression during two years. The pre-specified thresholds for dentists’ risk assessments were applied according to criteria implemented in one of the public dental clinics and defined as:
– low risk = no new enamel caries lesion during the previous two years
– high risk = 1 dentinal caries lesion (arrested or progressed lesion) or 1 new approximal caries lesion in enamel during the previous two years.
Acid Tolerance of Dental Biofilm
For the purpose of using acid tolerance method as an index test for caries risk assessment (study IV) dental biofilm from all supragingival approximal surfaces between second premolars and first molars (four sites) were pooled to give one sample for each individual at baseline. The individual received one score according to the interval scale (Figure 4).
The pre-specified thresholds for acid tolerance of dental biofilm as an index test were:
– Score ш1, ш2, ш3, ш4 or 5
Reference Standard – Caries Lesion Progression
To determine the reference standard in study IV, clinical and radiographic examinations were repeated after 1 year with access to records from baseline. The records of the clinical examinations at baseline and after 1 year were compared for all surfaces of incisors and cuspids and for occlusal, buccal, and lingual surfaces of premolars and molars regarding the ICDAS scores. An increase in ICDAS scores over the year was interpreted as caries lesion progression for these surfaces.
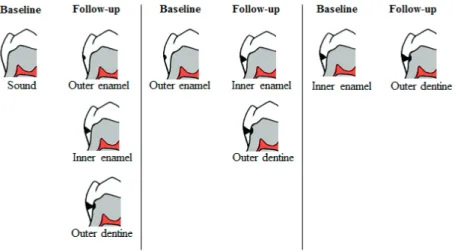
Approximal surfaces of premolars and molars were assessed according to a classification system designed to visualise caries lesion progression in terms of no progression or progression of caries lesions developed in study II. The bitewing images were displayed side-by side on a monitor in bitewing images: one image pair from baseline and one from the 1-year follow-up (Figure 5).
Figure 5. Examples of a bitewing image pair from study II, baseline
The assessments were performed without access to the results of the clinical examinations. Figure 6 displays the system used for assessment of caries lesion progression of each approximal surface, based on the classification system designed to visualise sound, arrested and progressed caries lesions. The pre-specified thresholds for caries increment were defined as:
- DMS 1, 2 or 3
Decayed Missing Filled Surfaces, of permanent teeth. Decayed included progressed coronal caries lesions, all coronal surfaces and caries lesion severities, missing were included if they were due to caries.
Figure 6. Modified classification system for assessment of caries lesion
progression of approximal surfaces in bitewing radiography (full version presented in study II).
Rater Agreement
Radiological Assessment of Approximal Caries Lesions and
Caries Lesion Progression
For study II, rater agreement of caries lesion progression, images of each selected patient were paired: one image from baseline and one image from the 1-year follow-up, resulting in 65 image pairs. The radiographs were selected to represent five surfaces for all categories
presented in Figure 6, except for surfaces with caries lesion in the inner half of the dentine, which were not represented in the sample and not assessed by the raters. 20 sound surfaces without progression were included. Altogether, 65 approximal surfaces in the 65 image pairs with and without caries lesion progression were included for assessment. 10 raters assessed the surfaces and seven raters reassessed all surfaces in the same order and same setting after 2–4 weeks. During the second viewing, raters were blinded towards their results from previous assessments.
For study IV, intra-rater agreement of caries lesion detection and caries lesion progression, radiographs were re-assessed in the same setting after a minimum of 2 weeks. During the second viewing, raters were blinded towards the results of their previous assessments. For the assessments of caries detection, radiographs of 10 adolescents with different status concerning caries lesions (50% adolescents with caries lesions) were selected. Surfaces were assessed as sound, caries lesion in the outer enamel, in the inner enamel (reaching the dento-enamel junction) or in the dentine. For assessment of caries lesion progression, pairs of radiographs of 10 other adolescents with different status concerning caries lesion progression (50% adolescents with caries lesions) were selected. Caries lesion progression was assessed using a modified classification system (Figure 6) based on a classification system presented in study II.
Assessment of Proportion Acid Tolerant Cells
To establish inter- and intra-rater agreement of the assessments of proportion acid tolerant cells in images of dental biofilm, seven raters, all experienced within the field, were asked to assess 50 images of samples originating from clinic A in study III. The images were selected to represent 10 images of each score (score 1-5) (Figure 4). For inter-rater agreement, the images were presented to the raters in random order one by one. The raters independently assessed and scored each image. No calibration exercise preceded the sessions. For intra-rater agreement, two of the raters repeated their assessments after 14-21 days under the same conditions. The order of image presentation differed from the first session. Raters were blinded towards previous results.