Dentistry and Related Research. This paper has been peer-reviewed but
does not include the final publisher proof-corrections or journal pagination.
Citation for the published paper:
Chrcanovic, Bruno; Kisch, Jenö; Albrektsson, Tomas; Wennerberg, Ann.
(2018). A retrospective study on clinical and radiological outcomes of oral
implants in patients followed up for a minimum of 20 years. Clinical Implant
Dentistry and Related Research, vol. 20, issue 2, p. null
URL: https://doi.org/10.1111/cid.12571
Publisher: Wiley
This document has been downloaded from MUEP (https://muep.mah.se) /
DIVA (https://mau.diva-portal.org).
A retrospective study on clinical and radiological outcomes of oral implants in patients followed up
for a minimum of 20 years
Running head: Implant outcomes 20+ years of follow-up
Bruno Ramos Chrcanovic 1*, Jenö Kisch 2, Tomas Albrektsson 3, Ann Wennerberg 4
1 DDS, MSc, PhD student; Department of Prosthodontics, Faculty of Odontology, Malmö University, Malmö, Sweden
2
DDS, OD. h.c.; Clinic for Prosthodontics, Centre of Dental Specialist Care, Malmö, Sweden
3 MD, PhD, RCPSG; Department of Biomaterials, Göteborg University, Göteborg, Sweden; Department of Prosthodontics, Faculty of Odontology, Malmö University, Malmö, Sweden
4 DDS, PhD; Department of Prosthodontics, Faculty of Odontology, Malmö University, Malmö, Sweden
* Corresponding author:
Bruno Ramos Chrcanovic, Department of Prosthodontics, Faculty of Odontology, Malmö University, Carl Gustafs väg 34, SE-214 21, Malmö, Sweden. bruno.chrcanovic@mah.se; brunochrcanovic@hotmail.com Mobile: +46 725 541 545 Fax: +46 40 6658503
Bruno Ramos Chrcanovic, Jenö Kisch, Tomas Albrektsson, Ann Wennerberg: no conflict of interest
Author contributions
Bruno Ramos Chrcanovic: concept/design, data collection/acquisition, statistics, data analysis/interpretation, drafting article, critical revision of article, approval of article, agreed to be accountable for all aspects of the work.
Jenö Kisch, Tomas Albrektsson, Ann Wennerberg: concept/design, data analysis/interpretation, critical revision of article, approval of article, agreed to be accountable for all aspects of the work.
Abstract
Background. Very long-term follow-up of oral implants is seldom reported in the literature.
Purpose. To assess oral implant failure rates and marginal bone loss (MBL) of patients followed up for a minimum of 20 years.
Materials and Methods. Implants placed in patients followed up for 20+ years were included. Descriptive statistics, survival analyses, generalized estimating equations (GEE) were performed. Three-hundred implants were randomly selected for MBL.
Results. 1,045 implants (227 patients) were included. Implant location, irradiation, and bruxism affected the implant survival rate. Thirty-five percent of the failures occurred within the first year after implantation, and another 26.8% in the second/third year. There was a CSR of 87.8% after 36 years of follow-up. In the last radiological follow-up, 35 implants (11.7%) had bone gain, and 35 implants (11.7%) presented at least 3 mm of MBL. Twenty-six out of 86 failed implants with available radiograms presented severe MBL in the last radiological register before implant failure.
Conclusions. Most of the implant failures occurred at the first few years after implantation, regardless of a very long follow-up. MBL can be insignificant in long term observations, but it may, nevertheless, be the cause of secondary failure of oral implants in some cases.
Keywords
Dental implants; implant failure; risk factors; marginal bone loss, long-term follow-up, multivariate analysis
Introduction
Brånemark discovered the process of osseointegration in the 1960s and placed the first dental implant about 50 years ago.1 Since then dental implants supported by evidence-based data became an increasingly viable alternative to conventional prosthodontic treatment options. Thousands of clinical studies on dental implants have been carried out and published. Most studies present data on implant and prosthesis survival, as well as on bone response adjacent to the implants. However, many of the studies are on a relatively short- or medium-term basis.2 There is an increase in the volume of dental implants being placed and follow-up is essential to determine and predict a future clinical course. The patients receiving implants expect to keep them for years ever, and therefore it is more reliable to have a basis for dental implants prognosis with long follow-up studies.
During the first decades of osseointegration, the most commonly used implant in the world was the turned (“machined”) Brånemark implant. This implant design showed quite good long term data with survival rates in the mandible above 90% and in the maxilla above 80% for a follow up time of 5 years or more.3-5 Having said this, there were some problems reported in soft maxillary bone6, 7 and the old Brånemark implants showed less good clinical results if loaded prematurely or used in form of short implants.8 Another problem was reported with Brånemark implants; that of substantial marginal bone loss allegedly leading to disease entitled “Peri-implantitis”. Roos-Jansåker et al.9 initially defined disease around oral implants based on bleeding on probing and >1.8 mm of marginal bone loss at 9-14 years of follow up; they reported 6.6% of their Brånemark implants with disease. Fransson et al.10 saw any bone loss after the first year if combined with bleeding on probing and pus to be synonymous to implant disease and reported 12.4% of their 5-20 years followed up Brånemark implants with such problems.
These early reports of disease may not have survived the scrutiny of time,11 but previous reports have focused on the importance of careful monitoring of implant marginal bone loss as one way of documenting their long term performance.3, 12 The latter authors reported that a successful
implant would maximally lose 1 mm of bone during the implant´s first year in function and less than 0.2 mm annually thereafter. Implants losing more bone would not be successful, but may certainly survive and function in the bone of the patient.
The purpose of the present study was to assess the dental implant failure rates and marginal bone loss (MBL) of patients followed up for a minimum of 20 years. By selecting such a long follow up time of implants placed at one specialist clinic in Malmö, the included implants are indeed old turned Brånemark ones (n=1025) and a very small number of turned Astra implants (n=20).
Materials and Methods
Materials. This retrospective study was based on all 2,670 patients provided with implants, consecutively treated on a routine basis at one specialist clinic (Clinic for Prosthodontics, Centre of Dental Specialist Care, Malmö, Sweden) during the period from 1980 to 2014. The study protocol was approved by the regional Ethical Committee, Lund, Sweden (Dnr 2014/598; Dnr 2015/72).
Definitions. An implant was considered a failure if presenting signs and symptoms that led to implant removal. Thus, a failed implant in our study is equal to a lost implant. The failures were classified into two types: (1) implants lost due to lack/loss of osseointegration and (2) fractured implants. Primary failures were those occurring until/at the day of the 2o stage surgery (abutment connection).
For the implants that were lost, we considered as severe MBL at least 1.0 mm of bone loss per year or a minimum bone loss of 1/3 of the implant’s full length in the last radiological register before the failure of an implant. That does not mean that, for example, an implant of 15 mm would take an approximate time of 15 years to fail. An implant could have lost a considerable amount of peri-implant bone under a short period of time – loss of 8 mm of vertical bone in 5 years, for example – that, together with other factors, would condemn the permanence of the implant in the site.
Inclusion and exclusion criteria. Only implants placed in patients followed up for at least 20 years were included. Patients with all modern types of threaded implants with cylindrical or conical
design were included. Zygomatic implants were not included in the study, as well as implants detected in radiographies, but without basic information about them in the patients’ files.
A number of 300 implants were randomly selected for MBL. Only implants not lost and with baseline radiographs taken within 12 months after implant placement and with a minimum of 10 years of radiological follow-up were considered for MBL. Negative values correspond to bone loss. The marginal bone around the failed implants was also assessed.
Data collection. The dental records of all patients ever treated with implants in the aforementioned clinic were read in order to collect the data. The data were directly entered into a SPSS file (SPSS software, version 23, SPSS Inc., Chicago, IL, USA) as the files were being read. The following data were collected:
(a) Implant-related factors: implant diameter and length;
(b) Site-related factors: implant jaw location (maxilla/mandible), anterior or posterior location of the implant (sites from right canine to left canine teeth were considered anterior location), and bone quantity and quality of the implant sites, which were classified at the time of surgery according to the Lekholm and Zarb13 classification;
(c) Patient-related factors: patient’s sex, age of the patient at the implant insertion surgery, general health, and behavioral history. The presence of a medicament list in the patients’ records was also use to correlate the use of certain drugs to specific health conditions. Health factors assessed: diabetes types I or II, hypertension, hypercholesterolemia, hypothyroidism, asthma, chemotherapy, and irradiation of the head-neck region. The patients were also classified according to the intake of the following medication types: antidepressants, immunosuppressives, bisphosphonates, antithrombotic agents (antiplatelet, anticoagulant, thrombolytic drugs), hormone replacement therapy in women, and medicaments to reduce the acid gastric production. Behavioral factors assessed: smoking habits, use of snuff, bruxism;
(d) Other factors: prescription of antibiotics (the prophylactic antibiotic regimen was usually starting 1-2 hours before surgery and going from 5-7 days postoperatively), bone graft procedures,
type of implant-supported prosthetic restoration (single crown, partial bridge with 2-6 prosthetic elements, partial bridge with 7-10 prosthetic elements, full-arch, overdenture), number of days until failure, and follow-up time.
As the standard protocol in the clinic, the patients’ dental hygiene was followed up by a dental hygienist within 6 months after the final implant-supported/retained restoration. Each patient then attended a dental hygiene recall program based on individual needs.
Marginal bone level evaluation. Reproducible intra-oral radiographs were used. When there were no available digital radiographies from the baseline appointment, the analogue periapical radiographies were scanned at 1200 dpi (Epson Perfection V800 Photo Color Scanner; Nagano, Japan). Marginal bone level (MBL) was measured after calibration based on the inter-thread distance of the Nobel implants (0.60 mm). Measurements were taken from the implant-abutment junction to the marginal bone level, at both mesial and distal sides of each implant, and then the mean value of these two measurements was considered. MBL was calculated by comparing bone-to-implant contact levels to the radiographic baseline examination. The Image J software (National Institute of Health, Bethesda, USA) was used for all measurements.
Statistical analyses. The mean, standard deviation (SD), and percentage were calculated for several variables. The Kolmogorov–Smirnov test was performed to evaluate the normal distribution of the variables, and Levene’s test evaluated homoscedasticity. Differences between groups were compared with the student’s t-test or Mann-Whitney test for continuous variables, depending on the normality. Survival analyses were performed. A life table was presented with cumulative survival rate (CSR), besides Kaplan-Meier analysis. Correlation and linear regression were performed to check the relationship between MBL and time of follow-up. An implant-level model was performed in order to assess the effects of the implant-related and local bone factors on the implant failures, also including health variables. A generalized estimating equations (GEE) method was used to account for the fact that repeated observations (several implants) were available for a single patient. All models were adjusted for clustering of subject and implants in a binary logistic regression model using GEE with a
binomial distribution and a logit link function, while assuming an exchangeable working correlation structure. Initially a univariate GEE on each of the variables was performed. In order to verify multicollinearity, a correlation matrix of all of the predictor variables with a significant odds ratio (P-value cut-off point of 0.1) identified in the univariate GEE was scanned, to see whether there were some high correlations among the predictors. Collinearity statistics obtaining variance inflation factor (VIF) and tolerance statistic were also performed to detect more subtle forms of multicollinearity. Then a multivariable model with a forced entry method was used to evaluate the effect of the factors that were univariately significant (P<0.1) and didn’t present multicollinearity. A Wald chi-square test was used to analyze the statistical significance of each parameter within the model. The results of the final model were presented as an estimated OR of each significant prognostic variable (P<0.05). SPSS software version 23 (SPSS Inc., Chicago, IL, USA) was used for the statistical analyses.
Results
Overall, 642 of 10,096 implants (6.36%) failed. A number of 95 men (405 implants) and 132 women (640 implants) were followed up for at least 20 years and were included for analysis in the present study. The patients were followed-up for a mean±SD of 291.0±33.7 months (min-max, 244.4-437.5). These patients received 1,045 threaded implants with a cylindrical design - 1025 Nobel turned and 20 Astra turned implants. Fifty-eight patients presented 131 implants failures, 116 due to loss/lack of osseointegration and 15 failed fixtures due to implant fracture. The maximum number of implant failures in one patient was nine. Failures were recorded for 130 Nobel implants and 1 Astra implant. The failures happened at a mean±SD of 54.3±67.0 months (min-max, 1.2-294.7) after implant insertion. The exact date of failure of 8 implants was not known; these failures were confirmed when these implants were no longer in place in subsequent radiograms. Nineteen failures happened before the abutment connection. 499 implants were installed in maxillae, of which 92 (18.4%) failed (82 due to loss/lack of osseointegration, 10 fractured implants), and 546 implants were
placed in mandibles, of which 39 (7.1%) failed (34 due to loss/lack of osseointegration, 5 fractured implants).
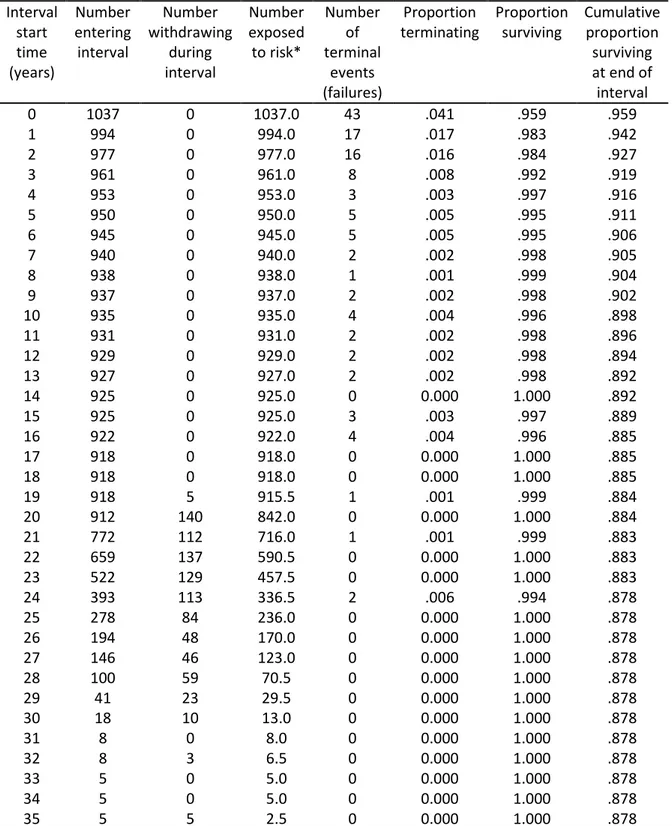
Table 1 shows a comparison of groups according to the distribution of implants with regard to Lekholm and Zarb13 classification of bone quantity and quality. A greater percentage of failed implants were placed in bone sites having been classified as quantities D and E and bone quality 4. Table 2 shows the life table for implant fracture. Thirty-five percent of the occurrences of failed implants occurred within the first year after implantation. Another 26.8% of the failures occurred in the second and third year after implant insertion. Thus, 59.3% of all failures occurred at the first three years after implantation. There was a CSR of 87.8% after 36 years of follow-up. Figure 1 shows the Kaplan-Meier analysis. No censored cases were observed before 20 years of follow-up, as only these cases were included in the present study.
All implants were inserted with open flapped surgery and had a delayed loading. Only 5 implants were inserted in fresh extraction sockets. The abutment connection surgery was performed after a mean±SD healing time of 167±56 days. The mean length of the inserted implants was 12.4±2.7 mm and the mean diameter for was 3.74±0.09 mm.
Seventy-four implants were used for single-crown restorations (3 failed due to loss/lack of osseointegration, 5 fractured implants), 242 implants for fixed partial prostheses of 2-6 prosthetic elements (23 failed due to loss/lack of osseointegration, 4 fractured implants), 25 implants fixed partial prostheses of 7-10 prosthetic elements (7 failed due to loss/lack of osseointegration, no fractured implants), 666 implants for full-arch fixed prostheses (69 failed due to loss/lack of osseointegration, 6 fractured implants), and 33 implants to support overdentures (9 failed due to loss/lack of osseointegration, no fractured implants). There was no information for 5 implants concerning the type of prosthodontic restoration performed.
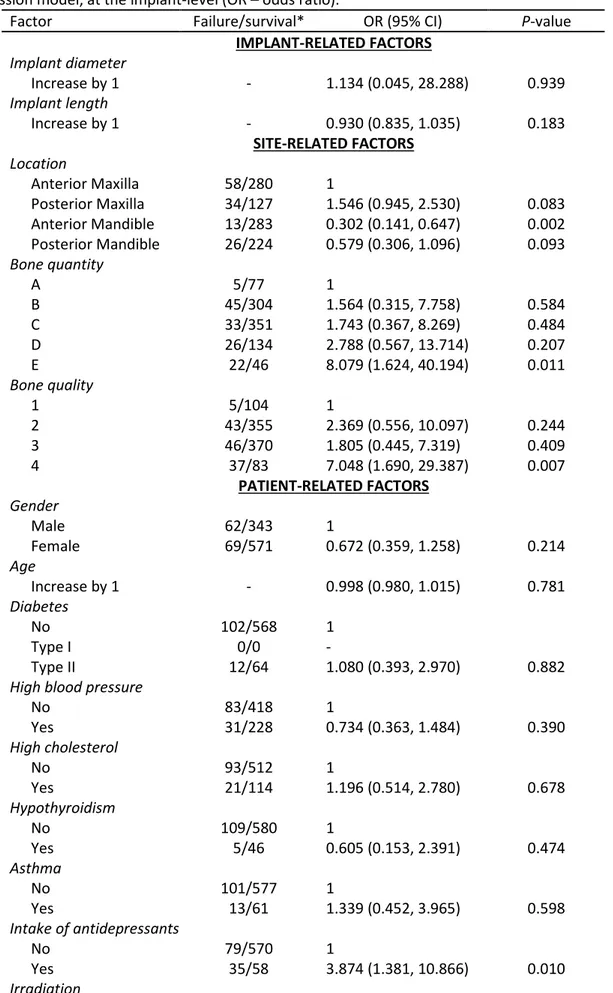
The univariate GEE model at the implant-level showed that the following predictors had a statistically significant odds ratio at the implant-level (Table 3): location, bone quantity and quality, the intake of antidepressants, irradiation, the intake of medicaments to reduce the acid gastric
production, bruxism, and the type of implant-supported prosthetic restoration. The following factors remained statistically significant in the multivariate GEE model (Table 4): location, irradiation, and bruxism.
Of the 4,691 implants that were placed until December 31st 1996, and then could theoretically reach the minimum of 20 years in the year of 2017, 2,762 implants (58.88%) were placed in patients that were deceased by the first day of the year of 2017. Of these 2,762 implants, 2,402 (86.97%) were placed in patients who died before a hypothetical 20-year follow-up. Patient referral to other clinics and other reasons accounted for 884 of the unaccounted for implants.
With regard to the MBL around the 300 randomly selected implants, all Nobel turned implants, 1948 measurements were performed, considering the several radiological follow-ups for each implant. This resulted in a mean of 6.5 MBL measurements per implant. Each MBL measurement consisted of a mean value of mesial + distal measurements. A number of 1032 MBL measurements were performed for the 152 implants in the maxilla and 916 MBL measurements for the 148 implants in the mandible. The baseline radiograms were taken at a mean±SD of 7.0±2.4 months (min-max, 0-12) after implant placement. The implants were radiologically followed up for mean±SD of 244.8±54.8 months (min-max, 127.2-350.2). At the last follow-up, there was a mean±SD MBL of -1.405±1.504 mm (min, max; -7.955, 1.442) for all implants (n=300). These values at the last follow-up were -1.391±1.691 mm (min, max; -7.955, 1.442) for implants placed in maxillae (n=152), and -1.419±1.289 mm (min, max; -7.128, 0.858) for implants placed in mandibles (n=148). The difference in MBL between implants placed in different jaws was not statistically significant at the last radiological follow-up (p = 0.176, Mann-Whitney test). The last radiological follow-up was performed at a mean±SD of 258.9±54.0 months (min-max, 123.1-350.2) for implants placed in maxillae and 229.4±52.7 months (min-max. 127.2-336.8) for implants in mandibles. This difference in the mean last follow-up between different jaws was statistically significant (p < 0.001, Mann-Whitney test).
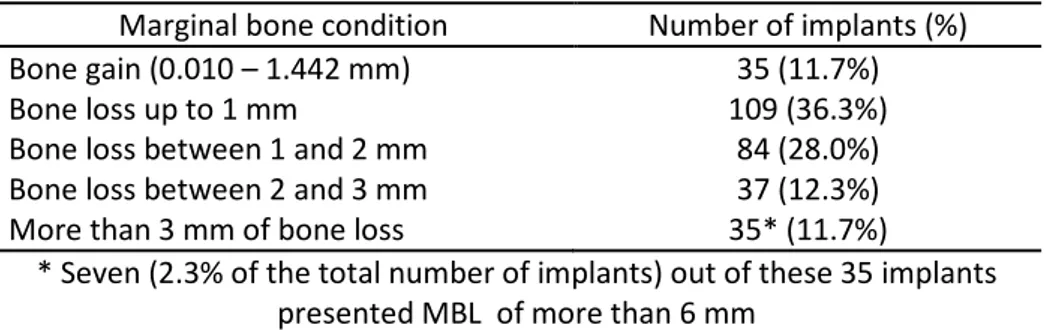
In the last radiological follow-up (Table 5), it was observed that 35 implants (11.7%) had bone gain (min-max 0.010-1.442 mm), 109 implants (36.3%) displayed up to 1 mm of MBL, 84 implants (28%) showed a MBL between 1 and 2 mm, 37 implants (12.3%) a MBL between 2 and 3 mm, and 35 implants (11.7%) with at least 3 mm of MBL, of which 7 implants (2.3%) presented MBL of more than 6 mm. It is important to stress that these 300 implants randomly selected for MBL measurements were among the implants that were not lost.
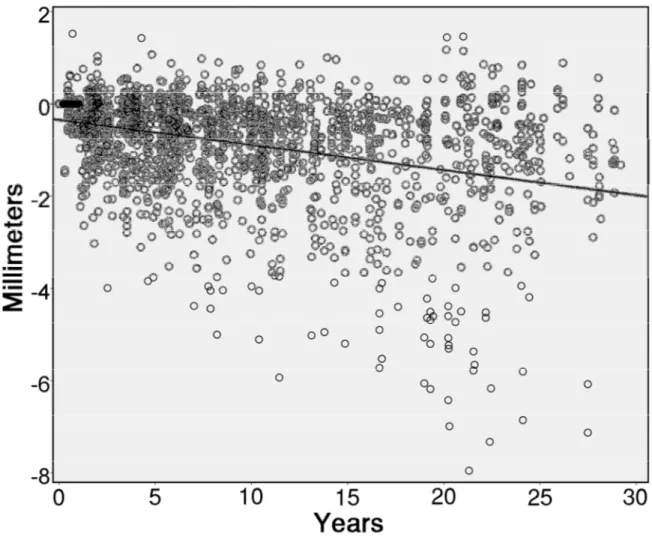
Figure 2 shows a scatter plot of all 1948 MBL measurements, showing that there is an estimated trend to loss bone with time, reaching 1.98 mm of bone loss 30 years after implant installation. The linear regression equation (y = -0.35 – 0.00453x) estimated a loss of 0.00453 mm of bone for every additional month of follow-up. MBL was moderately associated to the follow-up time (R = -0.358, R2 = 0.128, p < 0.001, Pearson correlation).
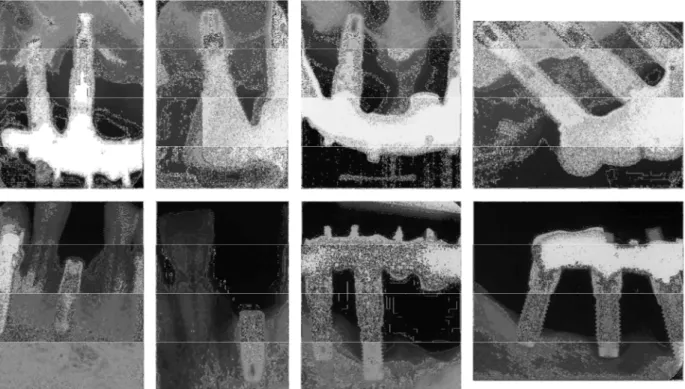
The marginal bone around the 131 failed implants was also assessed. The radiological follow-up protocol at the clinic did not include the register of a radiogram at the implant placement day, beginning at the abutment connection day only. Thus, it was not able to evaluate the marginal bone condition around some implants, due to lack of radiograms, because they failed before the abutment connection (primary failures). In other cases, some patients received several implants, but the first radiological register of the implants was carried out only after abutment connection. These cases that presented no radiological register of the failed fixtures accounted for 37 implants. Then, of the 131 lost implants, 86 implants had available radiograms: 131 total implants – 8 implants with unknown date of failure – 37 implants without radiograms = 86 implants with radiograms. Twenty-six out of these 86 implants with radiograms presented severe MBL. Figure 3 shows radiograms of some examples of implants with advanced MBL found in the present study.
Discussion
The results of the present study showed that most of the implant failures occurred at the first few years after implantation, regardless of a very long follow-up. The regression analysis performed
in this study tried to identify the factors that could possibly be related to implant failure. The univariate regression assessed the relationship between each independent variable and implant failure separately, and the multivariate regression assessed the relationship of the variables that were univariately significant to implant failure, controlling for each other. The negative factors identified by the multivariate GEE model were implant location, irradiation, and bruxism. The improved survival rate of implants placed in the anterior mandible in relation to the anterior maxilla may be related to the usually improved bone quality and greater bone volume found in the anterior mandible, even years after teeth extraction in this region.14 When it comes to irradiation, it has been shown that it negatively affects the survival of implants,15 which is mostly related to the deleterious long-term effects of irradiation on the bone vascularization16 and bone-healing capacity,17 compromising the implantation site. Concerning the patients’ habits, bruxism was shown to significantly affect the implant failure rates negatively, agreeing with the results of the two very recent clinical trials assessing the effect of bruxism on dental implants.18, 19 Bruxism is suggested to generate overload of prosthetic rehabilitations on implants, which could possibly cause implant fracture or peri-implant marginal bone loss, ultimately resulting in implant failure.20 Implant fractures noticed in the present study may further be related to the use of grade 1 titanium which is a less strong material than presently used grade 3-4 titanium.
About 12% of the implants in this study displayed more than 3 mm of marginal bone loss. However, this observation must be balanced against the observation that hexed Brånemark implants display an average of 1 mm of marginal bone loss already at 1 year of follow up, although the five year bone loss figures of the same implants indicated a relative steady state with respect to further bone loss.4 In contrast, implants with internal couplings instead of hexes only demonstrated an average 5-year bone loss of about 0.2 mm.4 Furthermore, an average marginal bone loss of more than 3 mm need not represent disease or other clinical problems as indicated by Jemt et al.21 These authors21 followed up what happened to the implants of the study by Fransson et al.22, and reported that 91.3% of the implants saw no significant further bone loss after another 9.1 years (average) of
follow-up, i.e. a total follow-up in the 20-year range. A total of 95.4% of the implants with progressive bone loss were still functioning as part of support for dental bridges at 20+ years of follow-up. Thus, the original bone loss as mentioned in the Fransson et al.22 paper was not predictive for future ongoing bone loss. Based on these figures, it is obvious that one cannot judge disease on a millimeter report of bone loss. In addition, Coli et al.23 have recently questioned the relevance of using probes as criteria for disease around oral implants.
The number of unaccounted for implants was quite high in the present report. However, when patients who died or were just referred to other clinics are concerned, these reasons for drop out are unlikely to skew the present analysis. It must be remembered that the Malmö clinic originally was the only implant active unit in the region, therefore when new clinics started with implants at a later time, it was quite natural that those clinics took over the controls of some patients.
The total failure rate of the Malmö material has been reported to 6.36%. However, this failure rate is presumably greater in reality since some implants controlled at other clinics may have failed too. However, overall oral implants fare quite well, despite some of them seeing marginal bone loss of 3 mm of more. Although peri-implantitis was not the topic of the present paper, it is tempting to conclude that the prevalence of peri-implantitis, including ongoing bone loss as a prerequisite, is likely to be rather low.
Conclusions
Most of the implant failures occurred at the first few years after implantation, regardless of a very long follow-up. Implants in different jaw locations, irradiation, and bruxism were the factors suggested to affect the long-term survival of implants. Marginal bone loss can be insignificant in long term observations, but it may, nevertheless, be the cause of secondary failure of oral implants in some cases.
Acknowledgements
Funding and support: This work was supported by research funds from the Oral Health Related Research by Region Skåne (Odontologisk Forskning i Region Skåne, OFRS 414321), Sweden, and from the Scientific Research Council of Sweden (Vetenskapsrådet, Dnr 2015-02971). This work was supported by Folktandvården AB, Region Skåne, Sweden and by CNPq, Conselho Nacional de Desenvolvimento Científico e Tecnológico, Brazil.
Trial registration at the U.S. National Institutes of Health (clinicaltrials.gov): NCT02369562 Declaration of conflicting interests: There are no conflicts of interest to declare.
References
1. Brånemark PI, Adell R, Breine U, Hansson BO, Lindström J, Ohlsson A. Intra-osseous anchorage of dental prostheses. I. Experimental studies. Scand J Plast Reconstr Surg 1969; 3: 81-100. 2. Ekelund JA, Lindquist LW, Carlsson GE, Jemt T. Implant treatment in the edentulous mandible: a
prospective study on Branemark system implants over more than 20 years. Int J Prosthodont 2003; 16: 602-608.
3. Albrektsson T, Zarb G, Worthington P, Eriksson AR. The long-term efficacy of currently used dental implants: a review and proposed criteria of success. Int J Oral Maxillofac Implants 1986; 1: 11-25.
4. Jimbo R, Albrektsson T. Long-term clinical success of minimally and moderately rough oral implants: a review of 71 studies with 5 years or more of follow-up. Implant Dent 2015; 24: 62-69.
5. Lindquist LW, Carlsson GE, Jemt T. Association between marginal bone loss around osseointegrated mandibular implants and smoking habits: a 10-year follow-up study. J Dent Res 1997; 76: 1667-1674.
6. Adell R, Lekholm U, Rockler B, Brånemark PI. A 15-year study of osseointegrated implants in the treatment of the edentulous jaw. Int J Oral Surg 1981; 10: 387-416.
7. Jaffin RA, Berman CL. The excessive loss of Branemark fixtures in type IV bone: a 5-year analysis. J Periodontol 1991; 62: 2-4.
8. Brånemark PI, Hansson BO, Adell R, Breine U, Lindström J, Hallen O, Ohman A. Osseointegrated implants in the treatment of the edentulous jaw. Experience from a 10-year period. Scand J Plast Reconstr Surg Suppl 1977; 16: 1-132.
9. Roos-Jansåker AM, Lindahl C, Renvert H, Renvert S. Nine- to fourteen-year follow-up of implant treatment. Part II: presence of peri-implant lesions. J Clin Periodontol 2006; 33: 290-295.
10. Fransson C, Wennström J, Berglundh T. Clinical characteristics at implants with a history of progressive bone loss. Clin Oral Implants Res 2008; 19: 142-147.
11. Albrektsson T, Chrcanovic B, Östman PO, Sennerby L. Initial and long-term crestal bone responses to modern dental implants. Periodontol 2000 2017; 73: 41-50.
12. Albrektsson T, Zarb GA. Current interpretations of the osseointegrated response: clinical significance. Int J Prosthodont 1993; 6: 95-105.
13. Lekholm U, Zarb GA. Patient selection and preparation In: Brånemark PI, Zarb GA, Albrektsson Ts, eds. Proceedings of the Tissue integrated prostheses: osseointegration in clinical dentistry. Quintessence Publishing Company, 1985: 199–209.
14. Glauser R, Rée A, Lundgren A, Gottlow J, Hämmerle CH, Schärer P. Immediate occlusal loading of Branemark implants applied in various jawbone regions: a prospective, 1-year clinical study. Clin Implant Dent Relat Res 2001; 3: 204-213.
15. Chrcanovic BR, Albrektsson T, Wennerberg A. Dental implants in irradiated versus nonirradiated patients: A meta-analysis. Head Neck 2016; 38: 448-481.
16. Yerit KC, Posch M, Seemann M, Hainich S, Dortbudak O, Turhani D, Ozyuvaci H, Watzinger F, Ewers R. Implant survival in mandibles of irradiated oral cancer patients. Clin Oral Implants Res 2006; 17: 337-344.
17. Marx RE, Johnson RP. Studies in the radiobiology of osteoradionecrosis and their clinical significance. Oral Surg Oral Med Oral Pathol 1987; 64: 379-390.
18. Chrcanovic BR, Kisch J, Albrektsson T, Wennerberg A. Bruxism and dental implant treatment complications: a retrospective comparative study of 98 bruxer patients and a matched group. Clin Oral Implants Res 2016.
19. Chrcanovic BR, Kisch J, Albrektsson T, Wennerberg A. Bruxism and dental implant failures: a multilevel mixed effects parametric survival analysis approach. J Oral Rehabil 2016; 43: 813-823. 20. Lobbezoo F, Brouwers JE, Cune MS, Naeije M. Dental implants in patients with bruxing habits. J
Oral Rehabil 2006; 33: 152-159.
21. Jemt T, Sundén Pikner S, Gröndahl K. Changes of Marginal Bone Level in Patients with "Progressive Bone Loss" at Branemark System(R) Implants: A Radiographic Follow-Up Study over an Average of 9 Years. Clin Implant Dent Relat Res 2015; 17: 619-628.
22. Fransson C, Lekholm U, Jemt T, Berglundh T. Prevalence of subjects with progressive bone loss at implants. Clin Oral Implants Res 2005; 16: 440-446.
23. Coli P, Christiaens V, Sennerby L, Bruyn H. Reliability of periodontal diagnostic tools for monitoring peri-implant health and disease. Periodontol 2000 2017; 73: 203-217.
Table 1. Distribution of implants with regard to Lekholm and Zarb (1985) classification of bone quantity and quality. The number between parentheses represents failures.
A B C D E Total % Group** % Failed† 1 8 10 15(2) 60(1) 16(2) 109(5) 10.5 4.6 2 51(5) 162(21) 147(13) 19 19(4) 398(43) 38.1 10.8 3 21 158(18) 185(11) 46(15) 6(2) 416(46) 39.9 11.1 4 2 19(6) 37(7) 35(10) 27(14) 120(37) 11.5 30.8 Total 82(5) 349(45) 384(33) 160(26) 68(22) 1043(131) 100 12.6 % Group** 7.9 33.5 36.8 15.3 6.5 100 % Failed† 6.1 12.9 8.6 16.3 32.4 12.6
Missing information of bone quantity/quality: 2 implants, 0 failures
* According to the Lekholm and Zarb (1985) classification, bone quality is broken down into four groups according to the proportion and structure of compact and trabecular bone tissue: type 1 = large homogenous cortical/compact bone; type 2 = thick layer of compact bone surrounding a dense trabecular bone; type 3 = thin cortical layer surrounding a dense trabecular bone; type 4 = thin cortical layer surrounding a core of low-density trabecular bone. The quantity of jawbone is broken down into five groups (A, B, C, D, and E), based on the residual jaw shape following tooth extraction. Bone classified as ‘A’ presents the largest amount of bone among all classes, whereas bone classified as ‘E’ presents the lowest volume of bone.
** Percentage of implants in each bone quantity/quality class, considering all implants as 100% † Percentage of failed implants for each bone quan^ty/quality class
Table 2. Life table for implant failure. Interval start time (years) Number entering interval Number withdrawing during interval Number exposed to risk* Number of terminal events (failures) Proportion terminating Proportion surviving Cumulative proportion surviving at end of interval 0 1037 0 1037.0 43 .041 .959 .959 1 994 0 994.0 17 .017 .983 .942 2 977 0 977.0 16 .016 .984 .927 3 961 0 961.0 8 .008 .992 .919 4 953 0 953.0 3 .003 .997 .916 5 950 0 950.0 5 .005 .995 .911 6 945 0 945.0 5 .005 .995 .906 7 940 0 940.0 2 .002 .998 .905 8 938 0 938.0 1 .001 .999 .904 9 937 0 937.0 2 .002 .998 .902 10 935 0 935.0 4 .004 .996 .898 11 931 0 931.0 2 .002 .998 .896 12 929 0 929.0 2 .002 .998 .894 13 927 0 927.0 2 .002 .998 .892 14 925 0 925.0 0 0.000 1.000 .892 15 925 0 925.0 3 .003 .997 .889 16 922 0 922.0 4 .004 .996 .885 17 918 0 918.0 0 0.000 1.000 .885 18 918 0 918.0 0 0.000 1.000 .885 19 918 5 915.5 1 .001 .999 .884 20 912 140 842.0 0 0.000 1.000 .884 21 772 112 716.0 1 .001 .999 .883 22 659 137 590.5 0 0.000 1.000 .883 23 522 129 457.5 0 0.000 1.000 .883 24 393 113 336.5 2 .006 .994 .878 25 278 84 236.0 0 0.000 1.000 .878 26 194 48 170.0 0 0.000 1.000 .878 27 146 46 123.0 0 0.000 1.000 .878 28 100 59 70.5 0 0.000 1.000 .878 29 41 23 29.5 0 0.000 1.000 .878 30 18 10 13.0 0 0.000 1.000 .878 31 8 0 8.0 0 0.000 1.000 .878 32 8 3 6.5 0 0.000 1.000 .878 33 5 0 5.0 0 0.000 1.000 .878 34 5 0 5.0 0 0.000 1.000 .878 35 5 5 2.5 0 0.000 1.000 .878
* The exact date of failure was unknown for 8 implants. Therefore, they were not considered here. If these 8 lost implants were included in the present life table, the CSR would be lower
Table 3. Risk factor analysis using a univariate generalized estimating equations (GEE) logistic regression model, at the implant-level (OR – odds ratio).
Factor Failure/survival* OR (95% CI) P-value
IMPLANT-RELATED FACTORS Implant diameter Increase by 1 - 1.134 (0.045, 28.288) 0.939 Implant length Increase by 1 - 0.930 (0.835, 1.035) 0.183 SITE-RELATED FACTORS Location Anterior Maxilla 58/280 1 Posterior Maxilla 34/127 1.546 (0.945, 2.530) 0.083 Anterior Mandible 13/283 0.302 (0.141, 0.647) 0.002 Posterior Mandible 26/224 0.579 (0.306, 1.096) 0.093 Bone quantity A 5/77 1 B 45/304 1.564 (0.315, 7.758) 0.584 C 33/351 1.743 (0.367, 8.269) 0.484 D 26/134 2.788 (0.567, 13.714) 0.207 E 22/46 8.079 (1.624, 40.194) 0.011 Bone quality 1 5/104 1 2 43/355 2.369 (0.556, 10.097) 0.244 3 46/370 1.805 (0.445, 7.319) 0.409 4 37/83 7.048 (1.690, 29.387) 0.007 PATIENT-RELATED FACTORS Gender Male 62/343 1 Female 69/571 0.672 (0.359, 1.258) 0.214 Age Increase by 1 - 0.998 (0.980, 1.015) 0.781 Diabetes No 102/568 1 Type I 0/0 - Type II 12/64 1.080 (0.393, 2.970) 0.882
High blood pressure
No 83/418 1 Yes 31/228 0.734 (0.363, 1.484) 0.390 High cholesterol No 93/512 1 Yes 21/114 1.196 (0.514, 2.780) 0.678 Hypothyroidism No 109/580 1 Yes 5/46 0.605 (0.153, 2.391) 0.474 Asthma No 101/577 1 Yes 13/61 1.339 (0.452, 3.965) 0.598 Intake of antidepressants No 79/570 1 Yes 35/58 3.874 (1.381, 10.866) 0.010 Irradiation
No 112/625 1
Yes 2/3 4.255 (2.996, 6.043) <0.001
Hormone replacement therapy
No 117/744 1 Yes 9/22 2.111 (0.641, 6.956) 0.219 Gastric No 90/556 1 Yes 24/62 2.917 (1.161, 7.324) 0.023 Antithrombotics No 77/461 1 Yes 38/169 1.499 (0.743, 3.025) 0.258 Immunosuppressive No 111/612 1 Yes 3/10 1.513 (0.277, 8.246) 0.632 Bisphosphonates No 113/610 1 Yes 1/18 0.283 (0.048, 1.676) 0.164 Smoking No 65/405 1 Yes 42/164 1.397 (0.630, 3.096) 0.411 Former smoker 3/11 3.616 (0.618, 21.152) 0.154 Cigarettes/day Increase by 1 - 1.028 (0.983, 1.074) 0.229 Snuff No 106/567 1 Yes 4/13 1.356 (0.309, 5.953) 0.687 Bruxism No 79/583 1 Yes 37/50 4.414 (1.840, 10.590) 0.001 OTHER FACTORS Antibiotics No 12/87 1 Yes 51/358 0.754 (0.298, 1.908) 0.551 Bone grafting No 100/864 1 Yes 31/50 2.753 (0.753, 10.062) 0.126 Prosthetic restoration Single crown 8/66 1 Partial fixed, 2-6 units 27/215 1.007 (0.347, 2.921) 0.990 Partial fixed, 7-10 units 7/18 2.192 (0.371, 12.966) 0.387 Full-arch fixed 75/591 1.033 (0.387, 2.755) 0.948 Overdenture 9/24 4.686 (1.185, 18.528) 0.028
Table 4. Multivariate generalized estimating equations (GEE) logistic regression model at the implant-level. Only the factors that were considered statistically significant (P < 0.1) in the univariate model and didn’t present multicollinearity were included in the multivariate model (OR – odds ratio).
Factor OR (95% CI) P-value
Location Anterior Maxilla 1 Posterior Maxilla 1.388 (0.784, 2.458) 0.260 Anterior Mandible 0.264 (0.109, 0.643) 0.003 Posterior Mandible 0.488 (0.232, 1.030) 0.060 Bone quantity A 1 B 1.455 (0.392, 5.407) 0.575 C 1.078 (0.281, 4.142) 0.913 D 1.828 (0.435, 7.677) 0.410 E 3.412 (0.605, 19.241) 0.164 Bone quality 1 1 2 1.228 (0.318, 4.744) 0.766 3 0.713 (0.177, 2.878) 0.635 4 1.335 (0.285, 6.267) 0.714 Intake of antidepressants No 1 Yes 2.578 (0.813, 8.175) 0.108 Irradiation No 1 Yes 13.560 (6.058, 30.354) <0.001 Gastric No 1 Yes 2.097 (0.685, 6.416) 0.194 Bruxism No 1 Yes 2.800 (1.012, 7.748) 0.047 Prosthetic restoration Single crown 1 Partial fixed, 2-6 units 1.592 (0.448, 5.660) 0.473 Partial fixed, 7-10 units 0.520 (0.051, 5.315) 0.582 Full-arch fixed 1.788 (0.456, 7.016) 0.405 Overdenture 1.631 (0.314, 8.467) 0.561
Table 5. Marginal bone condition around 300 non-failed implants at the last radiological follow-up (mean of 244.8 months).
Marginal bone condition Number of implants (%)
Bone gain (0.010 – 1.442 mm) 35 (11.7%)
Bone loss up to 1 mm 109 (36.3%)
Bone loss between 1 and 2 mm 84 (28.0%)
Bone loss between 2 and 3 mm 37 (12.3%)
More than 3 mm of bone loss 35* (11.7%)
* Seven (2.3% of the total number of implants) out of these 35 implants presented MBL of more than 6 mm
Figure 2. Scatter plot of 1948 marginal bone loss (MBL) measurements of 300 implants. The line represents the estimated MBL along the years of observation, according to the linear regression.
Figure 3. Examples of cases of severe marginal bone loss around implants that were eventually lost or fractured.