An optimization model for group formation in project-based learning
Johan HolmgrenDepartment of Computer Science and Media Technology
Malmö University
johan.holmgren@mau.se
Zahra Ghaffari Department of Computer Science and Media Technology
Malmö University
zahra.ghaffari@mau.se
Radu-Casian Mihailescu Department of Computer Science and Media Technology
Malmö University
radu.c.mihailescu@mau.se
Abstract
We propose an optimization model to tackle the problem of determining how projects are assigned to student groups based on a bidding procedure. In order to improve student experience in project-based learning we resort to actively involving them in a transparent and unbiased project allocation process. To evaluate our work, we collected information about the students' own views on how our approach influenced their level of learning and overall learning experience and provide a detailed analysis of the results. The results of our evaluation show that the large majority of students (i.e., 91%) increased or maintained their satisfaction ratings with the proposed procedure after the assignment was concluded, as compared to their attitude towards the process before the project assignment occurred.
1. Introduction
The project method is a commonly used teaching method, which provides the opportunity for students to develop their independence, responsibility, and social skills [1]. Pucher and Lehner [2] discuss some of the most central advantages and challenges of the project method, when it is applied in computer science education. In this context, the advantages of the project method include the opportunity for students to practice their technical knowledge, develop their programming skills, and develop their skills on working in a team and managing projects. There are also several challenges when practicing the project method, which include difficulties for the teacher(s) to manage a large number of projects and evaluating the results of the students’ project work. Other challenges include the lack of project management experience of the students leading to difficulties in the early project phase, varying student motivation levels, and varying supervision skills of
the teachers. In addition, Pucher and Lehner [2] report that the origin of the project is an important factor for the success of the students. In a review involving 500 projects, they find that students perform significantly better if they work with their own project ideas.
In the current paper, we focus on the type of multi-project-based courses where external actors, mainly companies, form the student projects. Due to limits on project size and already predefined topics, this type of course often face the problem of students being unable to secure a place in a project according to their preferences. As a consequence, students are often assigned to projects that they do not want to attend, hence having students disengaged and unmotivated [3]. Clearly, this may frustrate the students and deteriorate their performance and the outcome of the course.
As mentioned above, it has been showed in previous work [2] that the students’ performance tend to increase when they are allowed to develop their own project ideas. However, this is not possible in courses where external actors define the projects. For this situation, we instead hypothesize that the student engagement and motivation can be increased by actively involving them in the process of allocating students to the projects.
The allocation of students to projects according to their preferences is, however, a complicated task for the course management, since this task corresponds to solving a combinatorial optimization problem. A complicating factor is that it is typically important that all, or at least most, of the projects are assigned a student group. In addition, some of the projects are in general significantly more popular among the students, for example, due to being proposed by potential future employers (typically large companies), or being perceived as more fun and interesting. Since it is often difficult to identify enough interesting projects, the problem of varying project popularity is difficult to completely solve. In
addition, it might in some cases be difficult to predict the popularity of the defined projects.
We have studied the problem of how it is possible to improve the students' engagement, hence their learning, by giving them a central role in the assignments of tasks in multi-project-based courses. In particular, we contribute an optimization model, which can be used to identify the optimal assignment of students to projects, taking into account their preferences of projects, as well as their particular skills. We have developed and applied the optimization model within a bachelor level software engineering project course at Malmö University, Sweden. The proposed optimization model enables to involve the students in a transparent and unbiased project allocation process.
By simplifying the process of finding the right constellation of students for each of the projects, we argue that the proposed approach is an enabler for increased motivation of the students taking a multi-project-based course. In addition, an important goal of this work is to support the long-term relations between the university and the surrounding society. We believe that this might be accomplished by the collaboration that naturally comes in courses where students work with tasks proposed by external actors. Good project results, achieved by highly motivated students may contribute to improved relations with external partners, which is important for the development of the university as a driver for societal development.
In the next section, we give a brief account on related work, followed in Section 3 by a description of our methodological approach. In Section 4 we describe our mathematical optimization model, followed in Section 5 by an overview of our student communication activities. In Section 6 we describe the data collection that was done within our study and in Section 7 we present the analysis of our results. The paper is finalized in Section 8 with our conclusions and some directions for future work.
2. Related work
According to Trowler [4], student engagement has been discussed since 1990 and a lot of effort has been made to achieve increased student engagement and student learning, see, for example, the work of Kuh [5] and Trowler [4]. Trowler further mentions that student involvement has been subject for attention by Astin since 1984. There are different perceptions on whether the student engagement is more important than the student involvement. Harper [6] argues that the reason that engaged students manage to improve their achievement is that they are
driven by the emotions that are activated by being engaged. Furthermore, Trowler argues that engaged students are involved in activities that generate high-quality learning.
During the recent years, there are several studies focusing on the use of advanced technology in education in order to improve the students’ motivation and learning performance. For example, Scrivner et al. [7] study the use of augmented reality as a teaching tool to improve student learning and teaching. Subramainan et al. [8] argue that students with high motivation tend to enhance their learning outcomes and propose an emotional based model, which they animate using agent based social simulation. In this way, they manage to measure the student engagement levels and the emotions of the lecturer and students.
Optimization has been used for many years to achieve improved academic planning including scheduling and administration. Dyer & Mulvey [9] propose using network optimization in order to assign the faculty members to the academic activities for the Graduate School of Management at UCLA. They use their algorithm to schedule an academic year, taking into consideration the faculty members’ priorities and preferences. Frederickson and Pratt [10] use constraint optimization in order to increase the quality of accounting graduates focusing on the employer’s demand for competencies. In particular, the outcome of model is claimed to be useful in order to organize research on accounting, provide recommendations for accounting educators, and identify research problems for the accounting researchers. Lilja Eiriksdóttir [11] presents an optimization model for assigning teachers to classes considering equality and quality. The evaluation of the model indicates that the proposed model is useful in order to ensure the quality of the education. Furthermore, Lambić et al. [12] use a mathematical optimization model in order to assign students to project groups containing four members each. In a comparison, their results indicate that optimization based assignment leads to significantly better study results than student chosen, or random, assignment.
In the current work, we propose an optimization approach, where we actively involve the students in the process of project group formation, utilizing on their preferences and skills. In particular, it should be emphasized that the main difference compared to the study by Lambić et al., which is the study most similar to ours, is that we used different model input and a different model solution process. Our study also differs from a methodology perspective, as we actually carry out the whole process from assignment of groups until project completion.
3. Method
As mentioned above, we conducted our study within a bachelor level software engineering project course at Malmö University, Sweden. The course comprised 7.5 ECTS credits and it was given during the period March 27-June 4, 2017. The course was taken by 100 second year computer science students belonging to three computer science Bachelor's programmes at Malmö university: Computer systems developer, computer science and application development, and information architect. The course involved 11 external companies/customers who defined 15 unique projects to which students should be allocated. However, two of the projects were duplicated, as we required each project to have 5-7 students, giving us 17 project groups. The course was managed using the learning platform Itslearning (see https://itslearning.com/).
In order to complete our study, we followed a stepwise approach including the following activities, each of which will be discussed in some more detail below:
• Step 1: Formulation of optimization model. • Step 2: Student communication (presentation of
all required information).
• Step 3: Collection of optimization model input data, i.e., project descriptions, student
preferences and student self-assessment. • Step 4: Solving the optimization model,
providing us with the student to project assignment.
• Step 5: Analysis.
Before formulating our optimization model (Step 1), we formulated the model requirements in an iterative process together with the coordinator of the course. This was important in order to make sure that we developed the right model for the course. Before the students provided their bids on the available projects, we communicated information about our project as well as the assignment process for the students (Step 2). As detailed below, we provided information both in an oral presentation and in written form on the learning platform used in the course. The data collection (Step 3) was conducted together with the course coordinator in order to make sure to fulfill both the needs of the course and the needs of our project. Based on all of the collected input data, we then solved our optimization model (Step 4) using the optimization problem solver ILOG CPLEX version 10.0. We then communicated the model output (i.e., the student-project assignment) to
the course coordinator, who implemented the generated assignment in the course. Finally, the course coordinator supported us to collect input, in the form of a student evaluation questionnaire that we used as part of our analysis (Step 5).
4. Optimization model
In this section, we present the optimization model that we developed within the project, and which aims to allocate students to a number of predefined projects in an unbiased way.
Mathematical optimization can be described as the process of using mathematical modeling and methods in order to find the optimal alternatives, or choices, in decision-making situations. An optimization problem, or decision problem, is expressed using decision variables, parameters, an objective function, and constraints. The decision variables represent the decisions, or choices, in the optimization model, and they typically take either integer or numerical values in specific ranges. The objective function of an optimization model defines how to evaluate possible solutions, that is, different assignments of values for the decision variables, to the optimization model. The constraints define the limitations on the allowed solutions to the optimization model. An optimization method searches for the best values of the decision variables of an optimization model. See, Lundgren et al. [13] for a comprehensive overview of mathematical optimization.
The objective of our optimization model is to make a student-project assignment that maximizes the preferences of the students, according to the bids they provide in a bidding process. However, the assignment is subject to a number of hard constraints, including that the number of students assigned to each project should be between a minimum and a maximum number of students, and some of the projects have requirements on particular skills that the assigned students need to have.
The objective of the optimization model is to maximize the total satisfaction level of the student group (according to their submitted bids). The objective function is formulated as
𝑀𝑎𝑥 𝑧 = 𝑢!"𝑥!" ! !!! 1 , ! !!!
where 𝐼 is the number of students, 𝐽 is the number of projects, and 𝑢!" is the provided utility for student
students were provided a number of utility points 𝑈, which they were asked to distribute on the projects according to their own preferences. For most students, the sum of the 𝑢!":s taken over the projects
(𝑝!, 𝑗 = 1, . . . , 𝐽) equals U.
Decision variable 𝑥!" (𝑠!, 𝑖 = 1, … , 𝐼 and 𝑝!, 𝑗 = 1, … , 𝐽) is used to decide whether student 𝑠! is
assigned to project 𝑝!, i.e.:
• 𝑥!"= 1 if student 𝑠!, 𝑖 = 1, … , 𝐼 is assigned to
project 𝑝!, 𝑗 = 1, … , 𝐽.
• 𝑥!"= 0 if student 𝑠!, 𝑖 = 1, … , 𝐼 is not assigned
to project 𝑝!, 𝑗 = 1, … , 𝐽.
The student to project assignment should follow a set of constraint sets, each of which is presented and explained below.
Constraint set (2), one constraint for each project, restricts the assignment so that each project (𝑝!, 𝑗 = 1, … , 𝐽) is assigned a least 𝑝!!"# and at most
𝑝!!"# number of students: 𝑝!!"#≤ 𝑥 !" ! !!! ≤ 𝑝!!"#, 𝑗 = 1, … , 𝐽 (2)
Constraint sets (3) and (4) models that at least 𝑞!"
students with at least skill level 𝑟!" (the threshold level) for special skill 𝑡! is assigned to project 𝑝!:
𝑣!"𝑥!"≥ 𝑟!"⋅ 𝑦!"#, 𝑖 = 1, … , 𝐼; 𝑗 = 1, . . , 𝐽; 𝑘 = 1, … , 𝐾 (3) 𝑦!"# ! !!! ≥ 𝑞!", 𝑗 = 1, … , 𝐽; 𝑘 = 1, … , 𝐾 (4) In constraint sets (3) and (4), 𝑣!" denotes the
knowledge level for special skill 𝑡!, 𝑘 = 1, … , 𝐾 that
was provided by student 𝑠!, 𝑖 = 1, … , 𝐼 (𝑣!"∈
0, … , 𝑣!"# ), 𝑟
!" is the skill level value (for special
skill 𝑡!) that should be met by at least 𝑞!" students assigned to project 𝑝!, 𝑗 = 1, … , 𝐽. All 𝑞!" has to be in the range 0, 𝑝!!"# . Decision variables 𝑦
!"#∈
0,1 , 𝑖 = 1, … , 𝐼, 𝑗 = 1, … , 𝐽, 𝑘 = 1, … , 𝐾 are binary decision variables that are used in order to model that a minimum number of students (𝑞!") with maximum
skill level for special skill 𝑡! should be assigned to
project 𝑝!, 𝑗 = 1, … , 𝐽.
The fifth constraint set (5) makes sure that each student is assigned to exactly one project.
𝑥!"
!
!!!
= 1, 𝐼 = 1, … , 𝐼 (5) It should be emphasized that the mathematical model to be solved when working with optimization modeling is typically an abstraction of the real-world problem under consideration. An important step in the optimization process (see [13]) is to make sure that the relevant aspects of the real-world problem is preserved in the mathematical model. To guarantee the relevance of the proposed optimization model, we involved the coordinator of the course in our case study when developing our optimization model. To further validate our model (see Section 7), we studied the model output for our case study, hence ensuring that the model delivers results that can be explained considering the skill levels and project utilities provided by the students.
5. Student communication
In order to inform the students about our project and the project assignment process, we continuously communicated with the students taking the course.
We published the following information on the learning platform used in the course (publication date within parentheses):
• A list of the required skill types for the projects (March 21, 2017). Please note that we did not present any skill level requirements for the projects at this point.
• Description of project assignment process (March 24, 2017).
• Written specifications of all project presentations (March 30, 2017).
• Optimization model and explanation of model (March 30, 2017).
• Project requirements, i.e., the required skill levels for all of the projects (March 30, 2017). As mentioned above, we formulated the project requirements on the form "at least 𝑥 students with at least skill level 𝑦" for all combinations of projects and skill types.
In a meeting with all students attending the course, we also presented the project and the project assignment process. This was done on March 30 before we uploaded the written project specifications, optimization model, and project requirements on the learning platform. Oral presentations of the companies’ projects were given on March 27, 2017 and March 29, 2017.
Please note that we published the mathematical optimization model presented above even though most of the students did not have the mathematical training required to completely understand the model in the form used above. The reason for publishing the model was to be transparent with the students, and it should be emphasized that we carefully explained the model and answered all of the student's questions about the model during the presentation. We also provided examples of how the model works.
6. Collection of input data
At an initial phase, that is, before the project allocation process was known by the students, we identified a number of skills that were required in the different projects. The identified skills were Java, Python, C#, C++, JavaScript, PHP, Android, HTML & CSS, and Web design. For each of the projects and each of the identified skills, the course coordinator specified a minimum requirement on skill levels of the students assigned to the projects. For a particular project 𝑝 and skill 𝑘 the minimum requirement was formulated as project 𝑝 should have at least 𝑞 students with a minimum skill level.
For each of the required skills, the students were asked to rank their own, perceived knowledge level according to the following scale:
• 0: None - Never used the technology.
• 1: Beginner - Knowledge and skills less than a 7.5 credit course (or equivalent).
• 2: Intermediate – Knowledge and skills corresponding to a 7.5 credit course (or equivalent).
• 3: Advanced – Knowledge and skills higher than a 7.5 credit course (or equivalent).
This was done before the projects and the project requirements were presented to the students, since we wanted to avoid students to strategically "cheat" the system by providing incorrect skill levels.
It should be further emphasized that student self-evaluation is a complicated task, considering that students might not be able to accurately assess their own skill level [14]. However, in some cases, the students have course credits corresponding to some of the required skills, in which case we find it reasonable to assume that the students’ self evaluations are rather accurate. Moreover, the aim of the self-evaluation is to get a rough indication of skill levels, to fulfill project demands that are also estimated, rather than getting an absolute value of the
students’ skills. Therefore, we consider that the students’ self-evaluations provide enough detailed information to be useful in our optimization model.
After we presented the projects (description and requirements for the identified skill levels), each of the students provided their scores for the projects by distributing 100 (utility) points on the projects. It should be mentioned that 11 students did not provide any bids, and we assigned the utility 0 for all of the projects for these students.
7. Analysis
In this section we present an overview of the quantitative analysis we performed based on the results obtained from carrying out the proposed assignment procedure in the second-year bachelor course at Malmö University. We evaluated our approach by conducting a post factum survey intended to assess the students’ attitudes before the assignment process and their satisfaction with the end result. The survey was completed by 68 of the students participating in the course. In the survey we asked the participants a mixture of i) open questions, where they could provide further comments and offer suggestions for improving the process, as well as ii) questions where they needed to provide a rating regarding different aspects of the process. From the latter category we here highlight two key questions: a. What was your attitude towards the project
assignment process before the assignment was made (that is, before you were assigned to a group)?
b. How satisfied are you with your allocated project?
The participants had to provide a rating on a scale of 1-5, where 1 denotes 'very dissatisfied' and 5 denotes 'very satisfied'. In Figure 1, we plot the students' ratings to questions a) and b), thus one point in this bi-dimensional space represents all students providing identical answers. Specifically, we plot the size of the points in the figure proportional to the number of students with those particular ratings. It is interesting to note that the majority of the student evaluations are distributed in the upper half of the figure, denoting that regardless of their initial attitude towards the project assignment procedure, the majority of participants (79%) rated the end result as satisfactory or very satisfactory. Moreover, it is important to emphasize that again, the large majority of students (91%), increased or maintained their ratings after the assignment was concluded, as compared to their attitude towards the process before
the project assignment occurred, while 71% strictly increased their rating.
Figure 1. Student feedback.
It should be further emphasized that evaluating satisfaction in retrospective can be questioned, as the current emotions might shadow the actual satisfaction level of the students [15]. However, as the satisfaction levels from the questionnaire (question b) are backed up by the “positive” outcome of the optimization model (see below), we are strongly convinced that the reported satisfaction correlates well with the actual satisfaction. Regarding the attitude towards the project allocation process before the assignment was made, the low scores (question a) are backed by the student attitude we experienced during the presentation and information meeting, which we arranged before the assignment was made. In this meeting, we learned that many students were afraid of the process. Due to lacking trust for the optimization model, many students expressed fear of not getting a project they were interested in.
To recall the reader, in order to assign students to different projects, each of the students were asked to distribute 100 utility points in a bidding process, reflecting their priorities of the chosen projects. In the next step we compared the student choices and the final project that the students were assigned to, in order to analyze the results.
The analysis of the bidding data shows that 89% of the students chose to submit bids and 11% did not attend. Of those 89% that submitted their choices, 75.3% got their first choice, 15.7% got their second choice, and 2.2% got their third choice.
Hence, 83 of the 89 students (i.e., 93.2%) who provided their bids received one of the top 3 priority projects. One of the students did not get any of their top priority projects due to having a special skill that was needed in one of the projects that were not among their higher priorities. The other five students who did not receive any of their top priority projects,
were allocated to lower priority projects due to high competition on their top choices.
In total, 91 of the students (i.e., 91%) submitted their skill levels. None of the 9 students that chose to not report their skill levels submitted any bids for the projects. Hence, there were 2 students who submitted their skill levels but who did not submit any project bids. Obviously, the 11 students not bidding were used in the assignment process to fill up the least popular projects to reach a minimum number of (5) students. This might have led to the least popular projects getting those students who do not seem to care about which project they work in, taking not bidding as a sign of not being interested. Assuming that these students care less about their studies could imply that a few, non-popular, projects gets weaker students than the more popular projects.
Furthermore, by looking at the bidding data, it was obvious that the students used different strategies. In Figure 2, we show how many students distributed their utility points on 0, 1, 2, … ,15 projects. In Figure 3, we present the number of bids for each of the projects. Further, for each of the projects, we present in Figure 4 the total number of utility points and in Figure 5 the average number of utility points per bid. As mentioned above, 11 students did not submit any bids, 20 students put all their 100 points on only one project, 10 students bid for two projects, 26 students bid for 3 projects, and 23 students bid for 4 projects. Only few students bid for more than 5 projects.
Figure 2. Number of students bidding for
𝟎, 𝟏, 𝟐, ⋯ , 𝟏𝟓 bids in the bidding process. According to the student satisfaction survey after completion of the course, we had a follow up discussion with the course coordinator, who also expressed that it was convenient to have a transparent procedure in place. According to the coordinator, only one of the students approached him and showed dissatisfaction about the assignment. As the
assignment process was transparent for the students, and the process takes into account the students' preferences, it can be argued that the assignment to a large extent is due to the students bidding process (including their chosen strategies).
Figure 3. Number of bids per project.
Figure 4. Total number of utility points for each of the projects.
Figure 5. Average number of utility points per bid for each of the projects.
According to the course coordinator, the companies involved in the project course expressed their satisfaction at the project presentations sessions
by the students. Many of the companies were back the following year with new project ideas and are willing to work together with the students and Malmö University.
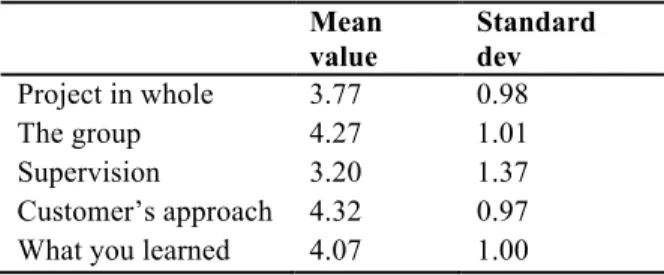
We also analyzed the final course evaluation survey, which had a 56% response rate. According to the course evaluation, the students were quite satisfied with the course. In Table 1 we summarize the students satisfaction levels considering the group, supervision, customer's approach, and what they learned. All answers were provided using the scale 1-5, where 1 denotes 'very dissatisfied' and 5 denotes 'very satisfied'.
Table 1. Summary from course evaluation regarding group, supervision, customer's
approach, and learning level. Mean value Standard dev Project in whole 3.77 0.98 The group 4.27 1.01 Supervision 3.20 1.37 Customer’s approach 4.32 0.97 What you learned 4.07 1.00
In order to gain a better understanding on the performance of our optimization model, we pay special attention to the instances where some of the students did not get any of their highest priority projects. This also gives us some important input for future work. Henceforth, in the interest of anonymity, we will refer to students according to their indexing number used by the optimization model. In particular, the following students did not get any of their top 3 priority choices: 47, 55, 59, 65, 71, and 86.
• 47: The strategy employed was to put almost “all eggs in the same basket”: 90, 5, 2, and 3. High skill levels in both python and JS, but none of these were scarce.
• 55: The student bid everything on one project, which was very popular as 9 other students also bid all their credits on that same project.
• 59: The strategy was to bid “a little bit here and a little bit there”. Although the student had high skills in Android and Java, these skills were not scarce with respect to the other students.
• 65: This student had high skills in C#, which was rather scarce. He was allocated to a project with high requirements for C#, but which he did not vote for.
• 71: This student voted 65 on his most prioritized project, but there were other students voting 100 points on that same project.
• 86: This student distributed most of the points on two rather popular projects, 56 and 31 respectively. The remaining credits were too few to get his third choice.
Having provided an explanation for these ‘worst-case’ scenarios, it is important to remind the reader that the allocation procedure is in fact a competitive setting over scarce resources (that is, available projects), with the goal of maximizing student satisfaction, within the given project constraints, reflected by minimum skill level requirements. This is evident from Figures 2-5, which depict the fact that there is a clear discrepancy in the way the projects were rated by the students (e.g. project 3 appears to be a very popular choice with over 35 bids, while project 1 received only 5 bids, with an average bid below 10 points). At the same time, this points towards possible variations of the model that we discuss in the following section.
8. Conclusions and Future Work
To conclude, the results show that 93.2% of the students who provided their bids received one of the top 3 priority projects, out of which 75.3% got their first choice. This in turn, determined that the large majority rated the outcome as ‘satisfactory’ and ‘very satisfactory’. This is in contrast with the common situation in project-based courses where students often end-up assigned to projects which they do not want to attend, therefore having students disengaged and unmotivated. As a result, on the one hand, our proposal is focused on improving the students' learning by active student involvement and on the other hand, running projects achieved by highly-motivated students may contribute to improved relations with external partners, which is important for the development of the university as a driver for societal development.
A key take-away from running our study in a project-based course is that the information (student communication) is very important and we learned that approaching students with an assignment approach they were not used to could create suspicion, leading to discussions. In fact, as we have presented in the analysis, the majority of students showed a high satisfaction level after the assignment was concluded, as compared to their rather low attitude towards the process before the project assignment occurred.
With regards to the analysis presented in Section 7, we list below several possible future developments of our optimization model:
One could let the model decide which projects should be duplicated (from a list of possible duplications). In our case, the decision about which projects to duplicate was taken by the course coordinator according to the companies’ feedback for supervising a secondary project.
Another interesting aspect has to do with the model’s objective function. Currently the goal of the model is to maximize the aggregated student satisfaction level; however, we did not provide any guarantees for worst-case scenarios. In this sense, one could let the model minimize dissatisfaction at the same time as maximizing the satisfaction level and provide a tunable parameter to balance this tradeoff.
We also emphasize the fact that the proposed procedure is generic enough to be easily adapted and transferred to other project-based courses carried out at our faculty. Moreover, we envision this proposal to apply to other faculty related issues such as distributing thesis supervisors and examiners to students or allocating thesis topics to students, as a more systematic manner to handle situations where a scarce resource is disputed by several individuals.
9. Acknowledgment
The presented research study was funded as a pedagogical development project by Malmö University. We would express our great thanks to Farid Naisan, who was coordinating the project course within which we conducted our project. Without his collaboration and support, the project would have not been possible to conduct.
10. References
[1] M. Knoll, “The project method: Its vocational education origin and international development,” Journal of
Industrial Teacher Education, vol. 34, no. 3, 1997.
[2] R. Pucher and M. Lehner, “Project based learning in computer science a review of more than 500 projects,”
Procedia - Social and Behavioral Sciences, vol. 29, pp.
1561–1566, 2011. The 2nd International Conference on Education and Educational Psychology 2011.
[3] L. Helle, P. Tynjälä, E. Olkinuora, and K. Lonka, “ain’t nothin’ like the real thing. Motivation and study processes on a work-based project course in information systems design,” British Journal of Educational Psychology, vol. 77, pp. 397–411, 2007.
[4] V. Trowler, “Student engagement literature review,”
The Higher Education Academy, vol. 11, pp. 1–15, 2010.
[5] G. D. Kuh, “Assessing what really matters to student learning inside the national survey of student engagement,”
Change: The Magazine of Higher Learning, vol. 33, no. 3,
pp. 10–17, 2001.
[6] S. R. Harper, Institutional seriousness concerning Black
male student engagement: Necessary conditions and collaborative partnerships. Bepress, 2009.
[7] O. Scrivner, J. Madewell, C. Buckley, and N. Perez, “Augmented reality digital technologies (ardt) for foreign language teaching and learning,” in 2016 Future
Technologies Conference (FTC), pp. 395–398, 2016.
[8] L. Subramainan, M. A. Mahmoud, M. S. Ahmad, and M. Z. M. Yusoff, “A conceptual emotion-based model to improve students engagement in a classroom using agent-based social simulation,” in 2016 4th International
Conference on User Science and Engineering (i-USEr), pp.
149–154, 2016.
[9] J. S. Dyer and J. M. Mulvey, “An integrated optimization/information system for academic departmental
planning,” Management Science, vol. 22, no. 12, pp. 1332– 1341, 1976.
[10] J. R. Frederickson and J. Pratt, “A model of the accounting education process,” Issues in Accounting
Education, vol. 10, no. 2, p. 229, 1995.
[11] I. Lilja Eiriksdóttir, “Optimization model for assigning teachers to classes,” Master’s thesis, Reykjavik University, Iceland, 2016.
[12] D. Lambić, B. Lazović, A. Djenić, and M. Marić,, “A novel metaheuristic approach for collaborative learning group formation,” Journal of Computer Assisted Learning, vol. 34, no. 6, pp. 907–916, 2018.
[13] J. Lundgren, M. Rönnqvist, and P. Värbrand,
Optimization. Studentlitteratur, 2010.
[14] S. V. Paunonen and T. A. O’Neill, “Self-reports, peer ratings and construct validity,” European Journal of
Personality, vol. 24, no. 3, pp. 189–206, 2010.
[15] L. J. Levine, V. Prohaska, S. L. Burgess, J. A. Rice, and T. M. Laulhere, “Remembering past emotions: The role of current appraisals,” Cognition and Emotion, vol. 15, no. 4, pp. 393–417, 2001.