Improving Supply Networks – identifying drivers for
sustainable change using process models
Raine Isaksson – PhD, Senior Lecturer, Gotland University - raine.isaksson@hgo.se
Mathias Cöster – Phd, Senior Lecturer, Gotland University – mathias.coster@hgo.se
Abstract
Both within the private and public sector Change Management is a frequently discussed topic. How to lead change for increased sustainability is of interest for all organisations, but also for supply chains and supply networks. For any structured change process there are a few prerequisites, such as understanding the actual position and being able to assess it and to compare it with a goal. With an identified improvement potential it should become possible to devise a strategy for change. One way of describing supply networks is to use process based system models including performance indicators. The research question is if system models can be used to clarify improvement opportunities and in that way become drivers for change. In this conceptual paper we apply the value per harm measurement concept for three different systems and compare the results with what is commonly known and understood.
Introduction
Changing organisations and supply chains towards an increased sustainably is not an easy task. Still, both rapid and dramatic change is needed to change the many unsustainable practises of today. Senge et al (2008) present some guidance in the book “The Necessary Revolution – How Individuals and Organizations Are Working Together to Create a Sustainable World”. An important thing is seeing the complex reality in all its depth. According to Senge et al. (2008) there are sequentially four ways to explain reality, Events, Patterns & Trends, Systemic Structures and Mental Models. Change on an individual and group level could be seen to follow the five steps of: Understanding, defining, measuring, communicating and leading change, (Isaksson & Hallencreutz 2008). Kotter (1996) describes an eight step method of change starting with the creation of a sense of urgency. This indicates that in addition to understanding the five steps of change there also need to be a driver that increases the urgency of those involved. It could be argued that needs for a more sustainable development are obvious and that threats such as global heating, an increasing world population and loss of biodiversity should be enough to create an urgency. However, Kotter (2008) warns for a false sense of urgency, where there is no consensus of what to do or in words of Senge (1990) there is no shared vision. Even if most of us agree that current development is not sustainable we seem to struggle for finding a common understanding of how to define sustainable development in practical terms. The value per harm concept interpreted as stakeholder value per stakeholder harm could be used as an overarching performance indicator (Isaksson & Hallencreutz, 2008), (Isaksson & Steimle, 2009). With an accepted performance indicator it should be possible to use it to define an improvement potential by comparing actual performance with best performance. Isaksson & Steimle (2009) propose definitions for sustainability and sustainable development relating to the value per harm concept. Sustainability is viewed as a state and sustainable development as a rate of improvement. A clearly presented potential in terms of required level of improvement and required speed of improvement could possibly work as a driver for change. Isaksson (2006) proposes process based system models that describe any organisational process and the change of them. The question is if the value per harm concept in combination with a process based system model can be used for complex networks in such a way that they can visualise
change opportunities. Or, in other words, can the use of these models act as drivers for change?
Methodology
The process based system models from Isaksson (2006) and Isaksson et al. (2008) are applied in three different systems using the value per harm concept. The main stakeholders are chosen and main value and harm indicators for state and change are identified. The resulting structure and its explanatory power are discussed. At a later stage these will be tested with respondents familiar with the reviewed systems. The extent of new information produced is used as a preliminary indication of the usefulness of the models.
The three cases chosen are wind power generation in Sweden, quality and improvement management education in Sweden and global cement production.
The three cases are chosen partly because of the familiarity they present to the authors, but also because they represent important areas where change is needed.
Theory background
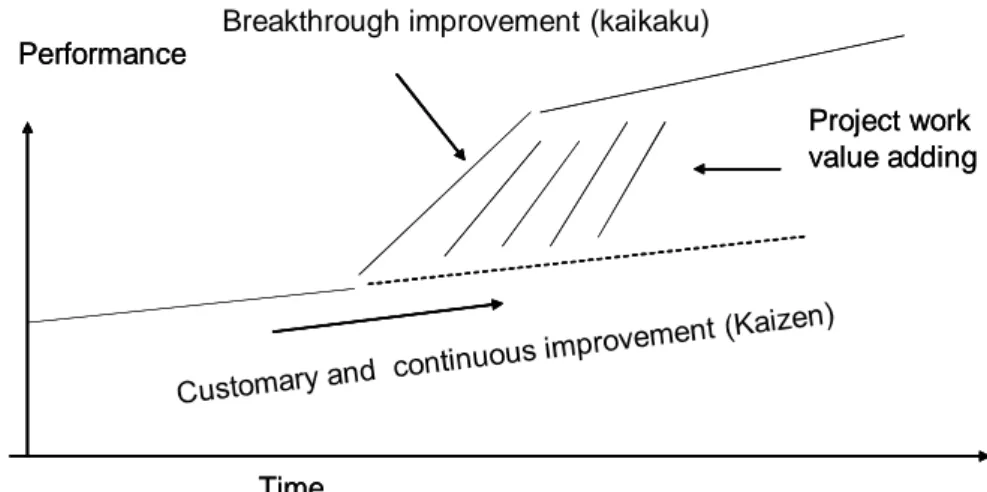
Change could be seen as planned and organic change, which takes place in parallel processes, (Hallencreutz, 2009). The reasoning is that change can never be fully controlled. This could be compared with technical processes where performance constantly varies over a time depending on random variation and variation due to assignable causes. This highlights the importance of correctly assessing the causal dependencies between change initiatives and consequences. In Japanese quality literature there is a differentiation between the small continuous incremental changes (kaizen) and the planned breakthrough changes (kaikaku). In Figure 1 an interpretation of how an organisational situation could be described.
Figure 1. Interpretation of a typical situation in an organisation going through planned change.
The organic change normally makes the situation in Figure 1 more blurred. Performance would be going up and down due to random external factors, but also due to successful and unsuccessful ongoing projects. To understand an organisation or a supply network as a system we need models both for the situation in a specific time t as well as models for how the change is managed. “Focus on processes” is a core value of TQM that relates to methodologies such as Process Management, (Bergman & Klefsjö, 2003). There are many
Time Performance Project work value adding Time Performance Project work value adding Breakthrough improvement (kaikaku)
process definitions with a similar content. One of the more brief ones is from ISO 9000. A process is:
Any activity or set of activities that uses resources to transform inputs to outputs can be considered a process – (ISO 9000:2000).
Process management can be defined as:
Process Management is a systematic methodology to organize, manage and continuously improve the processes of an organization (Egnell, 1996).
Processes can be described as flows or as consisting of different types of processes, such as management, main and support processes, (Bergman & Klefsjö, 2003). In order to describe all important activities of a process it could be argued that resources should be found in the process model used, especially when entire organisations are described as processes. In Figure 2 a process model that includes different types of processes and resources (Isaksson & Garvare, 2003), (Isaksson & et al., 2008).
Figure 2. Generic process based system model, adapted from Isaksson et al. (2008).
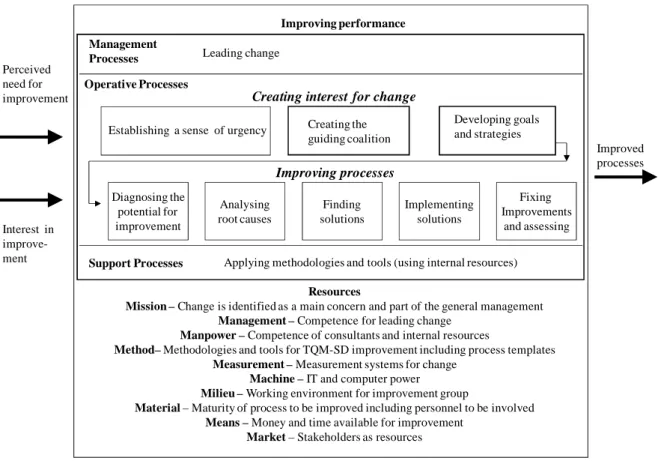
The model is intended for describing performance in a defined point in time. Generic resources are described using a check list based on 10 M-words, see examples in Figure 3. Two important support processes are mentioned in Figure 2, improving performance and measuring performance. The support process improving performance provides a link from the system description to a change model. For managing change there are a number of models. One of the well known is the 6Sigma-one consisting of Define-Measure-Analyse-Implement-Control (DMAIC). Isaksson (2006) proposes a similar model linked to the system model with the addition of the stage of creating interest for change, see Figure 3. In most organisations and supply networks there would be plenty of opportunities for improvement, but not always the interest due to lack of drivers for change. This indicates that when looking at a system it is important to assess the strength of drivers. Here, a method for assessing the sense of urgency emphasised by Kotter (1996) should be of importance.
Input
Management processes
Support processes
Improving performance Measuring performanceExternal resources
Producing goods and
services
Resources – 10M
Drivers
The model in Figure 3 includes the first three steps of Kotter’s eight state model as a description of the process of creating interest for change, (Kotter, 1996). This equals strengthening the drivers for change in the system model in Figure 2. The format used for Figure 2 is practically the same as for Figure 3 and shows a box in the box approach where processes can be described at different levels.
Figure 3. Generic improvement process, adapted from Isaksson (2006).
It could be argued that presenting a clearly defined improvement potential with solvable causes could act as a driver for change that increases the sense of urgency. This indicates that carrying out a brief opportunity study based on diagnosis-analysis-finding solutions (see Figure 3) could be used to attract management attention. In the context of sustainable development the challenge is to identify a Triple Bottom Line based indicator that is measurable and understandable and which can be used to demonstrate opportunities. The value per harm concept where sustainability is defined as stakeholder value compared to stakeholder harm presents one option (Isaksson & Hallencreutz, 2008), (Isaksson & Steimle, 2009). Instead of recording the three dimensions separately a ratio is created between main value and the main environmental harm as well as between the main value and the social harm. The objective is maximising value per harm done without subjecting any of the stakeholders in the system to excessive harm. An example of this would be to choose world GNP as the main value and world carbon dioxide emissions as main harm resulting in the Key Performance Indicator (KPI) of GNP/t CO2. This enables defining the global current position
and a target. The maximum CO2-emissions are limited by the objective to limit global heating
to +2C increase. The GNP-target can be set based on objective for poverty reduction. Johnson & Isaksson (2010) assess the current performance to about 2000 US$/t CO2 and the target in
2050 to 40000 US$/t CO2. The current level of development has not been assessed but a target
improvement rate corresponding to True Sustainable Development would be about +1000US$/t and year. Most likely current progress is not up to this and is therefore not sustainable.
Management
Processes Leading change
Perceived need for improvement
Improved processes
Support Processes Applying methodologies and tools (using internal resources)
Operative Processes
Establishing a sense of urgency Creating the Developing goals and strategies guiding coalition
Interest in improve-ment
Creating interest for change
Improving processes Fixing Improvements and assessing Implementing solutions Finding solutions Analysing root causes Diagnosing the potential for improvement Improving performance Resources
Mission – Change is identified as a main concern and part of the general management Management – Competence for leading change
Manpower – Competence of consultants and internal resources
Method– Methodologies and tools for TQM-SD improvement including process templates Measurement – Measurement systems for change
Machine – IT and computer power Milieu – Working environment for improvement group
Material – Maturity of process to be improved including personnel to be involved Means – Money and time available for improvement
Wind power generation in Sweden
Wind power seems to be a good source of energy having a low carbon footprint. It should therefore be of interest to realise the existing potential for it as soon as possible. The era of wind power in Sweden could be seen to have been started 1980 with the building of two large pilot plants. As late as 2003 the level of wind power generated energy was only 0.63 TWH or well below 1% of the total energy production in Sweden. In 2009 the level had increased to 2.5 TWh, which is equal to 1.9% of Sweden’s total energy production of 134 TWh. Sweden is planning for expanding wind power energy production so that it year 2015 will correspond to 10 TWh. The Swedish national energy agency is asking for plans on establishments of wind power plants that will have a capacity to contribute with an annum energy production of 30TWh (Swedish energy agency 2010, Eon 2010).
Figure 4. Wind power generation in Sweden, actual (until 2009) and scenarios.
Yearly TWh could be chosen as a key value indicator. Provided the use of wind power is assessed being a good solution, then using it to the level of limitations as soon as possible should be advantageous. Figure 4 shows a difference in realization when looking at two extrapolations consisting of best performance and expected performance. The value of a quicker than expected realization of full wind power use (the maximum has in Figure 4 been set at 30 TWh) could be translated into savings in fossil fuel and carbon emissions. This makes it possible to compare saved carbon emissions in comparison with work for more effective and quicker change.
The question is how main harm could be presented. This probably requires an assessment of stakeholder needs. One harm component that could be of interest is the cost of generation that at least up to now has been higher than production from hydro power and nuclear power. When evaluating wind power investments it is necessary to be able to also compare them to investments in other energy sources. That requires some kind of key ratio that holds a base of comparison (Catasús et al., 2008). From a financial perspective it is of interest to find out the cost for investing in wind power. A key ratio for measuring this could therefore be real cost/TWh of capacity installed or when expressed as value per harm the inverse of this as generating capacity per cost. Real cost could be seen as investment cost + subsidies + taxes. Taxes in this case could be partly negative in the case of a tax or cost on carbon emissions. However, an indicator for new generating capacity per investment costs only enables a momentary view; it doesn’t say anything about the costs in the long run. Therefore an
0 5 10 15 20 25 30 35 1980 2003 2009 2015 2020 2040 T W h p e r y e a r
Wind power generation in Sweden
Extrapolated Best
additional financial key ratio could be total generated TWh per life time cost of the system. Today a wind power plant is estimated to last for about 20 – 25 years. That generates costs for e.g. services and deconstruction of the plant. Also life time cost can be influenced by changes in regulations and taxes. Furthermore there exists an alternative cost when establishing a wind power plant. The area that is necessary for establishing the plant may be used for something else, e.g. farming or by the forest industry. Therefore it is of interest to optimize the amount of TWh generated compared to the area necessary for establishing the wind power units. This indicates a need for a ratio such as TWh generated by Sq km of land. Generally the area of land required could be a good indicator for harm done. When an area is designed for a wind power park, it probably is beneficial to maximize the TWh/ sq km. Technological development affects this, but there is a limit in the form of the total energy provided by wind in the area.
Costs are typical harm components, but there are other important ones such as the population perception of the feasibility of wind power both generally and specifically in the vicinity. There is an obvious risk for NIMBY – “wind power is OK but not in my backyard”. Population attitude towards wind power can be both a driver and a barrier. It is therefore of interest to device attitude indicators that can be related to for example information activities. From this brief discussion we can conclude that the main value indicator is the TWh generation for a designated area in a system. The main harm indicators could be the cost of TWh and the local population attitude towards wind power. Finding the potential requires that the maximum TWh generation for an area is defined respecting technical and economic limitations. The maximum TWh/year capacity is compared with the actual. The difference gives the magnitude of the current potential. Additionally the current speed of introduction needs to be compared to a benchmark speed of introduction as described in Figure 4. The maximum improvement potential is then defined as benchmark introduction based on a planned approach as compared to actual rate of improvement being a result of the partly planned and partly organic change. This is represented by the triangular area in Figure 4. Based on the example in Figure 4 the potential would be 125 TWh, which is about 90% of the yearly electrical power consumption in Sweden. This is a considerable potential. How this would relate to savings in carbon emissions is relatively complex and has not yet been assessed.
Quality and Improvement Management in Sweden
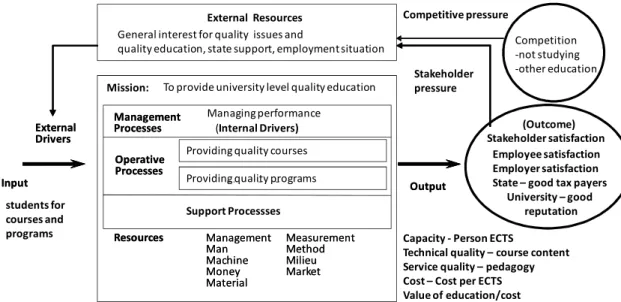
In internal discussions between university quality lecturers there is an understanding of that the need for education within the field of “Improvement Management” is important and that there would be substantial needs in increasing the quality and volume of this type of education. Isaksson et al (2007) claim that assessed needs in society would be up to five times the offering. However, generally interest for quality management has both internationally and in Sweden gone down since a peak during mid 90’s. The response has been to go into popular improvement programs such as Six Sigma and Lean Management that arguably contain a large quality and change management component. This has lead to some problems of defining what quality management actually is. This presents problems for marketing this to potential students as well as for development, research and co-operation. The potential in this case could be described as an increase of the national knowledge transfer process of change competence. This process is not charted, has no ownership and has no explicit KPIs, in spite of being of national importance. A tentative to describe the situation is presented in Figure 5.
Figure 5. The national quality education process, adapted from Isaksson et al. (2007).
The Value of education/cost mentioned in Figure 5 is a version of the value per harm concept. The problem is to quantify and measure the value. National course credits can be added up, but the question is how good the courses are in creating for example employer satisfaction. In a context of sustainable development where the employer is a good corporate citizen the expected value could be seen as change competence towards increased sustainability within the field of the organisation. Finding out the relevance of change courses could be done studying the performance of the former student in the job situation. Ljungblom & Isaksson (2008) present an example of a survey looking at how relevant and how used the content of leadership courses have been. It should be possible based on random testing to establish an indicator of the practical usability of the course content. This could then be combined with the quantity of courses and the value would be the product of relative quality of courses and the amount of student credits. Measuring the rate of improvement could be a challenge since this would require several measurements over a longer period of time. However, this could be done on an approximate level based on interviews and relying on historical information for quantity and content of change courses. A relevant question is where research is placed in the system model. Research on effectiveness and efficiency of change education could be seen as a support process in the system. This would need to be supported by the M resources such as Means (Money) for doing research, Methods for the research and Management of the research on a system level.
Another difficult question is what the benchmark should be. This could be related to organisational studies looking at the rate of performance improvement and to what extent a non optimal improvement is related to insufficient change competence. Isaksson et al. (2007) use an assessment from the 6Sigma change program that specifies the number of change specialists compared to the size of the organisation. When using this reasoning the conclusion is that current education only provides about 20% of the quantity needed where the quality of the content is not studied. This could indicate that there is a considerable potential in providing better change knowledge competence. The following statement is most probably still valid:
“There seems to be a potential for enlarging the Swedish university level education in quality management, but today the manifested demand is absent. This might partly be due to the difficulty of describing what quality management is, and how it can be used to improve
Input students for courses and programs
Output
Capacity - Person ECTS
Technical quality – course content Service quality – pedagogy Cost – Cost per ECTS Value of education/cost Stakeholder satisfaction (Outcome) •Employer satisfaction •Employee satisfaction •State •University Management Processes Operative Processes Managing performance (Internal Drivers) External Resources General interest for quality issues and
quality education, state support, employment situation
Stakeholder pressure Resources Management Man Machine Money Material Measurement Method Milieu Market Competitive pressure External Drivers
To provide university level quality education
Givingqualityprograms Input Output Stakeholder satisfaction (Outcome) Employee satisfaction Employer satisfaction State – good tax payers
University – good reputation Management Processes Support Processses Operative Processes Resources Management Man Machine Money Material Measurement Method Milieu Market Competition -not studying -other education External Drivers Mission:
Providing quality programs Providing quality courses
organisational performance. The proposed courses within this field are disparate and non-standardised, which makes it difficult for potential students to choose the appropriate courses.“, (Isaksson et al., 2007).
The data for the study was gathered in 2006, four years ago. This indicates a slow rate of improvement on a relatively low level of performance. The analysis of causes for the existing potential using the 9Ms, points at lack of management of the supply network and lack of methods for organising the supply network, (Isaksson et al.,(2007). The 10th M of Mission was not part of the previous analysis. Mission could be seen as having an agreed purpose among the main stakeholders and a vision of what should be achieved. This was apparently missing in 2006 and still seems to be missing in 2010. A mission for process based and quality management supported change for Sustainable Development could be seen as an ethical requirement for organisations that are aspiring to be good corporate citizens. Apparently universities generally and quality management particularly do not seem to recognise the ethical driver for change. Since 2004 there is a government decree requiring all educational entities including universities to work with sustainable development. Johnson & Isaksson (2010) look at how this has been interpreted in Swedish universities and conclude that even though Sustainable Development is mentioned frequently work seems mostly to focus on business as usual with some greenwashing. Focus is on doing things right, according to expectations and not really asking if the right thing is done, as in what education would be needed for providing future change agents. The origin of the problem could be that there is no agreed definition of what sustainable development is. If interpreted as value per harm, universities would have to rethink how they supply required competence for Sustainable Development. This would include more focus on providing change agents for Sustainable Development. The point is that it is how the core process provides stakeholder value and how this is improved in comparison to what harm is done that is of interest. Current focus seems to be more on business as usual with focus on how the harm component is reduced. This is like improving productivity by cutting costs only.
Value for the process of providing competence for improvement management could be measured using the product of quantity and quality of the education. The main harm component could be time used with the value per harm indicator becoming change competence increase per hours used. For this KPI to become a driver it needs to be backed up by more empirical research that improves the Measurement resource of the network. Additionally, results need to be presented in a forum with key persons that have a mandate to define a supply network mission. One test forum could be the recently started co-operation between quality management teachers in Sweden. However, even if sense of urgency would be created at this level this might not be enough since top management interest is needed. In this case top management would consist of key rectors for Swedish universities. Visualisation could be a precondition for driving change, but requires to be supported by ways of catching the ear of the top management.
Global cement production
Sustainability is of great concern to the cement industry with the main issues being the emission of carbon dioxide and the continuously increasing global demand for cement. The general assessment is that cement production is responsible for approximately 5% of the man made carbon emissions, which could be seen as the main environmental harm. New building activity is according to major building companies to 80-90% going to take place in the Third World. Many of the developing countries are poor and living space is insufficient. Further building activities are probably in most cases limited by the availability of money. From the
perspective of the poor person, the price of a product could be the most important harm, (Isaksson & Steimle, 2009).
Isaksson (2007) indicates that there could be a considerable improvement potential in better use of cement at the global level when assessed as customer value per carbon emissions and customer value per price.
Table 1. Improvement potential in reduced price and reduced carbon emissions in global
cement production, (Isaksson, 2007). Cement Mtons Price BiO US$ CO2 Mtons Comments
Actual 2000 164 1700 Assessed values
Benchmark 1500 95 1100 Based on equivalent MPa*tons
Difference -500 -70 -600
Difference in % -25% -42% -36%
The assessment in Table 1 is based on setting benchmarks for cement building value, carbon emissions and the price (based on benchmark cost of production). An assessed possible reduction of almost 40% of the carbon emissions per unit of customer value would at the global level indicate some 2% of reduction in global carbon emissions. This would indicate CO2 emission savings of some 600 Mt per year. Using the current cost for CO2 of about 20
Euro/t this would correspond to some 12 000 M Euro per year. The rate of realising this potential has not been studied, but indications are that the rate is far from being best performance improvement. The indicated improvement potential is not currently visualised since the value per harm concept is not extended to stakeholder value but only to shareholder value, (Isaksson & Steimle, 2009). The system problem could be seen to be in the common way that the Triple Bottom Line is dealt with, as separate dimensions, like in the Global Reporting Initiative (GRI) guidelines. Since the Cement Sustainability Initiative of the World Business Council for Sustainable Development (WBCSD) follows the GRI recommendations there is no incentive for the major cement producers to change their way of reporting. In this case, the indicators of building value per carbon emissions and building value per price could only be expected to attract some interest if organisations like WBCSD and GRI would be interested to review their definitions of sustainability and sustainable development.
Conclusions and discussion
The value per harm concept seems to present a promising way to highlight potential in terms of sustainability and sustainable development. By identifying the main value and main harm components in the studied system, ratios can be created that combine the TBL dimensions in a way which permits identifying a position (level of sustainability) and a direction (level of sustainable development), (Isaksson & Steimle, 2009). These indicators would in the first place be identified for process output, see Figures 2 and 5. Using the customised value per harm for the system in combination with a system benchmark enables to assess the level of existing potential and the speed to which this is being realised, see Figure 4. Using the value per harm indicators over time can be used to assess continuous and breakthrough improvement, see Figure 1. Performance at any time can be linked to system elements described in Figure 2. The question to be discussed was if visualisation of a system potential could act as a driver for change. The value per harm indicators can be used, at least in certain cases, to help understanding sustainability, to define it and to measure it. This enables a new way of communication. However, good forums for communication are needed to make the indicators drivers of change. The results only indicate that focusing on improvement opportunities highlighted with the value per harm concept could help in visualising previously
unnoticed potential. However, this does not automatically make the measurement innovation into a driver. Visualisation also requires an opportunity of communicating the new information to key persons. Based on previous tentative of presenting the value per harm concept it seems that in spite of the apparent simplicity of the concept, it does not immediately seem to lead to any changed perspectives or behaviour. It could be that the Mental Model of sustainability still is linked to environmental harm and that it is hard to change this picture to a ratio of value per harm.
The number of cases reviewed is limited. The concept has also been tested on mobile communications with results indicating process innovation in the form of improved visualisation, (Isaksson et al., 2010). It is still too early to say if value per harm could be an universal solution for operationalising sustainability and sustainable development. It seems that the concept can visualise facts in a way that reveals previously unknown potential. The presented systems need to be researched in more detail and the results need to be confronted with key persons of the studied systems to assess if the concept can act as a driver for sustainable change in combination with process based system models.
References
Catasús, B., Gröjer, JE., Högberg, O. Johrén, A. (2008) A book about key ratios (Boken om
nyckeltal). Liber AB: Malmö.
Egnell, P-O. (1996). Processledning: En arbetsmodell samt erfarenheter från svenska
organisationer (in Swedish). Arctic Software, Luleå Sweden.
Eon. 2010.”Wind power – renewable energy” (Vindkraft - förnybar energi) [Online] Available at:
http://www.eon.se/templates/Eon2TextPage.aspx?id=48857&epslanguage=SV. Hallencreutz, J. (2009). Models and Meaning. On management models and systems of
meaning when implementing change. Licentiate Thesis no. 36, Division of Quality
Management, Luleå University of Technology.
Isaksson, R. (2006). Total Quality Management for Sustainable Development – process based system models. Business Process Management Journal, Vol. 12, 5, 632-645.
Isaksson (2007). Product quality and sustainability in the cement industry – Proceedings of
the 12th International Conference on Cement Chemistry, Montreal, Canada, July 8-13.
Isaksson, R. & Garvare, R. (2003). Measuring sustainable development using process models.
Managerial Auditing Journal, Vol. 18, 8, 649-656.
Isaksson, R. & Hansson, J. & Garvare, R. (2007). National Process of Quality Management Education – The Swedish Example. The Asian Journal on Quality, Vol. 8, 2, p88-99. Isaksson, R. & Hallencreutz, J. & Garvare, R. (2008). Process Management and System-Thinking for Sustainable Development. The Theories and Practices of Organizational
Excellence: New Perspectives. Chapter 8, 205-232. (Ed. K.J. Foley et al.), Consensus Books,
Isaksson, R & Johansson, P. & Fischer, K. (2010). Detecting Supply Chain Innovation Potential for Sustainable Development. Accepted for the Journal of Business Ethics. Isaksson, R. & Steimle, U. (2009). What does GRI-reporting tell us about corporate sustainability? The TQM Journal, Vol. 21, 2, 168-181.
Johnson, M. & Isaksson, R. (2010). How to describe, define and work with sustainable development and how it relates to quality management – a study of Swedish Universities.
Proceedings of the 13th QMOD Conference On Quality and Service Sciences, 31st August –
1st September, 2010 Cottbus, Germany.
Kotter, J.P. (1996). Leading Change. Harvard Business School Press, Boston, Massachusetts. Ljungblom, R. & Isaksson, R. (2008). Teaching leadership for improvement – a case study in distance learning effectiveness. Proceedings of the 11th International conference on Quality
Management and Organizational Development, August 20-22, Helsingborg, Sweden.
Senge P. (1990). The Fifth Discipline. The Doubleday Publishing Group, New York.
Senge P., Smith, B. & Kruschwitz, N. (2008). The Necessary Revolution: How Individuals
and Organizations Are Working Together to Create a Sustainable World. The Doubleday
Publishing Group, New York.
Swedish energy agency, 2010. Wind power statistics 2009 (Vindkraftsstatistik 2009), ES
2010:03. [online] Available at:
http://www.energimyndigheten.se/sv/Energifakta/Statistik/vindkraftsstatistik/.