Research
2010:45
Evaluation of models for
Authors: Magnus Dahlberg Peter Segle
Title: Evaluation of models for cyclic plastic deformation – A literature study Report number: 2010:45
Author: Magnus Dahlberg and Peter Segle
Inspecta Technology AB
Date: December 2010
This report concerns a study which has been conducted for the Swedish Radiation Safety Authority, SSM. The conclusions and viewpoints presen-ted in the report are those of the authors and do not necessarily coincide with those of the SSM.
SSM Perspective
Background
Analysis of nuclear components subjected to cyclic plastic deformation is normally based on the American standard ASME III. With the focus to improve the modeling of the stress-strain response under non-monotonic loading, several models for the analysis of cyclic plastic deformation have been developed in recent years. However, experience shows that the analysis and evaluation of plastic cycling and its impact on component integrity is very complex.
Objectives of the project
The purpose of this study was to increase the understanding of material modeling and to examine the limitations and capabilities of some of the most commonly used models in cyclic plastic deformation.
Results
The results can be summarized as follows:
• The phenomenon ratcheting and shake-down are of central importan-ce in the design of components subjected to cyclic plastic deformation. •
The linear and multi-linear kinematic models are unable of repre-senting material ratcheting.
• The Chaboche model in its original form seems to have better capability, but also this model shows some limitations.
• Some of the most advanced models are more promising
• Further work is needed in order to set up guidelines and recom-mendations for analyses. These could serve as complements to the existing standards, such as ASME.
Effects on SSM
Table of content
SUMMARY 2
1 Introduction 3
2 Cyclic material behavior 4
2.1 The bauschinger effect and stable cyclic loops 4
2.2 Cyclic hardening and softening 6
3 Material ratcheting 10
3.1 Basic Behavior 10
3.2 Material ratcheting under complex loading conditions 13
3.3 Material ratcheting and cyclic softening 16
3.4 Multiaxial ratcheting 17
4 Models 18
4.1 Isotropic hardening 19
4.2 Kinematic hardening 19
4.3 Kinematic models in commercial FE programs, ANSYS and ABAQUS 20
4.3.1 Linear kinematic hardening (LKIN) 20
4.3.2 Multi-Linear kinematic hardening (Mroz) 20
4.3.3 Armstrong-Frederick (AF) 21
4.3.4 Chaboche model 22
4.3.5 AF model depending on field variables 22
4.4 Advanced kinematic models (presently non existent in commercial codes) 23
5 Structural ratcheting 24
5.1 Bree type ratcheting, type A 24
5.2 Structural ratcheting without primary stress, type B 27
6 Model capabilities 27
6.1 Material ratcheting 27
6.2 Model comparison for structures 31
6.2.1 Bree cylinder 31
6.2.2 Axially moving temperature distribution 32
6.2.3 Pipe structures 34
7 Parameter determination 42
7.1 Linear and multi-linear kinematic models (LKIN and MLKIN) 43
7.2 The AF and the chaboche model 43
7.3 Literature data 47
7.4 Parameter determination in absence of experimental data 51
8 Discussion 51
9 Recommendations 52
10 Acknowledgement 52
SUMMARY
Modeling of the elastic–plastic stress–strain response plays a central role in the design and failure analyses of engineering components. With the focus to improve the representation of stress-strain response under non-monotonic loadings, several models for cyclic plastic deformation have been developed in recent years. However, due to the great complication involved in cyclic plastic deformation, most of the existing models have limited capabilities to properly describe the
experimentally observed cyclic plasticity behavior. Hence, it is of interest to investigate the limitations and capabilities of the models that are being increasingly used in applications.
The phenomenon ratcheting and shake-down are central in the design of components subjected to cyclic plastic deformation. In ratcheting, there will be a progressive plastic deformation in contrast to shake-down where a stable response will be reached. Hence, the aim is to either show shake-down or show that the progressive strains remain limited within the prescribed load paths. Otherwise burst of the component or premature fatigue damage will occur. A common procedure in engineering cases has been to calibrate the model for stable stress-strain response only. This procedure has strong
limitations, since ratcheting and shake-down may be then very poorly predicted. Therefore, ratcheting effects should always be observed in parameter determination.
The distinction between material and structural ratcheting is instructive. In the classical case of thermal ratcheting, with a pressurized cylinder under cyclic thermal loading, ratcheting may occur without any influence of material ratcheting. Ratcheting is promoted by the non-homogenous stress distribution in the cylinder shell. However, experiments show that almost all materials show ratcheting behavior under even homogenous stresses, which implies that ratcheting is also a material property. In the design case where shake-down and ratcheting is of interest, awareness of the interplay of these effects is necessary and hence reasonably accurate material modeling is necessary.
This literature study shows the limitations of the most commonly used models. The linear and multi-linear kinematic models are unable of representing material ratcheting. Examples show that the Chaboche model in its original form has better capability, but is also shown to be severely limited. Some of the most advanced models are more promising, but still there exits basically no verification of the validity of any model for arbitrary, complex load paths.
The determination of model parameters and conditions for robustly conservative analyses are discusssed. It is suggested that further work is carried out in order to agree upon guidelines and recommendations. These recommendations could serve to complement the existing codes, such as ASME III.
1. INTRODUCTION
Cyclic plastic deformation is a phenomenon of practical interest in design of nuclear power plants. Many components are analyzed in order to establish the margins to failure where cyclic plastic deformations are involved. In fatigue cracking may occur due to a larger number of load cycles. Typical for fatigue is that the damage accumulates gradually. The time for crack initiation and the growth of smaller cracks may be long, whereas the time of growing larger cracks may be shorter with an accelerated growth. On a microscopic level, fatigue is always associated with cyclic plastic deformation. However, on the macroscopic level, i. e. the level where the analyses are performed, the material may respond entirely within the elastic range. Cyclic plastic deformation on the macroscopic level becomes increasingly important with higher load levels. A better estimation of the plastic strains will certainly increase the accuracy of the fatigue analysis.
Experiments show that the cyclic plastic characteristics of a metallic material are different from the monotonic. The difference may be large indeed, and monotonic experiments give hardly any information on the cyclic behavior. Using monotonic data in the analysis of the cyclic behavior of a component may lead to significant errors. Experimental determination of the monotonic behavior, and estimating the yield limit are regularly carried out. Reliable results on the yield limit and hardening behavior can be obtained with one rather simple experiment. The yield limit is then often used as a key parameter in design.
The undertaking of experiments on cyclic loads is scarce in comparison. The cyclic plastic behavior of metals is very complex, and any study will require a number of experiments in order to cover the several aspects. One such aspect is the cyclic hardening or softening of the material. The hardening behavior will change as the load cycles and the stress-strain behavior may become very different from the monotonic. Under certain conditions a stable response will be obtained after a number of cycles. Hence, cyclic stress-strain curves may be defined and expressed by mathematical relations. These relations are useful but applicable only under limited circumstances since the metal response is history dependent. Unique and repeatable cyclic stress-strain curves are obtainable only for samples with the same load history. Two samples tested with the same cyclic stress or strain may give different results depending on the load history. Prior higher loading may significantly alter the response.
An important design concern is the avoidance of progressive deformations that result from plastic deformation that occurs cycle by cycle. This drift may be small in each cycle but as the number of cycles grows the persistent deformations steadily increase. The design will finally burst or the deformation will accelerate the fatigue process as a consequence of the excessive deformations. All design codes have rules that should give safety margins against progressive deformations in order to obtain a state of shakedown. It is customary to define two types of shakedown states, one where the strains are entirely elastic or the other where cyclic plastic deformations occur without any
progression. The latter state is referred to as plastic shakedown, whereas the former is called is called elastic shakedown. The opposition of shakedown is called ratcheting. In ratcheting, the material continues to deform and does not shake down into a stable behavior. The reason for ratcheting can be structural where ratcheting occurs as a consequence of non-homogeneous load state, where
equilibrium and continuity will demand that the component deforms progressively. A typical example is the classical Bree cylinder. Most design codes, such as ASME, provides design rules against this type of ratcheting. However, most metallic materials exhibit ratcheting behavior at homogenous load states as well. Thus ratcheting behavior can also be seen as material property that does not require non-homogenous stress state.
This study will examine the limitations and capabilities of some of the most commonly used models in cyclic plastic deformation. The models are studied especially in view of the ASME III, NB 3228.4/41/, criterion that strains should never exceed 5% at any time during the load sequence. This criterion is given in order to secure margins against ratcheting if a plastic analysis is performed as an alternative to design by analysis. This type of analysis provides an opportunity to cut margins, but the demands for accurate modeling of cyclic plastic deformation will increase. This accuracy is investigated in this report.
2. CYCLIC MATERIAL BEHAVIOR
2.1 The Bauschinger effect and stable cyclic loops
The Bauschinger effect is central in cyclic plasticity. This effect denotes the characteristics of the cyclic stress-strain relation, with a hysteresis loop with the dissipation of energy at each cycle. Upon loading the yield strength is increased in the direction of the load, while simultaneously decreasing the yield strength in the opposite direction. In a purely cyclic load, i. e. no additional mean stress or strain, the effect will be evident. After a number of load cycles, a relatively stable cyclic relation is
approached, as shown in figure 2.1-1. Modeling the Bauschinger effect is essential for any model for cyclic plasticity, and it is noteworthy that this effect cannot be captured by traditional isotropic
models. Figure 2.1-1 shows a very schematic illustration of the Bauschinger effect, with the immediate appearance of a stable loop. A real case is shown in Figure 2.1-2.
Figure 2.1-2. The Bauschinger effect in a hysteresis loop for an austenitic material (van Eeten/14/). Note the difference between the initial cycle and the subsequent loops, which tend to stabilize after a
number of cycles.
One type of characterization of cyclic plasticity is obtained by the registration of stable Bauschinger loops at different load levels. Usually the strain is controlled. The load is cycled until a stable stress-strain response is registered for each load range. The load ranges are increased in a stepwise manner to determine the corresponding stable loops at each load level. Alternatively, a separate specimen is used for each load level, which will give equivalent results. The resulting relation between the saturated stress-strain ranges is sometimes expressed by a mathematical relation, on a form similar to that of Ramberg-Osgood: m p e K E 1 (%)
Eq. 2.1-1
Graphically, this relation can be constructed by adjoining the peaks of the loops. This is
shown in Fig. 2.1-3, with a comparison with the monotonic curve.
the material will depend much on the prior loads. Any overload will disturb the relation, as well as the introduction of non-symmetric loads. The cyclic behavior at a prescribed load is found to be
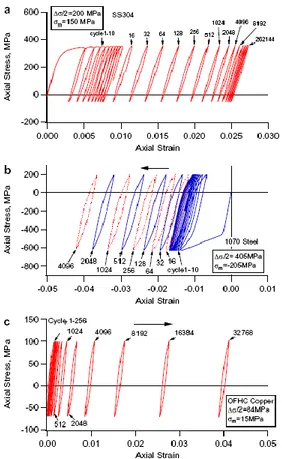
significantly altered previously higher strain ranges. This is sometimes termed the strain range effect. Furthermore, the equation of type Eq. 2.1-1 implies that there should be a linear relation between the stress range and the plastic strain range in the log-log diagram. This has been examined in some recent testing, ref. Jiang /23/.The experiments on SS304 readily show the limitations of Eq. 2.1-1, even at appropriate load sequences. The relation for the cyclic stress-strain ranges are far from linear, which is shown from Fig. 2.1-4. The curve of the stabilized loop tips shows the relation between the plastic strain range,
p, and stress range,
. This curve should be straight in Fig. 2.1-4 if Eq. 2.1-1 would be valid, which is obviously not the case.
Fig. 2.1-4. Stress-strain range relation for cyclic loads in SS304. The curve Stabilized Loop Tips should be linear in order for a Ramberg-Osgood relation to be accurate. (Jiang/23/)
2.2 Cyclic hardening and softening
In the previous section the concept stable cyclic loops was discussed. This shall be examined more in detail in this section. Most materials display more or less cyclic hardening (or softening). The
(relatively) stable loops are obtained after pronounced hardening in the first cycles. The level of hardening/softening can be examined by registering the stress level as a function of the number of cycles, with a load in strain control. The hardening behavior of a type 304 austenitic material is shown in Fig. 2.2-1 below. It is noted that some softening occurs at the low load levels, and the softening continues for rather high number of cycles. Significant hardening is shown for the higher loads, with amplitudes over approximately 1%.
Figure 2.2-1. The evolution of stress amplitude with the number of cycles for SS304. The load is fully reversed strain control, with the amplitude denoted at the end of each curve (Jiang /23/.) In order to demonstrate the history dependence it is very instructive to perform the experiment in Fig. 2.2-1 but starting the experiments with a few over loads before continuing with the prescribed strain amplitude. In the experiment in Fig. 2.2-2 the load level 20.006 is preceded by ten load cycles at 20.03. The difference in hardening behavior with and without prior overloads is evident. The constant amplitude loading shows a slight hardening, whereas the two step load case shows softening, and the constant amplitude case is slowly approached. This leads to the conclusion that the hardening is not a unique material property. Neither can the hardening be modeled as a change of yield stress or modeled as isotropic hardening. If the hardening behavior would be isotropic, cyclic saturation of the stress response would mean that no more hardening would occur. However, tests with loading in several steps shows that hardening will persist even after saturation on a prior load level (Jiang/23/). This finding is in opposition to isotropic modeling, where cyclic saturation would prohibit any further hardening/softening.
w overload
Another type of hardening occurs due to non-proportional load condition. This phenomenon is denoted non-proportional hardening. Its nature can be examined by performing experiments at the same strain levels, but changing the direction of the load. This can be obtained by applying a sequence of uni-axial strain cycles in combination with pure shear strain cycles. If the relation between the uni-axial strain ranges and the shear strain ranges is
3the load levels can be regarded to be the same, excluding influence on hardening due to overloads. The results in Fig. 2.2-3 show that immediate hardening occurs between step one and step two, due to the change in loading direction only. Compare also step one and step three, in which the specimen is subjected to exactly the same shear strain. The difference is simply that step three was preceded by step two. Hence, the preceding uni-axial loading must be the cause of the much higher stresses in step three than in step one.Fig 2.2-3 Non-proportional hardening in SS304. The same specimen is cyclically loaded in three steps. Note the much higher stresses in step3 than in step 1 (Jiang/23/)
A specific type of hardening has been observed as secondary cyclic hardening. This hardening effect seems to occur for some austenitic steels after a larger number of cycles. Solin et. al. /37/ showed results where secondary hardening occurred for all load levels, but is most prominent for low load levels. The specimens where tested in air at room temperature. For strain amplitudes near the fatigue limit, (at 0.195% ) the secondary hardening is pronounced from 105 load cycles and onwards, see Fig. 2.2-4. This hardening will significantly decrease the portion of cyclic plastic deformation. Secondary hardening has been noted to have a significant influence on the constant amplitude fatigue limit as the amount of cyclic plastic deformation dramatically decreases and further fatigue damage accumulation is interrupted. The conditions for secondary hardening to occur or not is not known. It seems that some austenitic steels may show secondary hardening whereas, other may not. This is an important issue due to the impact on the fatigue limit. Chopra et. al. at ANL/12/ conducted similar experiments on a SS316, but observed no tendency for secondary hardening in room temperature which is in contrast to the VTT results, see Fig. 2.2-5. However, some tendency for secondary hardening occurred at T=288
o
Fig 2.2-4 Cyclic hardening under several load levels for an austenitic steel, SS347. Note the secondary hardening for the low strain amplitudes (Solin, /37/)
3 MATERIAL RATCHETING
3.1 Basic behavior
Material ratcheting is a form of ratcheting which occurs under cyclic loading even in the absence of structural effects. Unlike structural ratcheting, it occurs even if the stress is distributed
homogeneously. The effect can thus be seen as purely related to the material. The amount of ratcheting can be measured in experiments, albeit there is no universal definition. The strain caused by ratcheting accumulates progressively in one direction. (This is not to be confused to what is sometimes referred to as the accumulated effective strain which is a measure of the absolute length of the strain load trajectory. The accumulated effective strain is always strictly increasing, regardless if the load is monotonic or cyclic. Hence, the accumulated effective strain is not a useful measure of ratcheting. The accumulated strain may very well be increasingly large, without any ratcheting to occur.) In the context of ratcheting, the term "strain accumulation" means an increase in plastic strain by adding increments of plastic strain with their correct sign. In practice, the residual strain that persists after cyclic loading can be seen as a measure of the ratcheting strain.
Typical material ratcheting for specimens in uni-axial loading is shown in Fig. 3.1-1. All these
specimens are subjected to a homogeneous, uni-axial, load, excluding the influence of the structure. A mean stress deviating from zero is necessary for material ratcheting to occur. Note how the strain continues to increase in one direction, which is the actual ratcheting behavior. The strain caused by ratcheting increases incrementally in a cycle-by-cycle manner. Characteristic of material ratcheting is that the material is loaded with a constant stress along with the prescribed cyclic stress load. The constant load and the load range are the two determinant parameters in ratcheting. Material ratcheting is a common behavior for most metals, and no of the listed references can show a metallic material that does not exhibit ratcheting under these load conditions.
Some definitions are useful in order to quantify ratcheting and to compare different situations. The ratcheting strain increment (per cycle), p, can be mathematically defined as the difference in strain between two subsequent loads. The total strain can be taken as the mean plastic strain between the two subsequent loads, pmean. It should be noted that the mean strain must be taken with sign. A useful way of registering the amount of ratcheting is to measure the evolution of p and pmean under cyclic loading. These entities are illustrated in Fig. 3.1-2.
Fig. 3.1-2. Definition of strain ratcheting increment and mean strain.
A typical way of registering ratcheting is to measure the mean strain as a function of load cycles. A good illustration is found in ref. /21/ by Haupt and Schinke. An SS316 material was tested for material ratcheting under a number of conditions. The mean stress as well as the stress amplitude was
controlled, and several specimens were tested with different load conditions. The results can be seen in Fig 3.1-3, where the mean strain is shown as a function of the number of cycles. The loading is uni-axial. It is noted that the mean strain steadily increases, which corresponds to steady prolongation of the specimens. This is a typical material ratcheting behavior. Note that ratcheting is the most
pronounced during the initial loadings. This is a common feature with ratcheting and is sometimes denoted transient or better as primary ratcheting. The phenomenon can be seen in Fig 3.1-3, where the more pronounced ratcheting occurs in the beginning. In the secondary ratcheting the mean strain develops more slowly, despite unaltered load conditions.
pFig. 3.1-3. Ratcheting under different load conditions for an SS316 material (Haupt/21/). The ratcheting behavior and the rate of ratcheting are dependent of both the mean stress and the stress amplitude. Both parameters are necessary to characterize ratcheting. However, the mean stress seams to have some slightly dominating influence. Compare for example cases V6, V8and V9 or cases V4, V5 and V7 in Fig. 3.1-3. An increase of 20 MPa in mean stress increases ratcheting more than an increase of 20 MPa in amplitude.
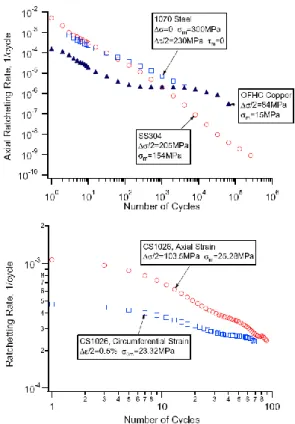
Common for all load combinations in Fig. 3.1-3 is that the rate of ratcheting decreases with the number of loads. The decrease of the ratcheting rate is referred to as ratcheting decay. Ratcheting decay is commonly observed for all types of material. An interesting investigation was performed by Jiang/23/. The ratcheting rate of ratcheting decay was measured under constant loading conditions for several materials. Jiang/23/ showed that the decay seemed to follow exponential relations. Hence, the relation between p and the number of cycles should be approximately linear in the log-log diagram,
under fixed ratcheting loads. These relations are shown in Fig. 3.1-4.
Mean stress / stress amplitude [MPa]
Secondary ratcheting Primary ratcting
Fig. 3.1-4. Ratcheting rate displays a nearly exponential dependence on the number of cycles (Jiang /23/).
3.2 MATERIAL RATCHETING UNDER COMPLEX
LOADING CONDITIONS
The ratcheting behavior becomes more complex with the complexity of the loading. A prominent example is given by Jiang et. al. /23/. The structural steel 1070 was used in the experiments. In the first case, the ratcheting load follows after one large single monotonic load, up to a strain of 4.5%. The subsequent ratcheting load, step two, was stress controlled with a mean stress of 100 MPa and a stress amplitude of 420 MPa. It is remarkable that the strain increment, p, in step two is negative, i. e.
opposing the mean stress. The specimen actually shrinks despite the presence of a positive mean stress! This is shown in Fig. 3.2-1. This phenomenon is in strong contrast to the ratcheting behavior if the ratcheting load would have been applied without any prior loading.
This phenomenon was further investigated by applying two different levels of ratcheting loads. The stress amplitude is the same for the two steps, 403 MPa, but the mean stress was lowered, from 208 MPa in step one to 78 MPa in step two. The mean stress however remained in the positive direction, so the positive mean stress is maintained throughout the two load steps. Also this time, the ratcheting strain increment is negative in step two.
Fig. 3.2-1 Two conditions under which ratcheting occurs in the opposite direction of the mean stress. The material is carbon steel 1070. (Jiang/23/)
Similar two step experiments on an austenitic type SS316 were performed by Haupt/21/. These experiments did not show negative ratcheting with a lowered mean stress, rather immediate
shakedown occured, see Fig. 3.2-2. This is different from the Jiang results for the 1070 steel in Fig. 3.2-1. It is uncertain whether this difference depends on the load condition or the type of material. It is noted that the lowering of the mean stress is much larger for the Jiang/23/ tests than in the Haupt tests/21/ for SS316, which may be a possible cause. A test on SS316 with larger difference in mean stress between the two steps could indicate if negative ratcheting is a general phenomenon or depending on the material.
Ratcheting
behavior after a
monotonic load
Ratcheting
behavior in two
steps
Fig 3.2-2. Two step cyclic loads for an austenitic 316 material. The load for each specimen is decreased after 100 cycles. Haupt et. al. /21/.
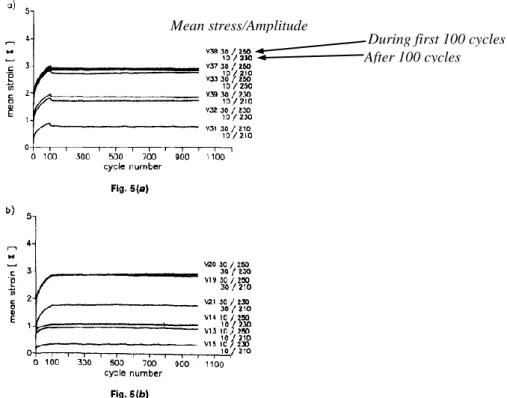
Chaboche/8/ has discussed the ability for plasticity models to capture ratcheting for loads in several steps. This has been a challenging task for the models. An experiment that has been subjected to discussions on the models capability is shown in Fig. 3.2-3. The material is stainless steel type SS316. The experiment was carried out under constant stress amplitude 200 MPa, but the mean stress is increased in subsequent steps of 20 MPa. The number of cycles at each level is more than 600. An important observation is that secondary ratcheting, or even almost shakedown, is reached after fewer cycles for lower mean stress than for higher mean stress. The tendency towards shakedown is weakened for the higher mean stresses.
During first 100 cycles After 100 cycles Mean stress/Amplitude
Fig. 3.2-3. Experimental results as discussed by Chaboche /8/
Similar tests to those discussed by Chaboche were carried out by Haupt/21/, also on type SS316 material. The tests lead to similar results as those obtained by Chaboche.
Fig. 3.2-4. Experimental results for an increased load in two step, Haupt/21/. Compare with Fig. 3.2-3.
3.3 Material ratcheting and cyclic softening
Quite extraordinary results are demonstrated by Hassan et. al. in 1992/17/. A carbon steel CS 1020 is tested for uni-axial material ratcheting. The ratcheting rate is clearly increasing, which is contrary to the ratcheting decay observed above. It is further claimed that the cyclic softening of this material is responsible for the accelerated ratcheting. A complementary test is performed, where the specimen is pre-cycled at zero mean stress in order to stabilize the material. This time much more stable ratcheting behavior appears, even if too few cycles are applied in order observe ratcheting decay.
Fig. 3.3-1. The material CS 1020 exhibit ratcheting acceleration (as opposed to ratcheting decay). Hassan et. al. /17/.
3.4 Multiaxial ratcheting
Biaxial ratcheting experiments are often used in order to determine model parameters. The typical biaxial case is obtained in a pipe, with different combinations of hoop stresses/strains and axial stresses/strains. The simplest case is obtained with a constant pressure (hoop stress) in combination with varying the axial strains. Somewhat more complicated load conditions are obtained if the pressure is also varying. These biaxial load conditions have the ability to create ratcheting strains in the circumferential direction.
Fig. 3.4-1. Three types of biaxial loading conditions.
From a modeling perspective, it is interesting to note that ratcheting under multiaxial load conditions can be obtained even without the capability to represent material ratcheting in the uniaxial sense. An example of this can be found in the work by Bari et. al. /2-4/, where ratcheting is provoked under some cases of multiaxial loading conditions. Each case is also analyzed by a linear kinematic model (LKIN) which is not capable of representing uniaxial material ratcheting. In spite of this, the LKIN model can
Ratcheting acceleration
Stable ratcheting after stabilization of the material
Fig. 3.4-2. Ratcheting under mulitaxial loading condition, comparing experiment and analysis with a LKIN model. Note the model’s disability to represent material ratcheting (Bari, /2/).
4 MODELS
Development of models for in-elastic behavior of materials has been an area for substantial development over the past 20-30 years and is still a very active research area. New models are developed even recently. Today’s FE codes provide models for the analysis of plastic deformation of metallic materials, even though the most recent models are yet to be implemented. The details of the models will not be described. However, the basic ideas behind the models will be outlined.
There will be no detailed outline of the theoretical basis for plasticity models. The book by Ottosen et al /34/ is recommended for a profound treatment of the theoretical basis. Some of the basic concepts shall however be outlined.
This outline will be restricted to Mises plasticity since this will make up for a more convenient description.
All model discussed in this report are based on the concept of a yield surface. This means that there is a surface defined in the stress space within which no plastic deformation can take place. For time-independent plasticity (which is the focus of this project) plastic deformation can only take place if the stress state is such that
0
)
(
f
Eq. 4-1
0
f
df
Eq. 4-2
In Mises plasticity it is assumed that plasticity is controlled by the second invariant, J2, of the tensor of
the deviatoric stress. The deviatoric stress equals the real stresses except that the average stress (the hydrostatic stress) has been subtracted
3 h I
S
Eq. 4-3
The equivalent Mises stress, is formulated on basis of the deviatoric stress S S eq 2 3
Eq. 4-4
There is a corresponding equivalent plastic strain, also essential in the modeling, is defined as:
p p p eq 3 2
Eq. 4-5
4.1 Isotropic hardening
The hardening that only includes surface expansion in the stress space is called isotropic. This type of hardening has less importance for cyclic loading. Isotropic hardening alone is incapable of describing a cyclic behavior that includes repeated cyclic deformation. However, isotropic hardening is
sometimes used for the purpose of modeling aspects of cyclic hardening mechanisms.
A common formulation is to describe the yield surface radius as a function of the accumulated equivalent plastic strain,
R
R
(
eqp)
0
(
eqp)
, with
0being the elastic limit. The radius R will expand as peq
increases during loading.
Fig. 4.1-1. Yield surface translation in isotropic hardening.
1
3
2
Initial yield surface
Current yield surface, f=0
Fig. 4.2-1. Yield surface translation in kinematic hardening.
4.3 Kinematic models in commercial FE programs,
ANSYS and ABAQUS
4.3.1 Linear kinematic hardening (LKIN)
In this section kinematic models are further investigated. The simplest assumption for the
evolution of the back stress tensor is to assume that it varies linearly with the plastic strains.
This assumption which is according to Melan-Pager reads:
p Cd X d 3 2
Eq. 4.3.1-1
This model can describe stable loops in cyclic loading, including the Bauschinger effect. However, the linearity makes the approximation of the Bauschinger effect rather crude. One special case of the LKIN model is with zero tangent modulus, which will be identical to the perfectly plastic model (PP).
Fig. 4.3.1-1 Linear kinematic hardening
4.3.2 Multi-Linear kinematic hardening (Mroz)
The multi-linear kinematic hardening model presumes that the material hardening takes place along
σ
ε
σy 1 3 2Initial yield surface
Current yield surface, f=0
p k
d
d
H
, is chosen. This corresponds to the employment of a set of linear kinematic models with several yield surfaces, each described by a yield function, f . Pure elastic response can only k prevail as long as the stress state is entirely within all yield surfaces, i. e. within the smallest of the surfaces. This model is capable of describing accurately the Bauschinger effect in cyclic loops. However, this model cannot describe material ratcheting. This has to do with the fact that the model always will produce symmetric loops, regardless of the mean stress. The symmetry implies that the plastic deformation will be the same in both directions, excluding any material ratcheting.Figure 4.3.2-1. The Mroz concept of several yield surfaces.
4.3.3 Armstrong-Frederick (AF)
A more sophisticated model that better captures the real physical behavior was developed by
Armstrong and Fredrick/15/ in 1967. The basis of the model is the addition of a “fading memory term” to the evolution law for linear kinematic hardening.
This addition reads: p eq p d X Cd X d 3 2
Eq. 4.3.3-1
The two parameters C and are the material parameters to be determined. The model can be regarded as consisting of two yield surfaces. This model will have a variable hardening modulus upon loading as long as the yield surface is not in contact with the bounding surface. As the inner surface gets in contact with the bounding surface, the model will be ideally plastic and the plastic modulus will be zero. The bounding surface will be fixed in the stress space and it can be shown that the maximum effective stress can be written
1 2 3
ε
σ
y H2 H3 H4 H5 E H1
eq,max
0
C
Eq. 4.3.3-2
Figure 4.3.3-1. The yield surface and bounding for the AF-model are shown. (Lemaitre/31/.) The smooth tangent modulus, enables a good representation of the Bauschinger effect. The most prominent improvement regards ratcheting under an asymmetric stress load. Unlike the MLKIN model, the plastic deformation will be different in loading and reversed loading with the presence of a mean stress different from zero. Thus the model can represent material ratcheting under uni-axial condition. In fact, the model will always provide a constant ratcheting rate with non-zero mean stress.
4.3.4 Chaboche model
The AF model was further developed by Chaboche/6/. This development was shown to improve the capability and flexibility of the model. The basic idea is a superimposition of several non-linear kinematic models.
n i p eq i i p i i n i i Cd X d X d X d 1 1 3 2 Eq. 4.3.4-1
This model has the same basic features as the AF-model. It is noted that the model becomes identical to the AF model with n=1. The increased number of parameters significantly increases the capability and flexibility of the model. Most notably, the constant rate ratcheting is avoided, and the model can represent ratcheting decay. Parameter determination is discussed later in this study. This discussion will further show the behavior and characteristics of the model. The model with n>1 is sometimes referred to as the superimposed Chaboche model.
4.3.5 AF model depending on field variables
It is possible instead to make the material parameters dependent on other variables, as an alternative to the superimposed Chaboche model. Van Eeten-Nilsson/14/ lets the parameters C and depend on the
maximum previous strain range,
maxp , thus enabling an improved representation of cyclic hardening in comparison to the basic AF-model.
p eq p p pd
X
d
C
X
d
max
max
3
2
Eq. 4.3.5-1
4.4 Advanced kinematic models (presently non
existent in commercial codes)
A few of the more advanced models are briefly outlined. Chaboche/8/ made further refinements of the superimposed model in order to enhance the capability for material ratcheting (Chaboche with a threshold). This model is composed of four superimposed models, where the fourth consists of a threshold value for the recall term. This term is activated only for larger values of the back stress tensor X . (The bracketed expression takes on it’s value only when larger than zero. Thus the recall 4
term will be activated only when 4 4
2 3
X
X is larger than the constant X .) 4
p eq p d X X X X d C X d 4 4 4 4 4 4 4 4 2 3 1 3 2
Eq. 4.3.5-1
Bari et al /4/ suggested a further development of the Chaboche model with a threshold, the modified Chaboche model. A complementary parameter, ’, is implemented in the hardening rule. This parameter will not affect uni-axial ratcheting. Instead, the parameter can be used in order to improve the multi-axial ratcheting behavior.
Moreover, the kinematic model can be combined with an isotropic hardening model. The traditional isotropic hardening model can to some extent simulate cyclic hardening though with strong
limitations. In order to overcome this shortcoming, the concept of a strain space surface can be utilized, the index surface (Lemaitre, Chaboche, /31/). Additional variables are then the index surface centre and size, which enhance the capability to simulate the strain range effect, and capture different regions of either cyclic hardening or cyclic softening.
The most recent developments of the Chaboche are extensions of the modified Chaboche model. A recent paper is presented by Krishna et. al. /27/, which presents a further development of the
modifications presented by Bari et. al. /4/. This model incorporates several additional parameters, with the aim to increase the flexibility of the model. The agreement with experiments is clearly improved. The obvious drawback is that parameter determination is becoming far more complicated.
Another model is proposed by Ohno-Wang and discussed in ref. /33/, the Ohno-Wang model. This model is based on the multi-linear representation, MLKIN. The Ohno-Wang model appears in some different versions. The model OW1 does not model material ratcheting, whereas OW2 involves a correction in order to capture material ratcheting. In most cases, the reference to the Ohno-Wang model, will mean OW2, i. e. the version that can handle material ratcheting. Another notable version is the so-called modified Ohno-Wang model, in which modifications are introduced in order to improve the representation of multiaxial ratcheting /10/.
5 STRUCTURAL RATCHETING
5.1 Bree type ratcheting, type A
Structural ratcheting can occur even without any influence of material ratcheting. This type of ratcheting is instead governed by the inhomogeneous stress state. The phenomenon can be analyzed with simple elasto-plastic models.
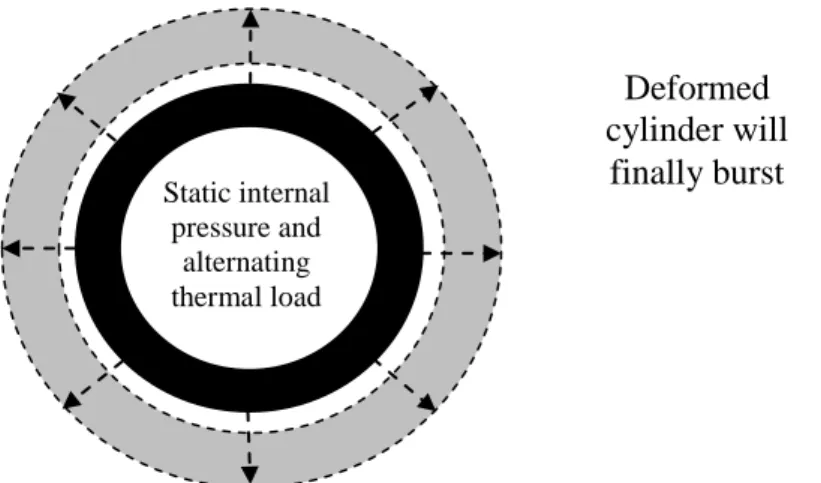
The classical case of structural ratcheting is the so called Bree cyclinder /5/. In this case a cylinder is subjected to a primary load, the internal pressure, and the inner surface is simultaneously subjected to a cyclic thermal load, which is by nature secondary. A rather straight forward analysis can show that the cylinder diameter will progressively increase under certain load combinations, increment by increment for each load cycle. This may happen even if the elastically computed stress range is within the elastic limits, i. e. the conditions for elastic shake-down are met,
elastic
2
0. The mechanism is commonly known as thermal ratcheting, which is a category of structural ratcheting. If thermal ratcheting is not prevented, final burst of the cylinder may occur or the fatigue process is accelerated. The pressure vessel standards normally include rules for addressing risks associated with thermal ratcheting. Applicable standards, such as ASME III/41/, consider thermal ratcheting Bree case by rather simple formulas.Figure 5.1-1. Bree cylinder with static pressure and alternating thermal load in thermal
ratcheting
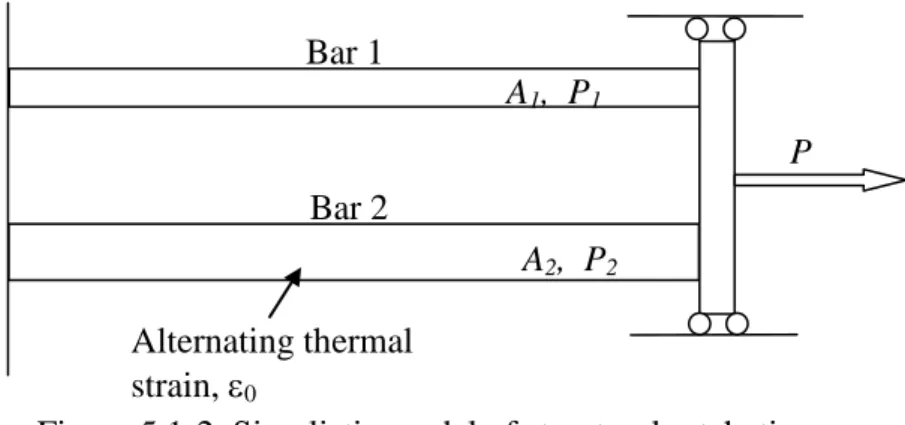
An instructive and illustrative way of understanding structural ratcheting is to study a two bar system. This system is analogue with the Bree cylinder, but is simpler to analyze and hence to demonstrate the basic thermal ratcheting behavior. The system will be subjected to a primary load, the force P, and one of the bars is subjected to an alternating thermal strain, 0. This strain is repeatedly applied and removed. Static internal pressure and alternating thermal load
Deformed
cylinder will
finally burst
Figure 5.1-2. Simplistic model of structural ratcheting
The basic equations for analysis can be easily set up.
The conditions are:
2 2 1 1 2 1
P
A
A
P
P
(Equilibium)
2 1
(Continuity)
Where:
P is the force pulling the bar
P
1, P
2is the force in bar 1 and bar 2
1,
2is the stress in bar 1 and bar 2
A
1, A
2is the cross-sectional area of bar 1 and bar 2
1,
2is the end deformation of bar 1 and bar 2
The example is solved with an elastic-perfectly plastic model. The force P is constant and the homogeneous thermal strain ε0 is cyclically added to bar 2. Under the right conditions the bars will
deform progressively and the length of the bars will become infinite. The ratcheting behavior can be seen Fig. 5.1-3 where the length of the bars vs. number of cycles is plotted for the analytical example.
P
Bar 1
Bar 2
A
1, P
1A
2, P
2Alternating thermal
strain,
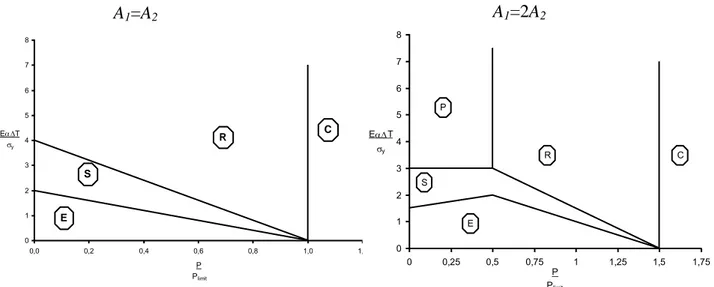
0 0 10 20 30 0.1 0.101 0.102 Bar 1 Bar 2 L engt h of ba rs LLj 0 LLj 1 Prog ressiv e def ormatio nprevails after some initial plastic strains. Another possibility is that plastic shakedown (P) is obtained after some cycles. The ratcheting behavior in Fig 5.1-24is denoted (R). The final possibility is that the systems deforms monotonically, with unlimited plastic deformation, resulting in collapse(C). For a two-bar system the case with equal bars will be special. In Fig 5.1-4, the Bree diagram for a two-bar system is shown. The normalized primary load is on the x-axis and the normalized thermal load is on the y-axis.
Fig 5.1-4. Normalized Bree diagram for the two-bar system. Left diagram is the special case with equally sized bars.
The same thermal ratcheting analysis can be performed for the cylindrical pressure vessel, however some more tedious mathematical work is required. These calculations can be found in Bree’s original paper from 1967 /5/. In fact, the rules in ASME III for ratcheting are based on these considerations.
0 1 2 3 4 5 6 7 8 0,0 0,2 0,4 0,6 0,8 1,0 1,2 P Plimit EaT y R S E C 0 1 2 3 4 5 6 7 8 0 0,25 0,5 0,75 1 1,25 1,5 1,75 P Plimit EaT y S P R E C
A
1=A
2A
1=2A
2y
: yield stress
p
: primary stress
5.2 Structural ratcheting without primary stress, type B
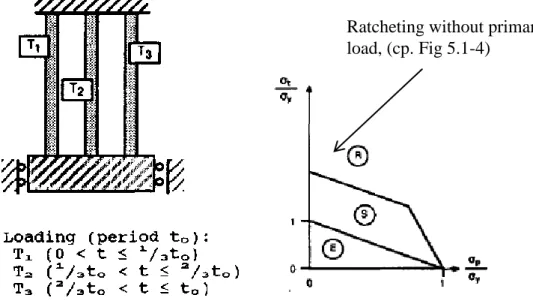
Recent years have experienced a focus on configurations that, unlike the Bree case, does not require a primary load in order for structural ratcheting to occur. This situation is best illustrated by a three-bar system. Such a system is shown in Fig. 5.2-1.
Fig. 5.2-1. A three-bar system that can exhibit structural ratcheting without a primary load. The corresponding Bree diagram is shown. From Hübel /22/.
The origin of the interest for this configuration stems from the problem of a cylinder that is
subjected to a temperature gradient that travels in the axial direction. This problem has
attained quite extensive focus in conjunction with the interest for Fast Breeder reactors (FBR),
where this is of practical interest. Several references /25, 29, 30/ deals with this problem. An
instructive discussion on the different types of ratcheting is done by Hübel in ref. /22/.
6 MODEL CAPABILITIES
6.1 Material ratcheting
An important question is to what extent and with what accuracy the models can handle different forms of ratcheting.The LKIN models and the MLKIN model are incapable to represent any uni-axial material ratcheting at all. Immediate shakedown will occur at cyclic loading. Thus these models are not applicable in cases where this type of ratcheting is of importance.
Ratcheting without primary
load, (cp. Fig 5.1-4)
Thus the AF-model may have some applicability in cases where conservatism is needed and can be secured by the AF-model.
Fig 6.1-1. The figure (a) shows the Bauschinger effect quite well represented by the AF-model. However, all ratcheting rates are overestimated. Pure material ratcheting is shown in (c). Bari/2/. The Chaboche model (in it’s superimposed) form has better capability. A direct comparison with the AF-model in Fig. 6.1-1 is found in Fig. 6.1-2. Still, a general trend is that the ratcheting rate is overestimated, for all cases. The modified Chaboche /8/ model was developed in order to enhance the capability for material ratcheting. The basis was an experiment with stepwise increase in the mean stress. As clearly shown in Fig. 6.1-2, the ratcheting is greatly influenced by the mean stress. The material in this case is SS316. It is noted that the results by Haupt/21/, Fig. 3.1-3, lead to the same conclusion, namely that the mean stress is the main parameter for material ratcheting. Analyses with different hardening models are analyzed by Chaboche /8/. The results for a model with linear hardening (LK) and a three-parameter Chaboche model (NLK) is shown in Fig. 6.1-3. As expected, the linear model predicts no ratcheting. The Chaboche model predicts increased ratcheting rate for increased mean stress. However, the shape difference between the rate evolution between low and high mean stress was not modeled well. Improvements are obtained with the modified Chaboche model, where a threshold is imposed on the fourth term. The modified Chaboche model is termed NLK-T in Fig. 6.1-3. Note that the mean stress dependency is far better captured with the modified Chaboche. The modified Chaboche model was also investigated by Bari /2000/. This investigation shows some slight improvements by the Chaboche model. These improvements hold for the uniaxial ratcheting experiments. Still, overestimation of biaxial ratcheting persists. See Fig 6.1-4.
Fig 6.1-3. Ratcheting analysis of the experiment in Fig. 3.2-3. The modified Chaboche model (NLK-T) improves the simulation. The NLK model represents the conventional Chaboche model.
Fig 6.1-4. Ratcheting results for the modified Chaboche model, with a threshold on the fourth superimposed model. Compare with Fig. 6.1-2 and note some improvements for the uniaxial
ratcheting experiments. Bari /2/
6.2 Model comparison for structures
6.2.1 Bree Cylinder
There are few evaluations of how the material models apply to structures. Steingrimsdottir/38/ made a numerical study where the simple two-bar model was analysed with the conventional models. All
Noteworthy, is the region in Fig. 6.2.1-1 where the PP model predicts ratcheting, where the Chaboche model does not. This is the region with relatively high primary load, i.e. the region for classical structural ratcheting. The ratcheting for the PP model is hence a pure structural effect, and can be controlled by the setting of the yield limit. It is noted that the PP model can only predict ratcheting under the presence of a primary load well above zero. This is in contrast to the Chaboche model that predicts ratcheting with an almost negligible primary load. The PP model predicts plastic shakedown in this region. It is probable that ratcheting in this region is triggered by material ratcheting.
Very little experimental data on thermal ratcheting on structures of Bree type exists to support any of the model results. The only experiment with relevance is performed by Lang et. al. /27/, where a four-bar system is employed. However, results are presented for only one load combination and is hence of limited use for model verification.
Fig. 6.2.1-1. Bree-diagram: Results for a structure with unequal area bars where PP, NLK and
MLKIN model are compared. Steingrimsdottir /37/.
6.2.2 Axially moving temperature distribution
Fig. 6.2.2-1 shows a schematic diagram of a cylinder subjected to a moving axial thermal load. No
primary load need to exist for ratcheting to occur. However the stress range must exceed at least twice the elastic limit. As the temperature distribution with steep gradients moves cyclically in the axial direction, the permanent inelastic progressive deformation mode of either expansion or contraction can occur. The deformation modes of expansion or contraction are influenced by the thermal loading such as the heating or cooling rate as shown in Fig. 6.2.2-1, and the geometric parameters such as the thickness, height or diameter of the cylinder.
Fig. 6.2.2-1. Principle sketch of thermal ratcheting without a primary load.
Fig. 6.2.2-2 shows the recorded progressive accumulation of the radial inelastic deformation of a test
performed by Lee et. al. /29/. The test was performed on a cylinder of SS316, loaded with an axially moving temperature gradient.
The thermal axial load of 550
oC was applied nine times and the
deformation was measured. The time dependent temperature distribution of the test cylinder
was also measured and was used as input for the ratcheting analysis. The thermal ratchet
deformations were computed with a kinematic AF-model, that was combined with isotropic
hardening. The material parameters were determined from stable, cyclic stress-strain data.
The residual displacement after each cycle of the thermal load was measured and compared
with the calculations. The ratcheting deformations obtained by the analysis with the numerical
model were in reasonable agreement with those of the structural tests. The results suggest that
hardening models of this type tend to overestimate ratcheting.
problem. No verifying tests were conducted. Apart from the perfectly plastic model (PP), three hardening models were employed. These were linear kinematic hardening (LKIN), the AF-model and an Ohno-Wang model (OW1). Note that this OW-model is not capable of capturing any material ratcheting hardening (unlike the OW2-model). This means that the OW-model corresponds to a multi-linear kinematic model. Of these four models, only the AF-model is capable of representing uni-axial material ratcheting. All models predicted ratcheting behavior. Note that the PP model gives the most conservative prediction and the least conservative representation is given by the OW-model.
Fig. 6.2-3. Influence of hardening on the prediction of ratcheting in a cylinder subjected to axially moving temp /25/. The radial deformation is shown.
6.2.3 Pipe structures
Rahman and Hassan /20, 35/ investigated an elbow of SS304, subjected to a constant internal pressure, simultaneously subjected to a cyclic displacement control. The displacement amplitude is controlled for three different constant internal pressure levels, 0, 11.3 and 20.70 MPa.
Fig. 6.2.3-1. Elbow ratcheting experiment. With load table.
An important parameter of these experiments is the change of shape of the cross-section in the middle of the pipe, i. e. the size change and the ovalization. The diameter change in two perpendicular directions was registered as a function of the load. The two parameters are Dx and Dy defined as
shown in the figure 6.2.3-2. Another important parameter is the evolution of the mean strains with the number of cycles.
Figure 6.2.3-2. The progressive deformation occurs through cross-section changes.
Extrados Intrados
occurred in the axial direction for all pressure levels. Hence, it can be assumed that a bi-axial ratcheting is predominant.
The models employed were linear kinematic model (LKIN), the multi-linear kinematic model (MLKIN) as well as a standard Chaboche model and a modified Chaboche. The models were attuned to material response before the structural tests. Remember again that the LKIN and MLKIN are not capable of representing uniaxial ratcheting.
Fig. 6.2.3-3. Comparison for flank diameter change. Left LKIN and MLKIN. Right Chaboche and modified Chaboche.
Fig. 6.2.3-4. Comparison for mean circumferential strain at the flanks. Left LKIN and MLKIN. Right Chaboche and modified Chaboche.
Fig. 6.2.3-5. Comparison for mean circumferential strain at the intrados. Left LKIN and MLKIN. Right Chaboche and modified Chaboche.
Fig. 6.2.3-6. Comparison for mean circumferential strain at the extrados. Left LKIN and MLKIN. Right Chaboche and modified Chaboche.
The simulations in Fig. 6.2.3-3-6, show that the bilinear and multilinear models are incapable of simulating ratcheting responses. These models are simulating shakedown responses after few cycles for most cases, whereas the experimental responses show continued ratcheting. The shakedown simulation is the deficiency of the linear kinematic hardening rule and is also observed at the material level simulations.
Simulations of elbow ratcheting responses by the Chaboche models are improved significantly compared to simulations by the LKIN and the MLKIN models. Most important is that continued ratcheting is predicted for the circumferential mean strains at the flanks, where the dominant local ratcheting occurs. In view of the 5% accumulated strain criterion in ASME III only the Chaboche model would provide reliable results. See Fig. 6.2.3-4.
Although the Chaboche models perform better than the LKIN and MLKIN models none of the models are capable of capturing the full picture. This is most evident from Fig. 6.2.3-6. For the highest pressure positive ratcheting occurs, where the models predict negative or no ratcheting. These
shortcomings prevailed also for the non-standard models that were investigated by Hassan et. Al. /20/. Another interesting investigation of a pipe elbow is performed by DeGrassi et. al. /13/. An
experimental set-up similar to the one described above is utilized. The purpose is to study the seismic response. Three different types of models are investigated, the LKIN, the MLKIN and the
conventional Chaboche, with three superimposed models, n=3 in Eq. 4.3.4-1. All models were calibrated to represent the cyclic stress strain response. In a preliminary test, the flank strains were registered as a function of the number of cycles. The elbow structure in Fig. 6.2.3-7 was loaded with constant amplitude deformation control at the ends, while the pipes were subjected to constant internal pressure. This time the material is a carbon steel. The elbow was cycled until fatigue cracking
occurred at the flanks after 185 cycles, i. e. a very significant low-cycle failure. It is clearly seen that the LKIN and MLKIN models predict shake-down, not at all in agreement with the experiments. Through parameter variation of the Chaboche models (Parameter 3, important for ratcheting only)
Fig. 6.2.3-7. Experimental set-up by DeGrassi et al /13/, Comparison between tests and analyses. Cbahoche model with 3=1 is chosen as the best model.
Another set up was developed in order to study the seismic characteristics of pipe systems under internal pressure. The set-up consists of a two elbow pipe system with masses attached. Only in-plane displacements are significant. The seismic input was large enough to provide elasto-plastic response in the system. An FE model of the system was built up, with the corresponding internal pressure and the corresponding pressure. The experimental set-up along with experimental and computed results are shown in Fig. 6.2.3-8.
Fig. 6.2.3-7. Seismic set-up by DeGrassi et al /13/. Comparison between tests and analyses, LKIN (BKIN), MKIN and Chaboche (CHAB).
Comparisons to test results demonstrated the superior performance of the Chaboche model versus the two linear models, particularly with regard to predicting the strain ratcheting behavior of the system. Both linear models predicted shakedown sooner than observed during the test. The LKIN model overpredicted the accumulated permanent strain at end of test, while the MLKIN model
the two linear plastic hardening rules. The nonlinear model produced the best match to test results in terms of predicting both the accumulated strain and the overall ratcheting behavior and shakedown versus time.
Although the elbow examples show advantages for the Chaboche model, tests on a straight pipe by Rahman et. al. /35, 36/ reveals a more complicated picture. The experimental set-up is similar to the previous one, however with a straight pipe only. The material is alloy steel 4130. The ends are subjected to constant amplitude rotation, whereas the internal pressure is kept constant during the investigation. These tests are repeated with different levels of rotation amplitude.
Fig. 6.2.3-8. Sketch of the straight pipe bending device, with load table.
A significant difference from the elbows is that very little strains appear at the flanks, the maximum strains appear symmetrically at the top and bottom. Ratcheting occurs through change of mid-section of the pipe and circumferential strains at the top and bottom of the pipe. Unlike the elbow, little progressive circumferential strains occur on the flank. Very little ratcheting occurs in the axial direction. This is likely to depend on the relatively low axial stresses as induced by the pressure (half the magnitude of the circumferential stresses), but also of the deformation controlled load, instead of stress control of mean and amplitude, which is typically triggering uni-axial material ratcheting.
For this configuration the Chaboche model underpredicted ratcheting in comparison to the MKIN. This is notable since the Chaboche model was attuned to both uni-axial and multi-axial ratcheting.
Fig. 6.2.3-9. Comparison for diameter change, a) in the bending plane, b) out of the bending plane. /Rahman, 35/. Note that the Bilinear model in the figure is the same as the LKIN model.
Fig. 6.2.3-9. Comparison of diameter change, a) on top of pipe, b) on side of pipe. /Rahman, 35/. Note that the Bilinear model in the figure is the same as the LKIN model.
Actually, this difficulty to represent ratcheting well prevailed with all the advanced models (modified Chaboche, Ohno-Wang etc) that were applied to the structure. All models under-predicted ratcheting for the higher load. Common for these models were that they were only calibrated on the material level, i. e. uni-axial and bi-axial ratcheting before the analysis of the structure.
The reason that the models failed to simulate the structural responses could be attributed to either that the parameters determined from material responses were not representative of the structural responses, or that the constitutive models are incapable of simulating the structural ratcheting responses. The first reason was scrutinized. It was found that the data used for parameter determination was not
representative for the structural test. The load state on the top/bottom of the pipe resembles closely the bi-axial test condition with a static stress ,
,in the circumferential direction and a controlled strain amplitude in the axial direction,
ax. It was observed that the axial strain amplitude in the bi-axial tests was 0.4%, which is comparable to the axial strain amplitude for the structure at the lower load. However, at the higher load the strain amplitude was 0.88% which is double the magnitude of the material tests. Moreover, it was observed that the cyclic response tended to be stiffer in stress control than in strain control. This observation was also found to have an impact on the results for the structure.An advanced type of Chaboche model was selected for parameter refinement. The refinement improved the correlation between analysis results and the observed ratcheting. However a very good
a
b
compromise. The parameter set that best predicted structural ratcheting for the high load, over-predicted ratcheting for the lower load as well for the uni-axial ratcheting test.
These findings show the difficulties in applying a model to a structure, if the model parameters have been determined from material responses only. It was suggested that parameter calibration should be performed for material tests over several loads, ranging from low to high in order to cover several ranges of material response. Of high importance is that the material data for parameter determination is relevant for the structure that will be analyzed. A good check is to verify that the local material response in the structure is covered by the material data. An example is the case when a structure displays a high level of biaxial ratcheting as in the pipe examples above. It should then be verified that the biaxial ratcheting data for parameter determination is similar to the local response in the pipe. An earlier investigation for a straight pipe did not experience similar difficulties with the Chaboche model (Hassan, /19/). Here an AF-model was compared to an LKIN model for a pressurized pipe subjected to deformation control bending amplitude. The models were attuned to stable stress-strain and a constant amplitude level ratcheting response in the structure was used for parameter
determination. Thereafter, the set-up was subjected to a sequence of different load levels, with simultaneous measurement of the evolution of the mean circumferential strain. The procedure was performed at two levels of internal pressure. Initially, the LKIN over-predicts ratcheting, whereas the AF-model under-predicts. However, the LKIN model finally leads to shake-down, which is not realistic. The AF-model on the other hand seems capable of representing the longer trend.
Fig. 6.2.3-10. Experimental set-up in Hassan /19/. Circumferential ratcheting results shown for the tests at two different pressure levels.
Although the ratcheting analyses with standard plasticity models are difficult, the question about the accuracy for strain amplitudes arises. The strain amplitude is the prime input to fatigue analyses. It is seen from the figures below that the amplitudes are generally well represented. The strain amplitudes
AF LKIN
AF LKIN
Fig. 6.2.3-11. Comparison of strain amplitudes at the top of the straight pipe. a) circumferential strain amplitudes, b) axial strain amplitudes (Rahman, /35/). Note that the Bilinear model in the figure is the
same as the LKIN model.
Fig. 6.2.3-12. Comparison of strain amplitudes at the flank of the elbow. a) circumferential strain amplitudes, b) axial strain amplitudes (Rahman, /35/). Note that the Bilinear model in the figure is the
same as the LKIN model.
Fig. 6.2.3-13. Comparison of strain amplitudes at the intrados of the elbow. a) circumferential strain amplitudes, b) axial strain amplitudes (Rahman, /35/). Note that the Bilinear model in the figure is the
same as the LKIN model.
7 PARAMETER DETERMINATION
Among commercially available models, the Chaboche model is the only model that can represent material ratcheting. Despite these abilities, the discussions in the previous sections above clearly demonstrated limitations in structural analysis, even under rather simple constant amplitude loads. It was concluded that the determination of the model parameters from a few material tests may be
b
a
b
a
b
in view of such criterion as the 5% strain criterion in ASME III, NB 3228.4. Rahman /35, 36/, DeGrassi /13/ and Hassan /19,20/ all used parameter adjustments that also included the structural response, alongside material response, in order to obtain better results.
A recommendation is to use material data over a larger load range. The straight pipe experiment by Rahman et. Al emphasized the importance of having material responses with load that closely resembles the structural response in terms of stress and strain. However, calibrating the standard Chaboche model (such as for example a six parameter model) for a large set of data is difficult. Steingrimsdottir /38/ reported of the difficulties of calibrating the Chaboche model to a large set of uni-axial ratcheting data. Rather large compromises were necessary.
Despite these short-comings, some advises for parameter determination will be given. A prime recommendation is to always match the model for cyclic behavior as the monotonic and cyclic behavior may be very different. It is also important to consider ratcheting effects in the parameter determination if this is important in the evaluation.
7.1 Linear and Multi-linear kinematic models (LKIN
and MLKIN)
The MLKIN model is able to accurately represent a hysteresis loop, if small enough linear segments are chosen. Note, however that no uni-axial ratcheting behavior can be represented. An accurate representation of the MLKIN model for stable hysteresis behavior may give accurate amplitudes, but there is a risk that the level ratcheting in structures is underestimated.
The LKIN model will always have a crude representation of the hysteresis loop and neither can uni-axial ratcheting be represented. However, the possibility for the LKIN model is to set a low enough elastic limit. Thus the pure form of structural ratcheting may be conservatively represented.
7.2 The AF and the Chaboche model.
The AF model is relatively simple for parameter determination, since it is possible to express it’s behavior analytically. The relation between strain and stress amplitudes is expressed as
0
2
tanh
2
C
pEq. 7.2-1
The tangent modulus at initial plastic deformation will be
H
d
d
p
C
. A feature of the model is that it will approach perfectly plastic behavior as the plastic strain increases. The limiting stress is
0
C
.Moreover, the AF model will produce constant uni-axial ratcheting. The expression for the rate is: